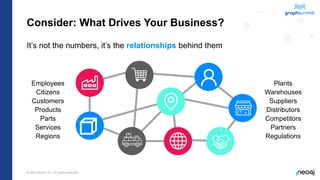
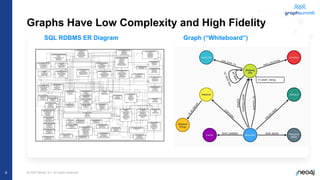
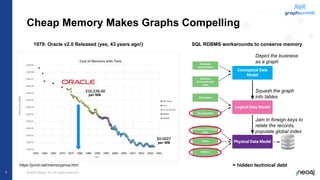
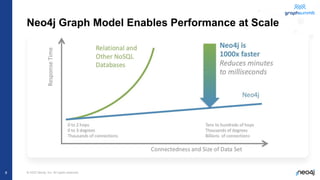
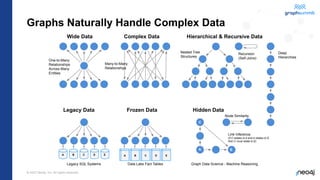
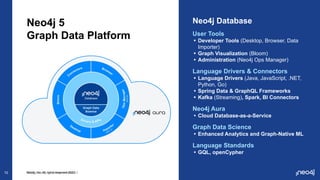
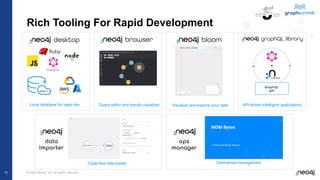
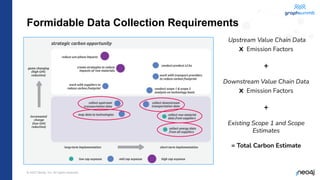
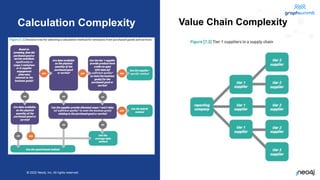
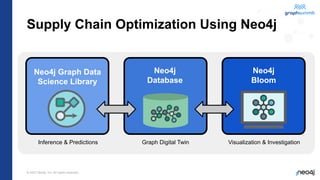
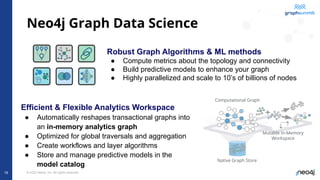
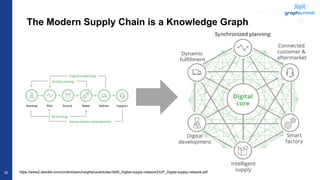
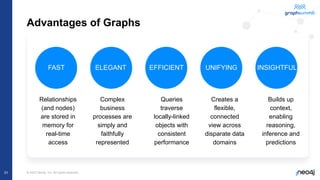
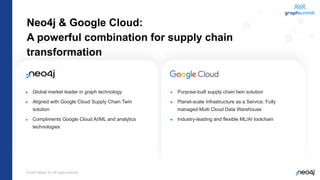
© 2022 Neo4j, Inc. All rights reserved.
Optimizing Your
Supply Chain
with the Neo4j
Graph Platform
© 2022 Neo4j, Inc. All rights reserved.
Michael Moore, Ph.D.
Principal, Partner Solutions &
Technology
© 2022 Neo4j, Inc. All rights reserved.
Consider: What Drives Your Business?
It’s not the numbers, it’s the relationships behind them
Plants
Warehouses
Suppliers
Distributors
Competitors
Partners
Regulations
Employees
Citizens
Customers
Products
Parts
Services
Regions
© 2022 Neo4j, Inc. All rights reserved.
This is a Graph
© 2022 Neo4j, Inc. All rights reserved.
“By 2025, graph technologies will be
used in 80% of data and analytics
innovations...”
Top 10 Trends in Data and Analytics, 11 May 2020, Rita Sallam et al.
© 2022 Neo4j, Inc. All rights reserved.
6
Graphs Have Low Complexity and High Fidelity
SQL RDBMS ER Diagram Graph (“Whiteboard”)
© 2022 Neo4j, Inc. All rights reserved.
Depict the business
as a graph
Squash the graph
into tables
Jam in foreign keys to
relate the records,
populate global index
7
Cheap Memory Makes Graphs Compelling
https://jcmit.net/memoryprice.htm
SQL RDBMS workarounds to conserve memory
1979: Oracle v2.0 Released (yes, 43 years ago!)
= hidden technical debt
per MB
per MB
© 2022 Neo4j, Inc. All rights reserved.
8
Neo4j Graph Model Enables Performance at Scale
© 2022 Neo4j, Inc. All rights reserved.
Graphs Naturally Handle Complex Data
A B C D E
A B C D E
One-to-Many
Relationships
Across Many
Entities
Wide Data Complex Data Hierarchical & Recursive Data
Many-to-Many
Relationships
Nested Tree
Structures
Recursion
(Self-Joins)
Deep
Hierarchies
Link Inference
(If C relates to A and A relates to E,
then C must relate to E)
Node Similarity
Hidden Data
Legacy Data Frozen Data
Legacy SQL Systems Data Lake Fact Tables Graph Data Science - Machine Reasoning
A
C
E
© 2022 Neo4j, Inc. All rights reserved.
10 Neo4j, Inc. All rights reserved 2022
Neo4j 5
Graph Data Platform
Neo4j Database
User Tools
• Developer Tools (Desktop, Browser, Data
Importer)
• Graph Visualization (Bloom)
• Administration (Neo4j Ops Manager)
Language Drivers & Connectors
• Language Drivers (Java, JavaScript, .NET,
Python, Go)
• Spring Data & GraphQL Frameworks
• Kafka (Streaming), Spark, BI Connectors
Neo4j Aura
• Cloud Database-as-a-Service
Graph Data Science
• Enhanced Analytics and Graph-Native ML
Language Standards
• GQL, openCypher
© 2022 Neo4j, Inc. All rights reserved.
Rich Tooling For Rapid Development
Local database for rapid dev Visualize and explore your data API-driven intelligent applications
Query editor and results visualizer
data
Importer
Code-free data loader
ops
manager
Centralized management
11
© 2022 Neo4j, Inc. All rights reserved.
Demand Shaping Inventory Positioning Perfect Fulfillment Sustainability
Consider a omni-channel,
multi-echelon supply chain and
demand & supply risk to
determine optimized inventory
levels
Combine distributed order
management with warehouse
and transportation optimization
and enable automation of
processes
Reduce energy consumption
across operations, measure
risks, measure gas emissions,
adopt a circular economy and
measure the social impact of
your supply chain
Understand customers and
market trends to dynamically
adjust segmentation, promotions
and generate highly accurate
forecasts
Demand Shaping Inventory Positioning Perfect Fulfillment Sustainability
Supply Chain Complexity Issues
End-to-End Supply Chain Visibility
© 2022 Neo4j, Inc. All rights reserved.
Supply Chain Graphs
• Global Supply Chain Visibility
• Routing, Logistics, Distribution
• BOM Management
• Supply Chain Resiliency
• Scope 3 Carbon Reporting
© 2022 Neo4j, Inc. All rights reserved.
Supply Chain Digital Twins
Digital Supply Chain Twins—Conceptual Clarification, Use Cases and Benefits
Benno Gerlach, Simon Zarnitz, Benjamin Nitsche and Frank Straube
Logistics 2021, 5, 86. https://doi.org/10.3390/logistics5040086
Network Level
Site Level
Organizations' supply chains often account for more than
90% of their greenhouse gas (GHG) emissions, when
taking into account their overall climate impacts.
© 2022 Neo4j, Inc. All rights reserved.
15
GHG Reporting Requirements
GHG
Reporting
Timelines
• March 21, 2022:
SEC released new
proposals for
climate-related risk
disclosures.
• February 2024:
First disclosures on
Scope 1 and 2 for
large organizations.
• February 2025:
Disclosures on Scope
3 emissions and
emissions intensity
required for large
organizations.
© 2022 Neo4j, Inc. All rights reserved.
Formidable Data Collection Requirements
Upstream Value Chain Data
x Emission Factors
+
Downstream Value Chain Data
x Emission Factors
+
Existing Scope 1 and Scope
Estimates
= Total Carbon Estimate
© 2022 Neo4j, Inc. All rights reserved.
Value Chain Complexity
Calculation Complexity
© 2022 Neo4j, Inc. All rights reserved.
Supply Chain Optimization Using Neo4j
Neo4j Graph Data
Science Library
Neo4j
Database
Neo4j
Bloom
Inference & Predictions Graph Digital Twin Visualization & Investigation
© 2022 Neo4j, Inc. All rights reserved.
Robust Graph Algorithms & ML methods
● Compute metrics about the topology and connectivity
● Build predictive models to enhance your graph
● Highly parallelized and scale to 10’s of billions of nodes
19
Neo4j Graph Data Science
Mutable In-Memory
Workspace
Computational Graph
Native Graph Store
Efficient & Flexible Analytics Workspace
● Automatically reshapes transactional graphs into
an in-memory analytics graph
● Optimized for global traversals and aggregation
● Create workflows and layer algorithms
● Store and manage predictive models in the
model catalog
© 2022 Neo4j, Inc. All rights reserved.
20
65+ Graph Data Science Techniques in Neo4j
Pathfinding &
Search
• Shortest Path
• Single-Source Shortest Path
• All Pairs Shortest Path
• A* Shortest Path
• Yen’s K Shortest Path
• Minimum Weight Spanning Tree
• K-Spanning Tree (MST)
• Random Walk
• Breadth & Depth First Search
Centrality &
Importance
• Degree Centrality
• Closeness Centrality
• Harmonic Centrality
• Betweenness Centrality & Approx.
• PageRank
• Personalized PageRank
• ArticleRank
• Eigenvector Centrality
• Hyperlink Induced Topic Search (HITS)
• Influence Maximization (Greedy, CELF)
Community
Detection
• Triangle Count
• Local Clustering Coefficient
• Connected Components (Union Find)
• Strongly Connected Components
• Label Propagation
• Louvain Modularity
• K-1 Coloring
• Modularity Optimization
• Speaker Listener Label Propagation
Supervised
Machine Learning
• Node Classification
• Link Prediction
… and more!
Heuristic Link
Prediction
• Adamic Adar
• Common Neighbors
• Preferential Attachment
• Resource Allocations
• Same Community
• Total Neighbors
Similarity
• Node Similarity
• K-Nearest Neighbors (KNN)
• Jaccard Similarity
• Cosine Similarity
• Pearson Similarity
• Euclidean Distance
• Approximate Nearest Neighbors (ANN)
Graph
Embeddings
• Node2Vec
• FastRP
• FastRPExtended
• GraphSAGE
• Synthetic Graph Generation
• Scale Properties
• Collapse Paths
• One Hot Encoding
• Split Relationships
• Graph Export
• Pregel API (write your own algos)
© 2022 Neo4j, Inc. All rights reserved.
DEMO
© 2022 Neo4j, Inc. All rights reserved.
22
North American Rail Network (NARN) Digital Twin
North American Rail Network
Total 527K Miles of Track
USDOT NARN GEOJSON datasets - nodes and lines
253K nodes, 715K relationships, 1GB
https://github.com/graphadvantage/neo4j-na-rail-network
Norfolk Southern rail network graph plotted using NeoMap
© 2022 Neo4j, Inc. All rights reserved.
Neo4j Graph Database
Yards connected by track type
Graph Data Science - Projecting Network Views
main-lines-network
Has low bridges & tunnels
double-stack-network
No low bridges & tunnels
Neo4j Graph Data Science
Projected virtual graph views
standard rail car
double-stack
intermodal rail car
© 2022 Neo4j, Inc. All rights reserved.
24
Neo4j Pathfinding
//Project main lines
CALL gds.graph.project(
'main-lines-network', 'Node', {relType: {type:
'CONNECTS_MIO', orientation: 'UNDIRECTED',
properties: {miles: {property: 'miles',
defaultValue: 1}}}}, {})
//Project double stack lines
CALL gds.graph.project(
'double-stack-network', 'Node', {relType: {type:
'CONNECTS_DS', orientation: 'UNDIRECTED',
properties: {miles: {property: 'miles',
defaultValue: 1}}}}, {})
//Find a route
CALL gds.shortestPath.dijkstra.stream(
'main-lines-network',
{relationshipWeightProperty: 'MILES',
sourceNode: id(start), targetNode: id(end)})
What is the lowest cost path between two points?
“Cost” could be physical distance, fuel consumption, trackage fees, carbon emissions, etc
Dijkstra shortest path solution visualized in NeoDash
Minimize
this cost
© 2022 Neo4j, Inc. All rights reserved.
Graph Algorithms in Supply Chains
Graph algorithms enable reasoning
about network structure
K-Shortest Paths to identify the best
alternative routes
© 2022 Neo4j, Inc. All rights reserved.
26
Graph Algorithms in Supply Chain
Graph algorithms enable reasoning
about network structure
K-Shortest Paths to identify the best
alternative routes
Betweenness Centrality to find
critical bottlenecks or risk points
Degree Centrality to see distribution
centers with high use
© 2022 Neo4j, Inc. All rights reserved.
Graph Algorithms in Supply Chain
Graph algorithms enable reasoning
about network structure
K-Shortest Paths to identify the best
alternative routes
Similarity to find providers that can
step in during a disruption
Betweenness Centrality to find
critical bottlenecks or risk points
Degree Centrality to see distribution
centers with high use
© 2022 Neo4j, Inc. All rights reserved.
28
OrbitMI
Maritime Routing
• Digital twin PLM system with full BoM
for all Army equipment, including costs,
armaments, force posture and readiness.
• Complex analysis is 7.5 X faster
• Rapid “What-If” analysis enables more
agile response to global scenarios
U.S. Army
Force Readiness
• Knowledge graph of 27 Million warranty
& service documents
• Graph AI learns failure mode “prime
examples” to anticipate maintenance
• Improves equipment lifespan and
customer satisfaction
Caterpillar
AI for Maintenance
Customer Examples of Supply Chain Twins
• Digital twin of global maritime routes
• Subsecond route planning
• Global carbon emissions reduced by
60,000 tons annually
• $12-16M ROI for OrbitMI customers
© 2022 Neo4j, Inc. All rights reserved.
29
Knowledge Graphs
• Ontologies
• Taxonomies
• Friendly Naming
• Schema/Structure
• Master Data
• Slowly Changing Dims
• Hierarchies
• Mappings
• Business Processes
• Signal Events
• Granular Detail
• Real Time Context
• Communities
• Dependencies
• Isomorphic Subgraphs
• ML Predictions
A knowledge graph combines consistent business semantics, entities extracted
and unified from source data, detailed transactional flows, and in-graph
analytics/inference for decision support.
Semantic
Conventions
Resolved
Entities
Operational
Transactions
Graph
Inference
© 2022 Neo4j, Inc. All rights reserved.
30
The Modern Supply Chain is a Knowledge Graph
https://www2.deloitte.com/content/dam/insights/us/articles/3465_Digital-supply-network/DUP_Digital-supply-network.pdf
© 2022 Neo4j, Inc. All rights reserved.
31
Advantages of Graphs
FAST ELEGANT EFFICIENT UNIFYING INSIGHTFUL
Relationships
(and nodes)
are stored in
memory for
real-time
access
Complex
business
processes are
simply and
faithfully
represented
Queries
traverse
locally-linked
objects with
consistent
performance
Creates a
flexible,
connected
view across
disparate data
domains
Builds up
context,
enabling
reasoning,
inference and
predictions
© 2022 Neo4j, Inc. All rights reserved.
● Purpose-built supply chain twin solution
● Planet-scale Infrastructure as a Service. Fully
managed Multi Cloud Data Warehouse
● Industry-leading and flexible ML/AI toolchain
● Global market leader in graph technology
● Aligned with Google Cloud Supply Chain Twin
solution
● Compliments Google Cloud AI/ML and analytics
technologies
Neo4j & Google Cloud:
A powerful combination for supply chain
transformation
© 2022 Neo4j, Inc. All rights reserved.
33
Thank you!
Contact us at
sales@neo4j.com

Optimizing Your Supply Chain with the Neo4j Graph

  • 1.
    © 2022 Neo4j,Inc. All rights reserved. © 2022 Neo4j, Inc. All rights reserved. Optimizing Your Supply Chain with the Neo4j Graph Platform
  • 2.
    © 2022 Neo4j,Inc. All rights reserved. © 2022 Neo4j, Inc. All rights reserved. Michael Moore, Ph.D. Principal, Partner Solutions & Technology
  • 3.
    © 2022 Neo4j,Inc. All rights reserved. Consider: What Drives Your Business? It’s not the numbers, it’s the relationships behind them Plants Warehouses Suppliers Distributors Competitors Partners Regulations Employees Citizens Customers Products Parts Services Regions
  • 4.
    © 2022 Neo4j,Inc. All rights reserved. This is a Graph
  • 5.
    © 2022 Neo4j,Inc. All rights reserved. “By 2025, graph technologies will be used in 80% of data and analytics innovations...” Top 10 Trends in Data and Analytics, 11 May 2020, Rita Sallam et al.
  • 6.
    © 2022 Neo4j,Inc. All rights reserved. 6 Graphs Have Low Complexity and High Fidelity SQL RDBMS ER Diagram Graph (“Whiteboard”)
  • 7.
    © 2022 Neo4j,Inc. All rights reserved. Depict the business as a graph Squash the graph into tables Jam in foreign keys to relate the records, populate global index 7 Cheap Memory Makes Graphs Compelling https://jcmit.net/memoryprice.htm SQL RDBMS workarounds to conserve memory 1979: Oracle v2.0 Released (yes, 43 years ago!) = hidden technical debt per MB per MB
  • 8.
    © 2022 Neo4j,Inc. All rights reserved. 8 Neo4j Graph Model Enables Performance at Scale
  • 9.
    © 2022 Neo4j,Inc. All rights reserved. Graphs Naturally Handle Complex Data A B C D E A B C D E One-to-Many Relationships Across Many Entities Wide Data Complex Data Hierarchical & Recursive Data Many-to-Many Relationships Nested Tree Structures Recursion (Self-Joins) Deep Hierarchies Link Inference (If C relates to A and A relates to E, then C must relate to E) Node Similarity Hidden Data Legacy Data Frozen Data Legacy SQL Systems Data Lake Fact Tables Graph Data Science - Machine Reasoning A C E
  • 10.
    © 2022 Neo4j,Inc. All rights reserved. 10 Neo4j, Inc. All rights reserved 2022 Neo4j 5 Graph Data Platform Neo4j Database User Tools • Developer Tools (Desktop, Browser, Data Importer) • Graph Visualization (Bloom) • Administration (Neo4j Ops Manager) Language Drivers & Connectors • Language Drivers (Java, JavaScript, .NET, Python, Go) • Spring Data & GraphQL Frameworks • Kafka (Streaming), Spark, BI Connectors Neo4j Aura • Cloud Database-as-a-Service Graph Data Science • Enhanced Analytics and Graph-Native ML Language Standards • GQL, openCypher
  • 11.
    © 2022 Neo4j,Inc. All rights reserved. Rich Tooling For Rapid Development Local database for rapid dev Visualize and explore your data API-driven intelligent applications Query editor and results visualizer data Importer Code-free data loader ops manager Centralized management 11
  • 12.
    © 2022 Neo4j,Inc. All rights reserved. Demand Shaping Inventory Positioning Perfect Fulfillment Sustainability Consider a omni-channel, multi-echelon supply chain and demand & supply risk to determine optimized inventory levels Combine distributed order management with warehouse and transportation optimization and enable automation of processes Reduce energy consumption across operations, measure risks, measure gas emissions, adopt a circular economy and measure the social impact of your supply chain Understand customers and market trends to dynamically adjust segmentation, promotions and generate highly accurate forecasts Demand Shaping Inventory Positioning Perfect Fulfillment Sustainability Supply Chain Complexity Issues End-to-End Supply Chain Visibility
  • 13.
    © 2022 Neo4j,Inc. All rights reserved. Supply Chain Graphs • Global Supply Chain Visibility • Routing, Logistics, Distribution • BOM Management • Supply Chain Resiliency • Scope 3 Carbon Reporting
  • 14.
    © 2022 Neo4j,Inc. All rights reserved. Supply Chain Digital Twins Digital Supply Chain Twins—Conceptual Clarification, Use Cases and Benefits Benno Gerlach, Simon Zarnitz, Benjamin Nitsche and Frank Straube Logistics 2021, 5, 86. https://doi.org/10.3390/logistics5040086 Network Level Site Level Organizations' supply chains often account for more than 90% of their greenhouse gas (GHG) emissions, when taking into account their overall climate impacts.
  • 15.
    © 2022 Neo4j,Inc. All rights reserved. © 2022 Neo4j, Inc. All rights reserved. 15 GHG Reporting Requirements GHG Reporting Timelines • March 21, 2022: SEC released new proposals for climate-related risk disclosures. • February 2024: First disclosures on Scope 1 and 2 for large organizations. • February 2025: Disclosures on Scope 3 emissions and emissions intensity required for large organizations.
  • 16.
    © 2022 Neo4j,Inc. All rights reserved. Formidable Data Collection Requirements Upstream Value Chain Data x Emission Factors + Downstream Value Chain Data x Emission Factors + Existing Scope 1 and Scope Estimates = Total Carbon Estimate
  • 17.
    © 2022 Neo4j,Inc. All rights reserved. © 2022 Neo4j, Inc. All rights reserved. Value Chain Complexity Calculation Complexity
  • 18.
    © 2022 Neo4j,Inc. All rights reserved. Supply Chain Optimization Using Neo4j Neo4j Graph Data Science Library Neo4j Database Neo4j Bloom Inference & Predictions Graph Digital Twin Visualization & Investigation
  • 19.
    © 2022 Neo4j,Inc. All rights reserved. Robust Graph Algorithms & ML methods ● Compute metrics about the topology and connectivity ● Build predictive models to enhance your graph ● Highly parallelized and scale to 10’s of billions of nodes 19 Neo4j Graph Data Science Mutable In-Memory Workspace Computational Graph Native Graph Store Efficient & Flexible Analytics Workspace ● Automatically reshapes transactional graphs into an in-memory analytics graph ● Optimized for global traversals and aggregation ● Create workflows and layer algorithms ● Store and manage predictive models in the model catalog
  • 20.
    © 2022 Neo4j,Inc. All rights reserved. 20 65+ Graph Data Science Techniques in Neo4j Pathfinding & Search • Shortest Path • Single-Source Shortest Path • All Pairs Shortest Path • A* Shortest Path • Yen’s K Shortest Path • Minimum Weight Spanning Tree • K-Spanning Tree (MST) • Random Walk • Breadth & Depth First Search Centrality & Importance • Degree Centrality • Closeness Centrality • Harmonic Centrality • Betweenness Centrality & Approx. • PageRank • Personalized PageRank • ArticleRank • Eigenvector Centrality • Hyperlink Induced Topic Search (HITS) • Influence Maximization (Greedy, CELF) Community Detection • Triangle Count • Local Clustering Coefficient • Connected Components (Union Find) • Strongly Connected Components • Label Propagation • Louvain Modularity • K-1 Coloring • Modularity Optimization • Speaker Listener Label Propagation Supervised Machine Learning • Node Classification • Link Prediction … and more! Heuristic Link Prediction • Adamic Adar • Common Neighbors • Preferential Attachment • Resource Allocations • Same Community • Total Neighbors Similarity • Node Similarity • K-Nearest Neighbors (KNN) • Jaccard Similarity • Cosine Similarity • Pearson Similarity • Euclidean Distance • Approximate Nearest Neighbors (ANN) Graph Embeddings • Node2Vec • FastRP • FastRPExtended • GraphSAGE • Synthetic Graph Generation • Scale Properties • Collapse Paths • One Hot Encoding • Split Relationships • Graph Export • Pregel API (write your own algos)
  • 21.
    © 2022 Neo4j,Inc. All rights reserved. © 2022 Neo4j, Inc. All rights reserved. DEMO
  • 22.
    © 2022 Neo4j,Inc. All rights reserved. 22 North American Rail Network (NARN) Digital Twin North American Rail Network Total 527K Miles of Track USDOT NARN GEOJSON datasets - nodes and lines 253K nodes, 715K relationships, 1GB https://github.com/graphadvantage/neo4j-na-rail-network Norfolk Southern rail network graph plotted using NeoMap
  • 23.
    © 2022 Neo4j,Inc. All rights reserved. Neo4j Graph Database Yards connected by track type Graph Data Science - Projecting Network Views main-lines-network Has low bridges & tunnels double-stack-network No low bridges & tunnels Neo4j Graph Data Science Projected virtual graph views standard rail car double-stack intermodal rail car
  • 24.
    © 2022 Neo4j,Inc. All rights reserved. 24 Neo4j Pathfinding //Project main lines CALL gds.graph.project( 'main-lines-network', 'Node', {relType: {type: 'CONNECTS_MIO', orientation: 'UNDIRECTED', properties: {miles: {property: 'miles', defaultValue: 1}}}}, {}) //Project double stack lines CALL gds.graph.project( 'double-stack-network', 'Node', {relType: {type: 'CONNECTS_DS', orientation: 'UNDIRECTED', properties: {miles: {property: 'miles', defaultValue: 1}}}}, {}) //Find a route CALL gds.shortestPath.dijkstra.stream( 'main-lines-network', {relationshipWeightProperty: 'MILES', sourceNode: id(start), targetNode: id(end)}) What is the lowest cost path between two points? “Cost” could be physical distance, fuel consumption, trackage fees, carbon emissions, etc Dijkstra shortest path solution visualized in NeoDash Minimize this cost
  • 25.
    © 2022 Neo4j,Inc. All rights reserved. Graph Algorithms in Supply Chains Graph algorithms enable reasoning about network structure K-Shortest Paths to identify the best alternative routes
  • 26.
    © 2022 Neo4j,Inc. All rights reserved. 26 Graph Algorithms in Supply Chain Graph algorithms enable reasoning about network structure K-Shortest Paths to identify the best alternative routes Betweenness Centrality to find critical bottlenecks or risk points Degree Centrality to see distribution centers with high use
  • 27.
    © 2022 Neo4j,Inc. All rights reserved. Graph Algorithms in Supply Chain Graph algorithms enable reasoning about network structure K-Shortest Paths to identify the best alternative routes Similarity to find providers that can step in during a disruption Betweenness Centrality to find critical bottlenecks or risk points Degree Centrality to see distribution centers with high use
  • 28.
    © 2022 Neo4j,Inc. All rights reserved. 28 OrbitMI Maritime Routing • Digital twin PLM system with full BoM for all Army equipment, including costs, armaments, force posture and readiness. • Complex analysis is 7.5 X faster • Rapid “What-If” analysis enables more agile response to global scenarios U.S. Army Force Readiness • Knowledge graph of 27 Million warranty & service documents • Graph AI learns failure mode “prime examples” to anticipate maintenance • Improves equipment lifespan and customer satisfaction Caterpillar AI for Maintenance Customer Examples of Supply Chain Twins • Digital twin of global maritime routes • Subsecond route planning • Global carbon emissions reduced by 60,000 tons annually • $12-16M ROI for OrbitMI customers
  • 29.
    © 2022 Neo4j,Inc. All rights reserved. 29 Knowledge Graphs • Ontologies • Taxonomies • Friendly Naming • Schema/Structure • Master Data • Slowly Changing Dims • Hierarchies • Mappings • Business Processes • Signal Events • Granular Detail • Real Time Context • Communities • Dependencies • Isomorphic Subgraphs • ML Predictions A knowledge graph combines consistent business semantics, entities extracted and unified from source data, detailed transactional flows, and in-graph analytics/inference for decision support. Semantic Conventions Resolved Entities Operational Transactions Graph Inference
  • 30.
    © 2022 Neo4j,Inc. All rights reserved. 30 The Modern Supply Chain is a Knowledge Graph https://www2.deloitte.com/content/dam/insights/us/articles/3465_Digital-supply-network/DUP_Digital-supply-network.pdf
  • 31.
    © 2022 Neo4j,Inc. All rights reserved. 31 Advantages of Graphs FAST ELEGANT EFFICIENT UNIFYING INSIGHTFUL Relationships (and nodes) are stored in memory for real-time access Complex business processes are simply and faithfully represented Queries traverse locally-linked objects with consistent performance Creates a flexible, connected view across disparate data domains Builds up context, enabling reasoning, inference and predictions
  • 32.
    © 2022 Neo4j,Inc. All rights reserved. ● Purpose-built supply chain twin solution ● Planet-scale Infrastructure as a Service. Fully managed Multi Cloud Data Warehouse ● Industry-leading and flexible ML/AI toolchain ● Global market leader in graph technology ● Aligned with Google Cloud Supply Chain Twin solution ● Compliments Google Cloud AI/ML and analytics technologies Neo4j & Google Cloud: A powerful combination for supply chain transformation
  • 33.
    © 2022 Neo4j,Inc. All rights reserved. © 2022 Neo4j, Inc. All rights reserved. 33 Thank you! Contact us at sales@neo4j.com