Download as PDF, PPTX
![© Copyright 2020 TopQuadrant Inc. Slide 31
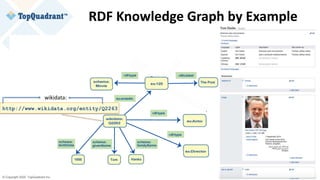
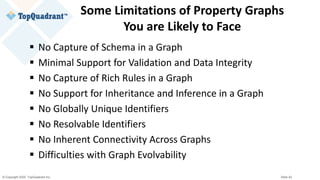
wikidata:Q2263
rdf:type entont:Actor ;
rdf:type entont:Director ;
entont:actedIn entertainment_data:ThePost
[[ entont:role “Ben Bradlee” ]] ;
schema:birthDate "1956-07-09"^^xsd:date ;
entont:directed entertainment_data:ALeagueOfTheirOwn ;
schema:familyName "Tom" @en;
schema:givenName "Hanks" @en;
rdfs:label "Tom Hanks" @en; .
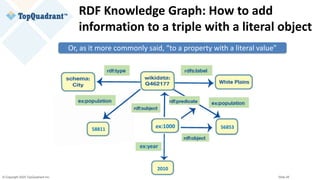
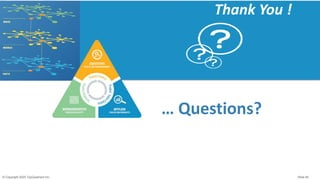
Example of RDF Serialization
@prefix entertainment_data: <http://example.org/data-graphs/Entertainment_Data#> .
@prefix entont: <http://example.org/ontologies/Entertainment#> .
@prefix wikidata: <http://www.wikidata.org/entity/> .
@prefix schema: <http://schema.org/> .
@prefix rdf: <http://www.w3.org/1999/02/22-rdf-syntax-ns#> .
@prefix rdfs: <http://www.w3.org/2000/01/rdf-schema#> .
@prefix xsd: <http://www.w3.org/2001/XMLSchema#> .
Subject Node
Object NodeEdge](https://image.slidesharecdn.com/knowledge-graphs-vs-property-graphs-similarities-differences-and-guidance-on-capabilities-200917152431/85/Slides-Knowledge-Graphs-vs-Property-Graphs-31-320.jpg)
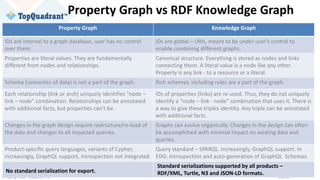
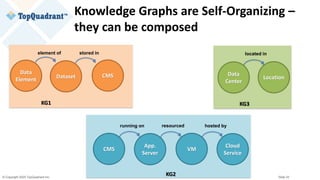
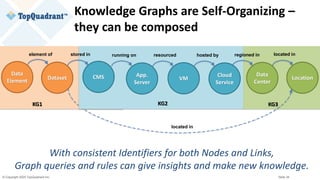
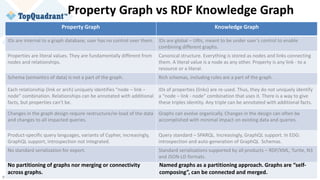
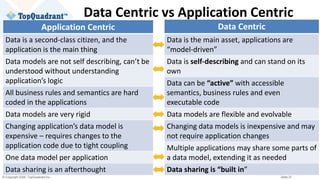
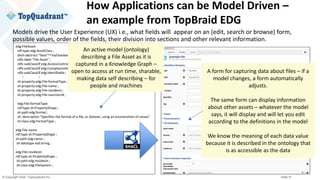
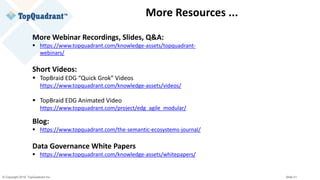

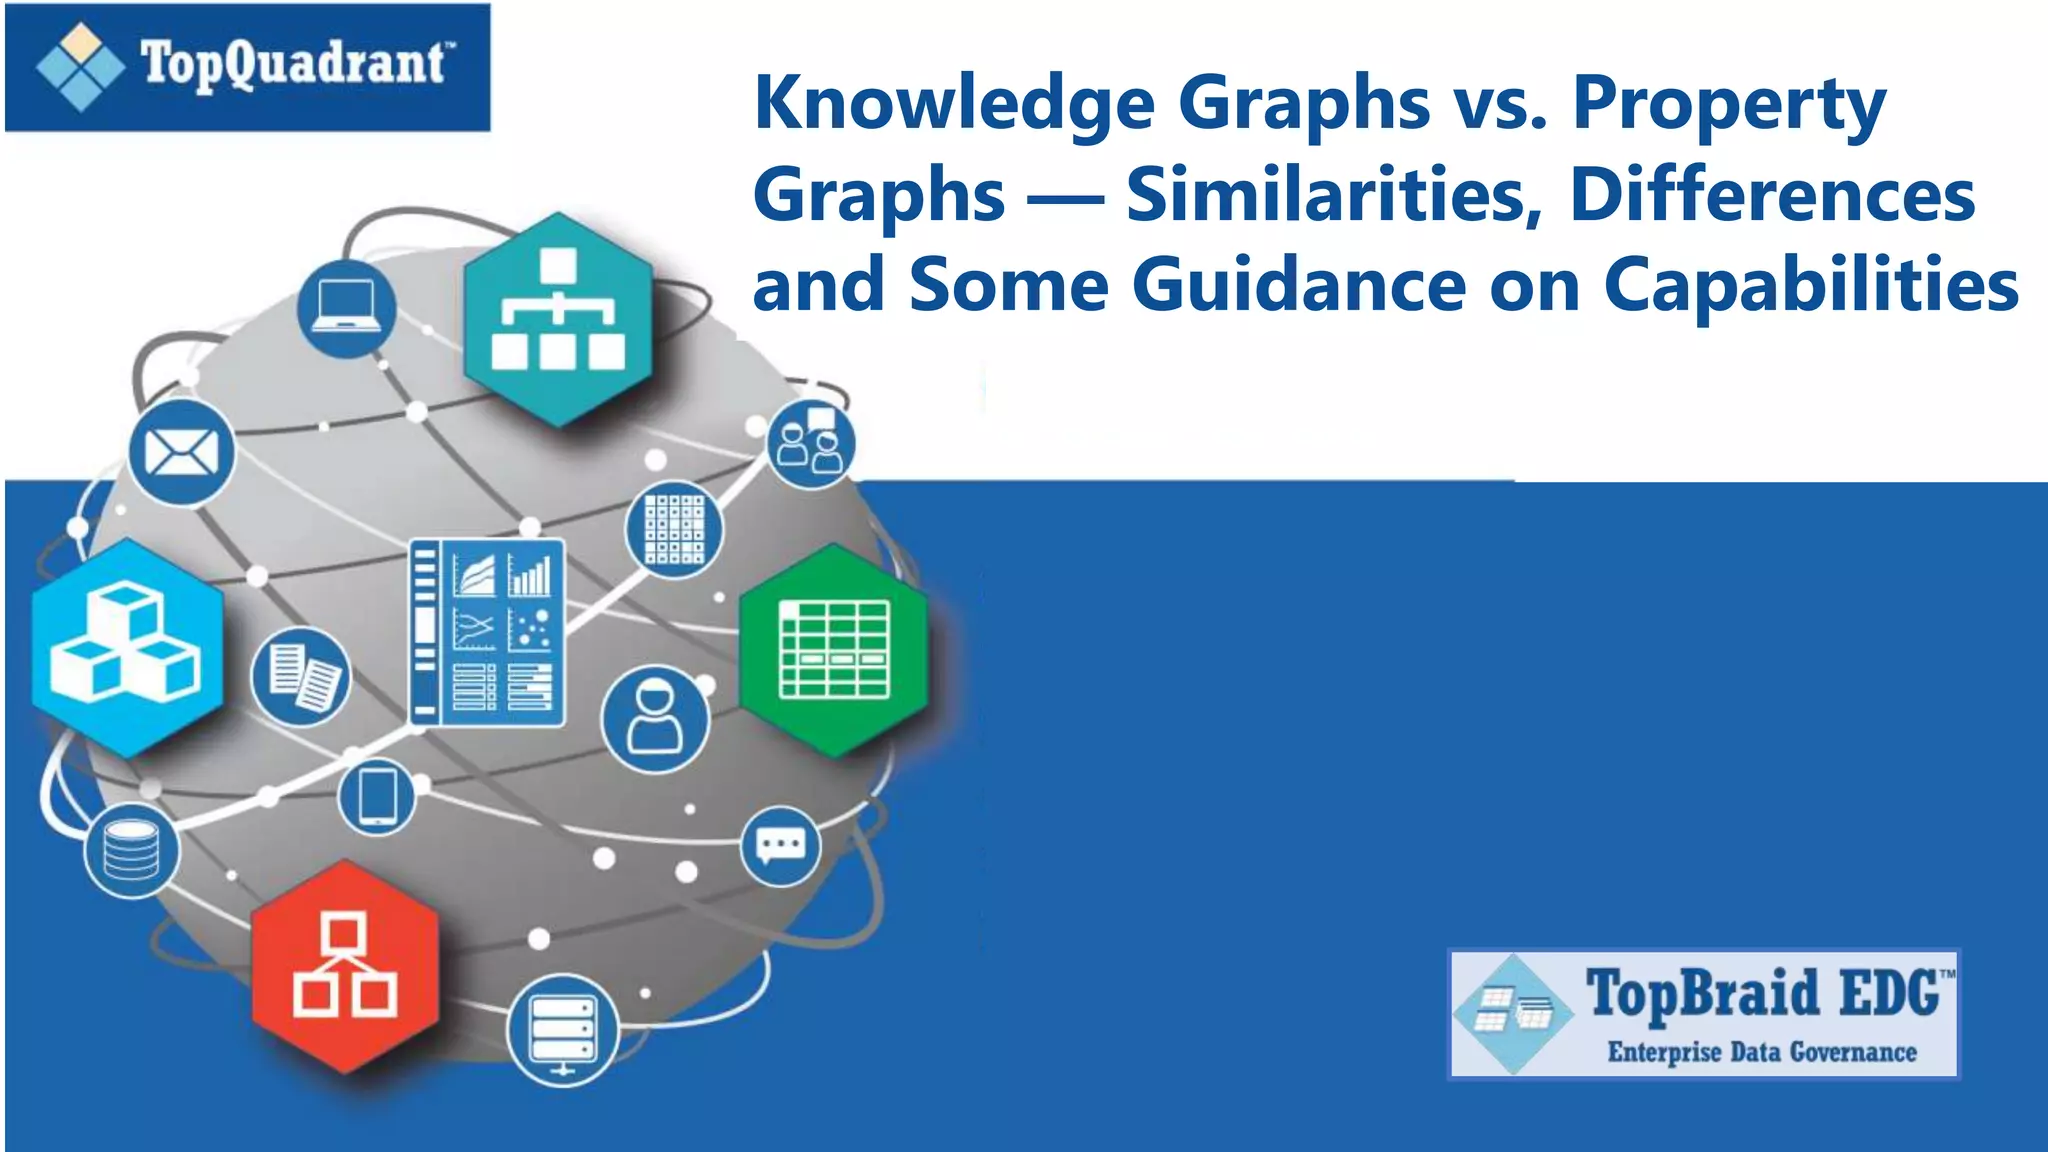
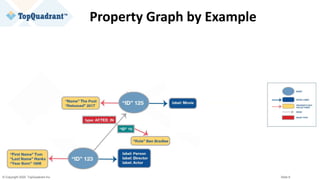
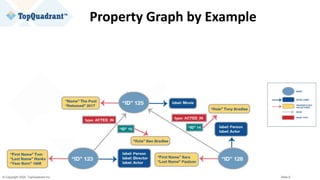
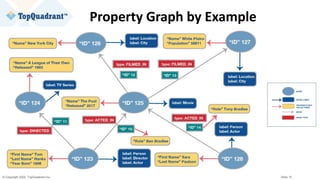
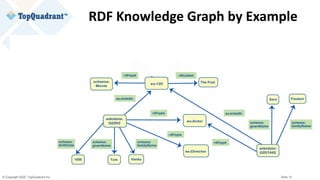
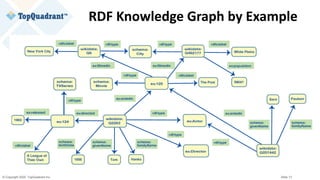
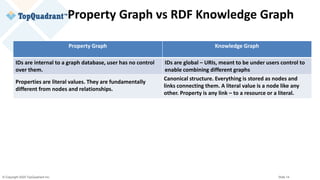
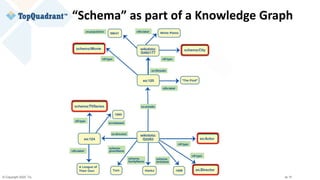
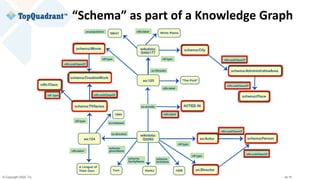
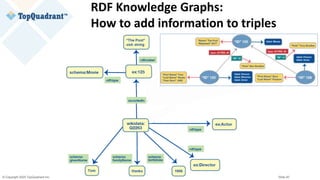
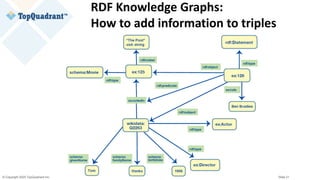
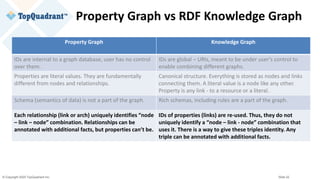
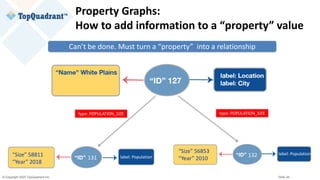
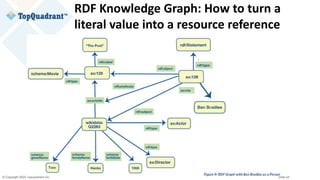
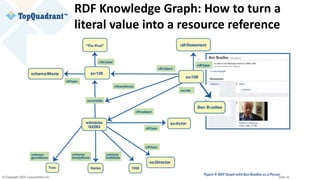
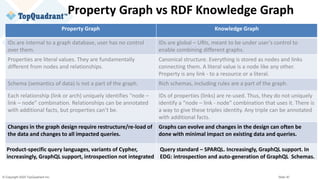
The document compares knowledge graphs and property graphs, detailing their definitions, differences in capabilities, strengths, and limitations. Knowledge graphs focus on real-world entities and their interrelations using a schema, while property graphs consist of nodes, edges, and properties without a standard model. The document emphasizes the advantages of knowledge graphs for data-centric enterprise applications like data governance and metadata management.


![제 23회 보아즈(BOAZ) 빅데이터 컨퍼런스 - [MBOAX] : ABSA를 활용한 소비자 반응 분석 기반 운영 효율화 대시보드 설계](https://cdn.slidesharecdn.com/ss_thumbnails/3-1boaz23rdconferencemboax-260203102709-9d519923-thumbnail.jpg?width=640&height=640&fit=bounds)


![7.__Developing_a_Research_Proposal[1].pptx](https://cdn.slidesharecdn.com/ss_thumbnails/7-260131073037-df92dd7d-thumbnail.jpg?width=640&height=640&fit=bounds)


