Download as PDF, PPTX
![Basic Concepts
•
Joinable tuples t1 ∈ R1 and t2 ∈ R2:
●
•
there is a foreign key constraint between R1.A and R2.B
and t1[A] = t2[B].
Unifiability of data values t1[A] and t2[B]:
●
●
●
(i) t1=t2 and both A and B do not belong to a multiattribute key;
(ii) t1 and t2 are joinable and A belongs to a multiattribute key;
(iii) t1 and t2 are joinable, A and B do not belong to a
multi-attribute key and there is no other tuple t 3 that is
joinable with t2.
GRADES 2013
Converting Relational to Graph Databases
New York, 23-06-2013](https://image.slidesharecdn.com/grades-131023082129-phpapp01/85/Converting-Relational-to-Graph-Databases-5-320.jpg)
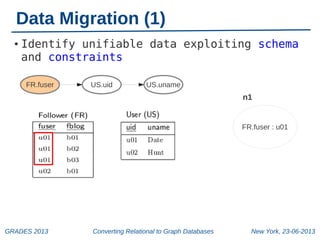
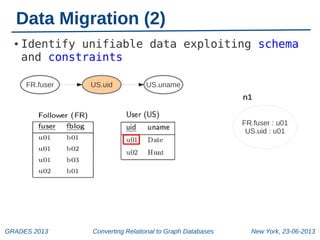
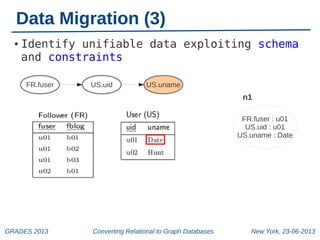

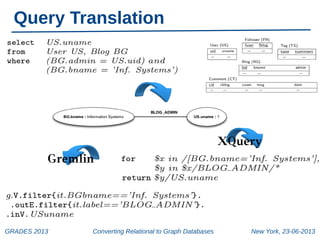
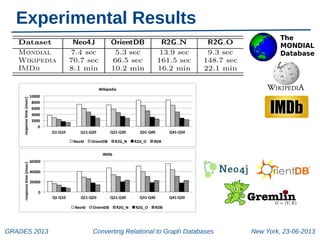

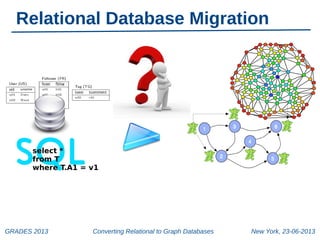
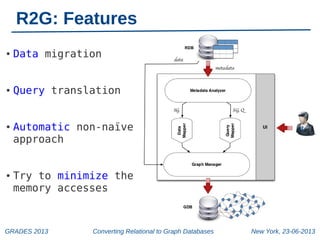
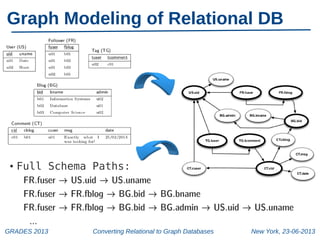
The document discusses a workshop on converting relational databases to graph databases, held in New York on June 23, 2013. It outlines methodologies including data migration, query translation, and the automatic mapping of relational data to graph structures while emphasizing the efficiency of graph database features. Future work aims to enhance query handling and improve the compactness of graph databases.