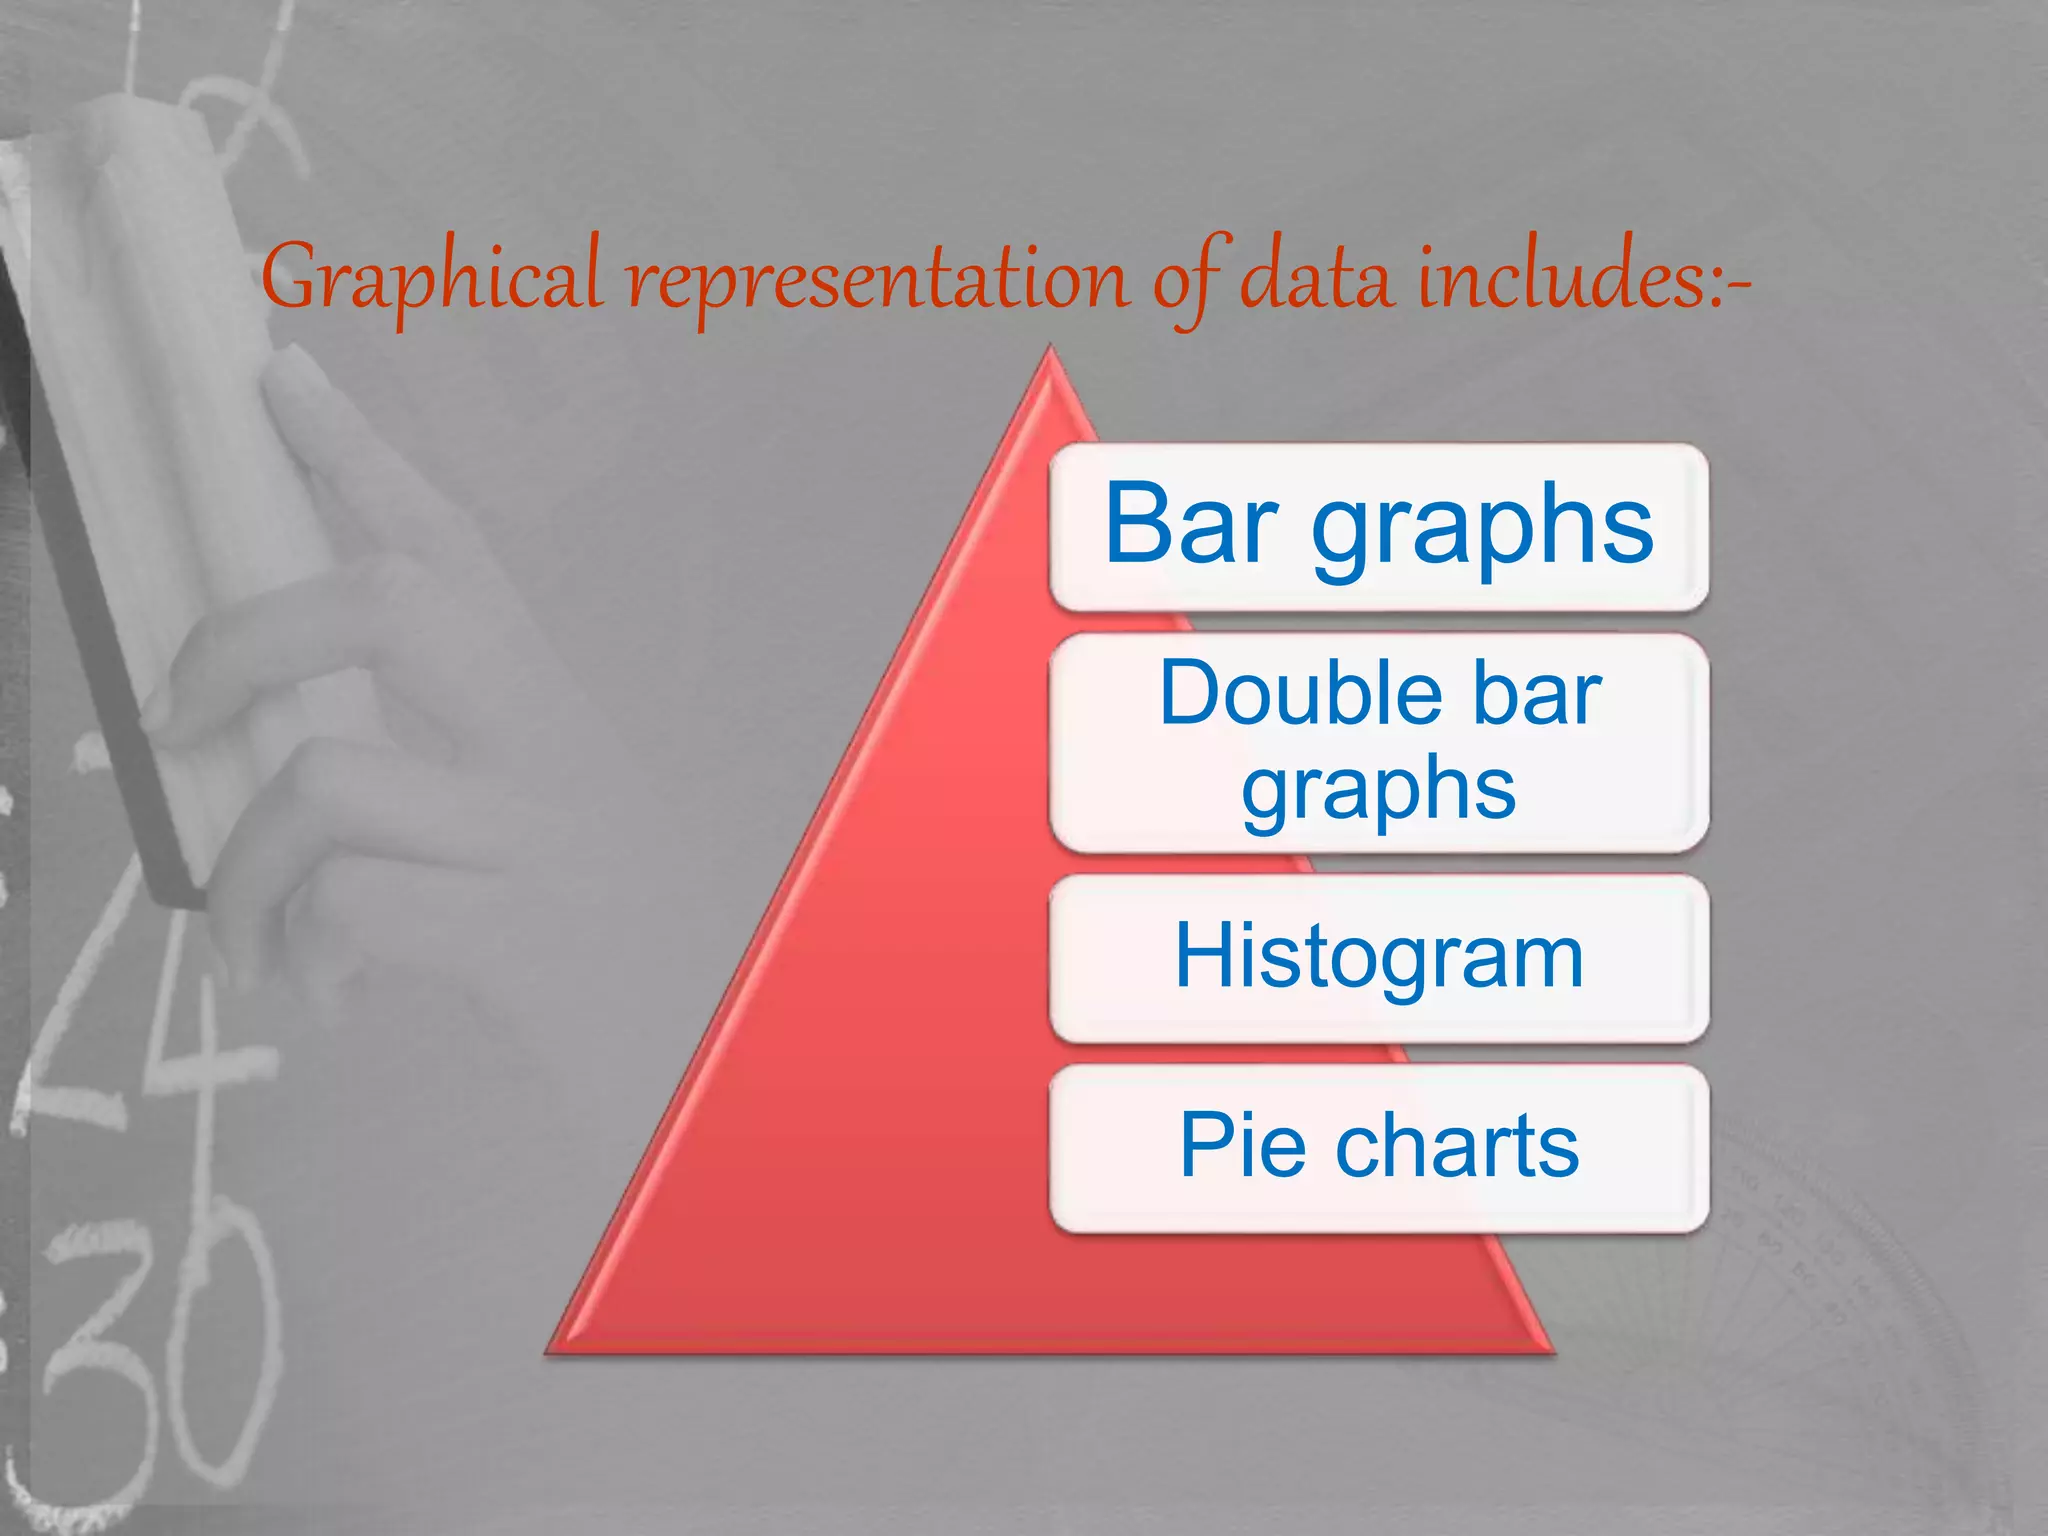
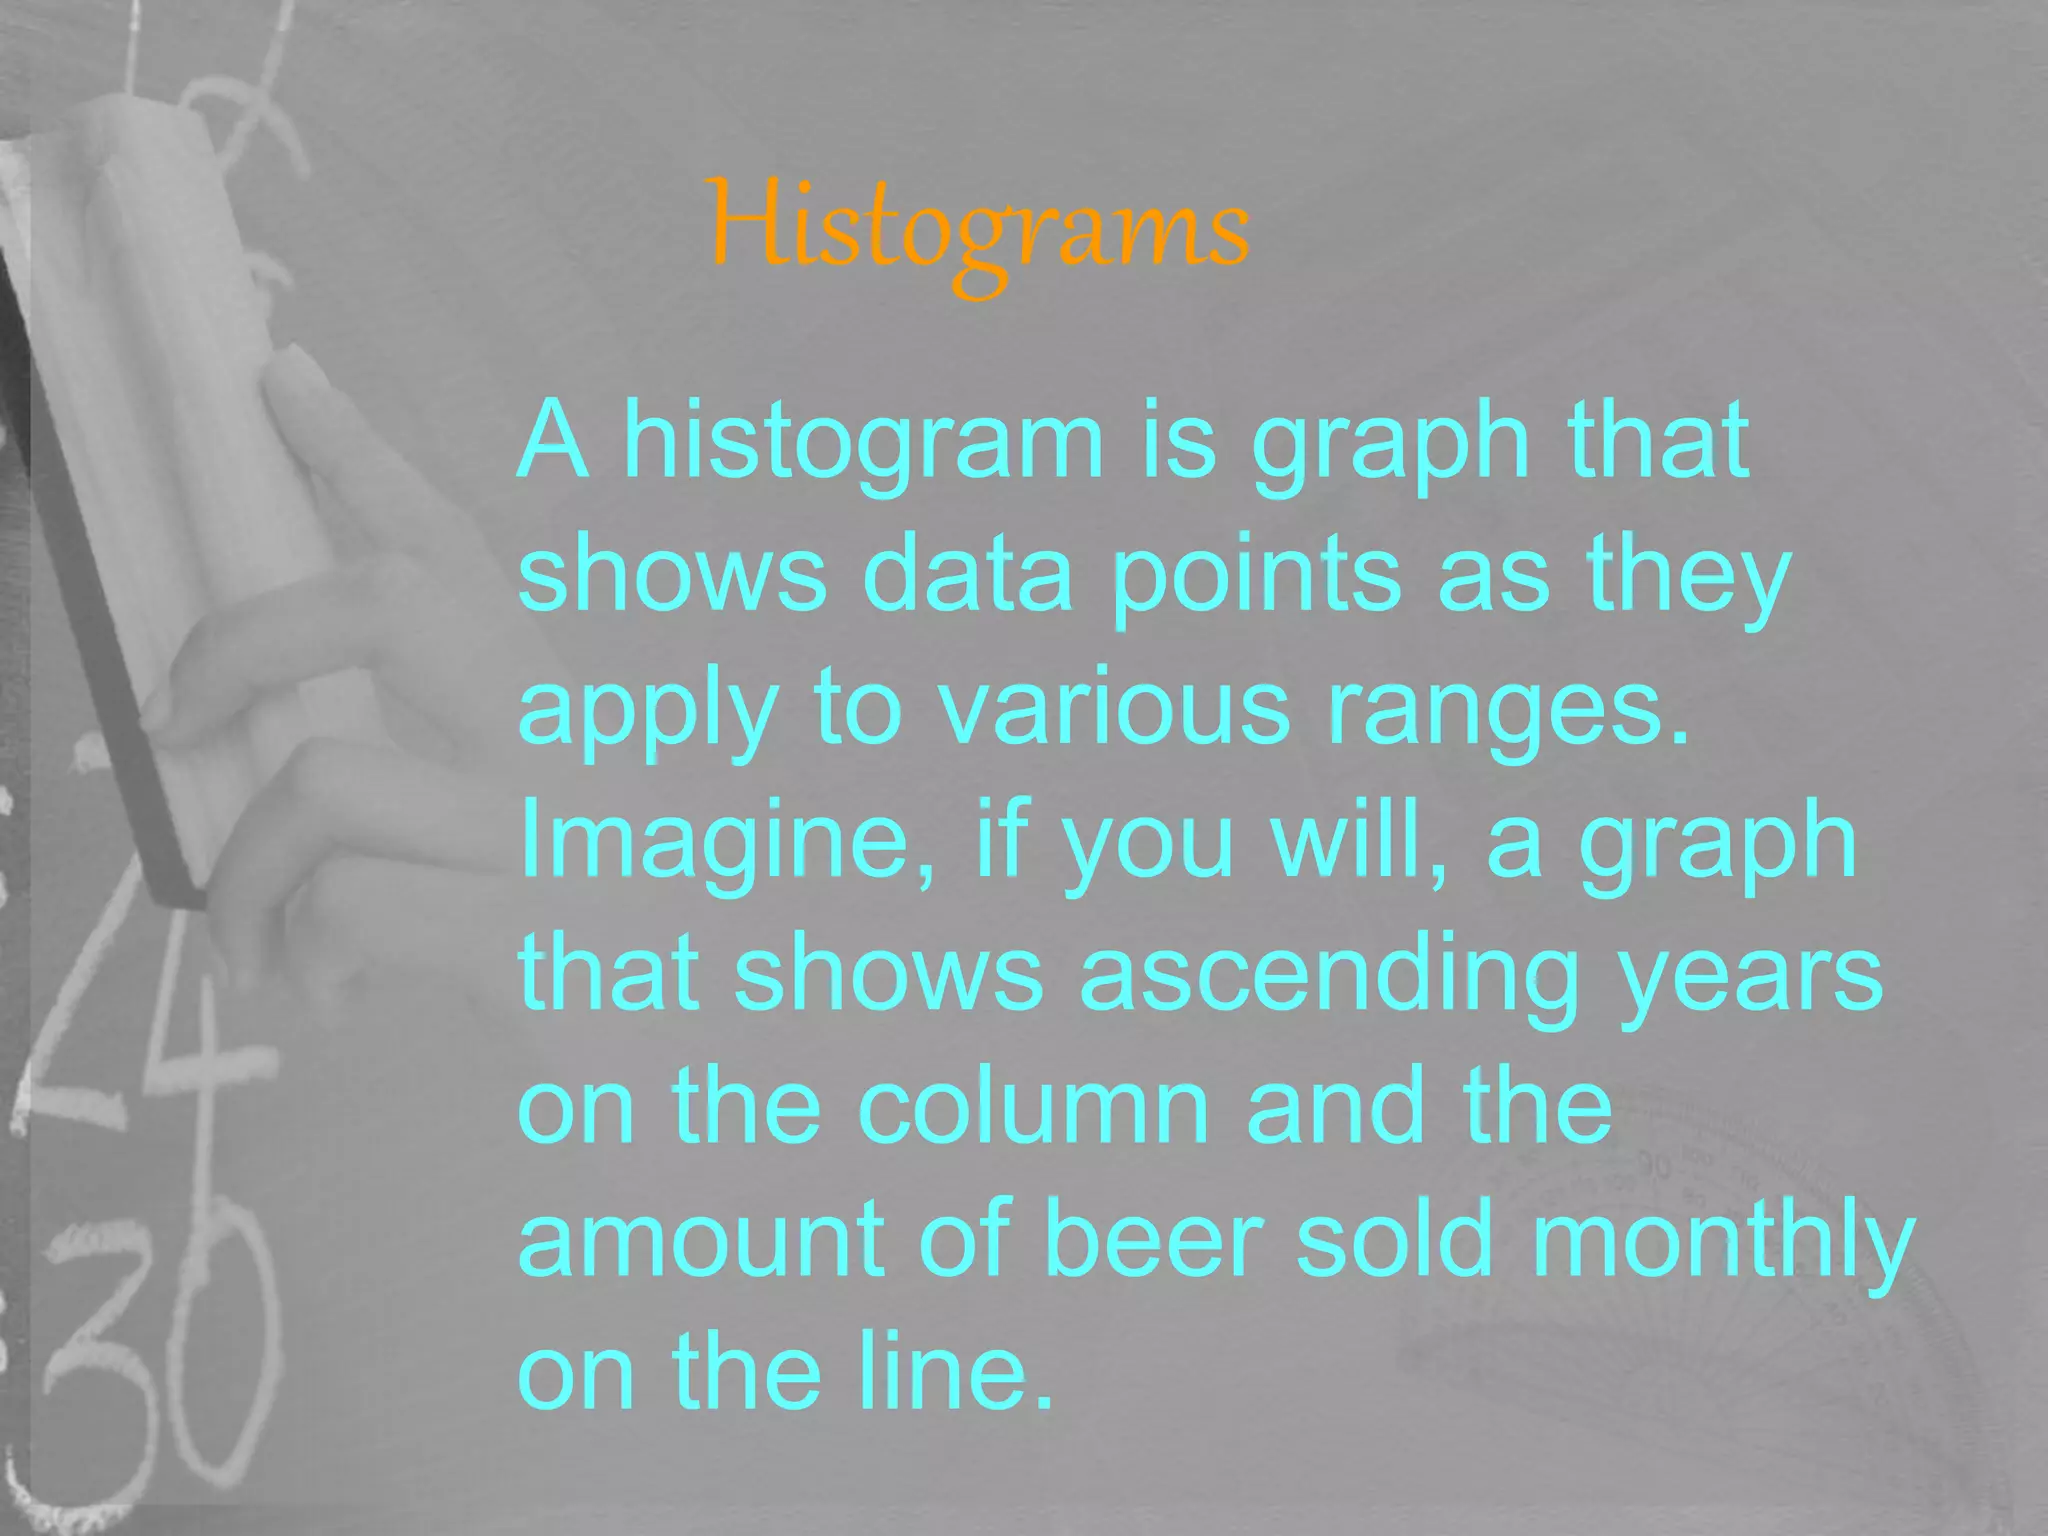
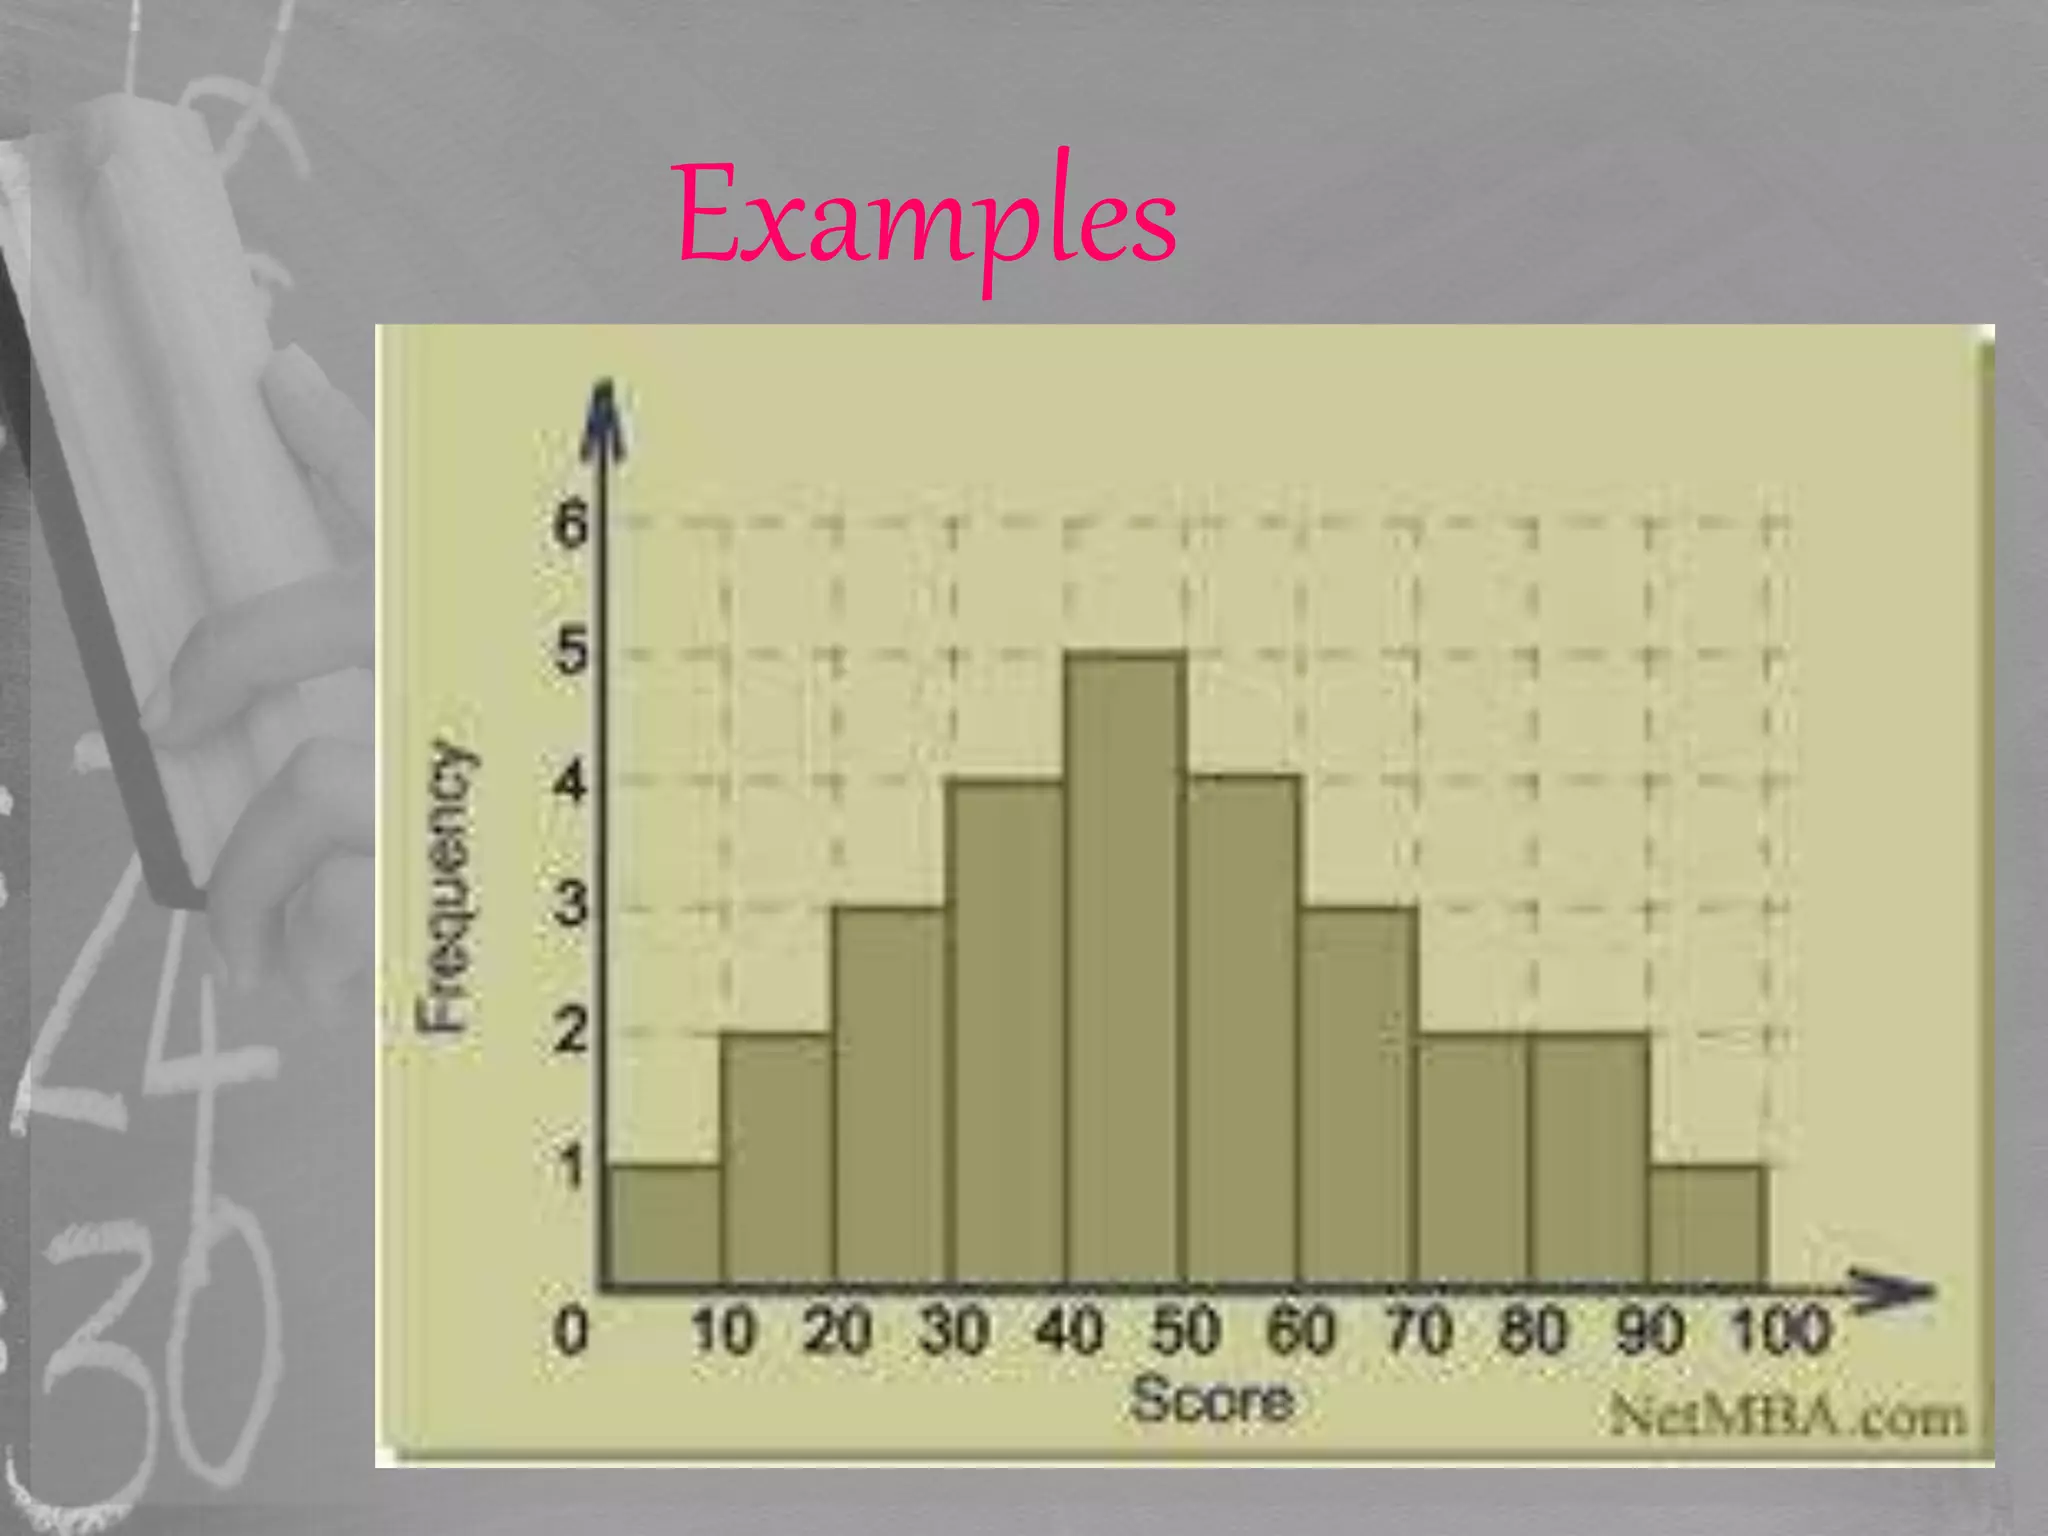
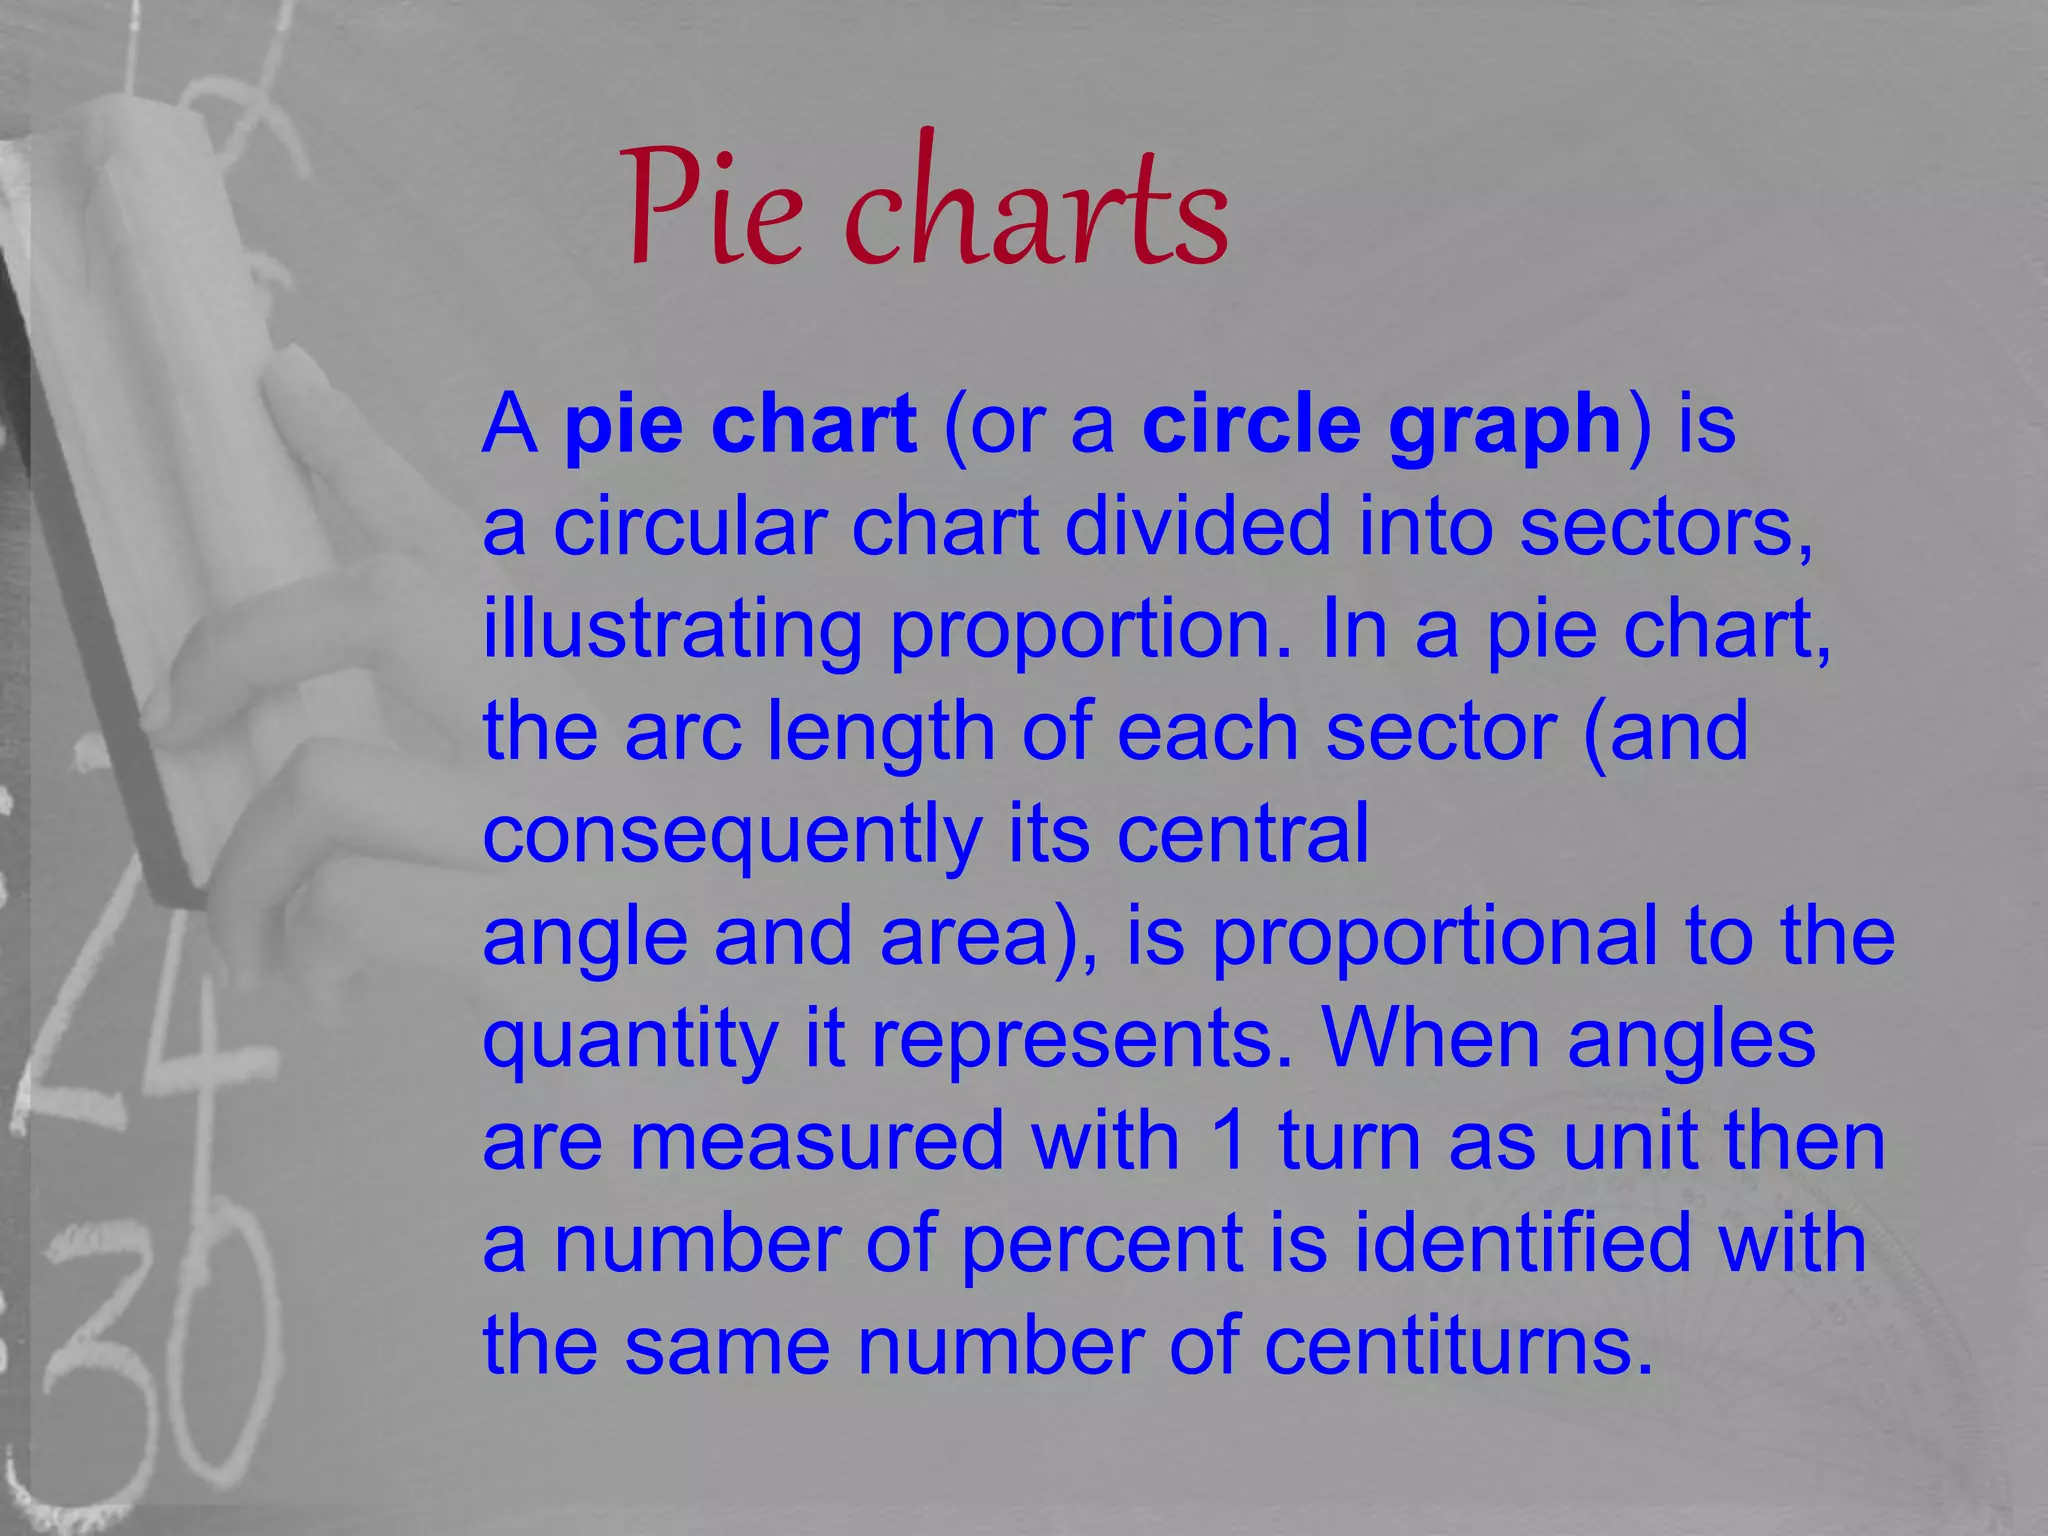
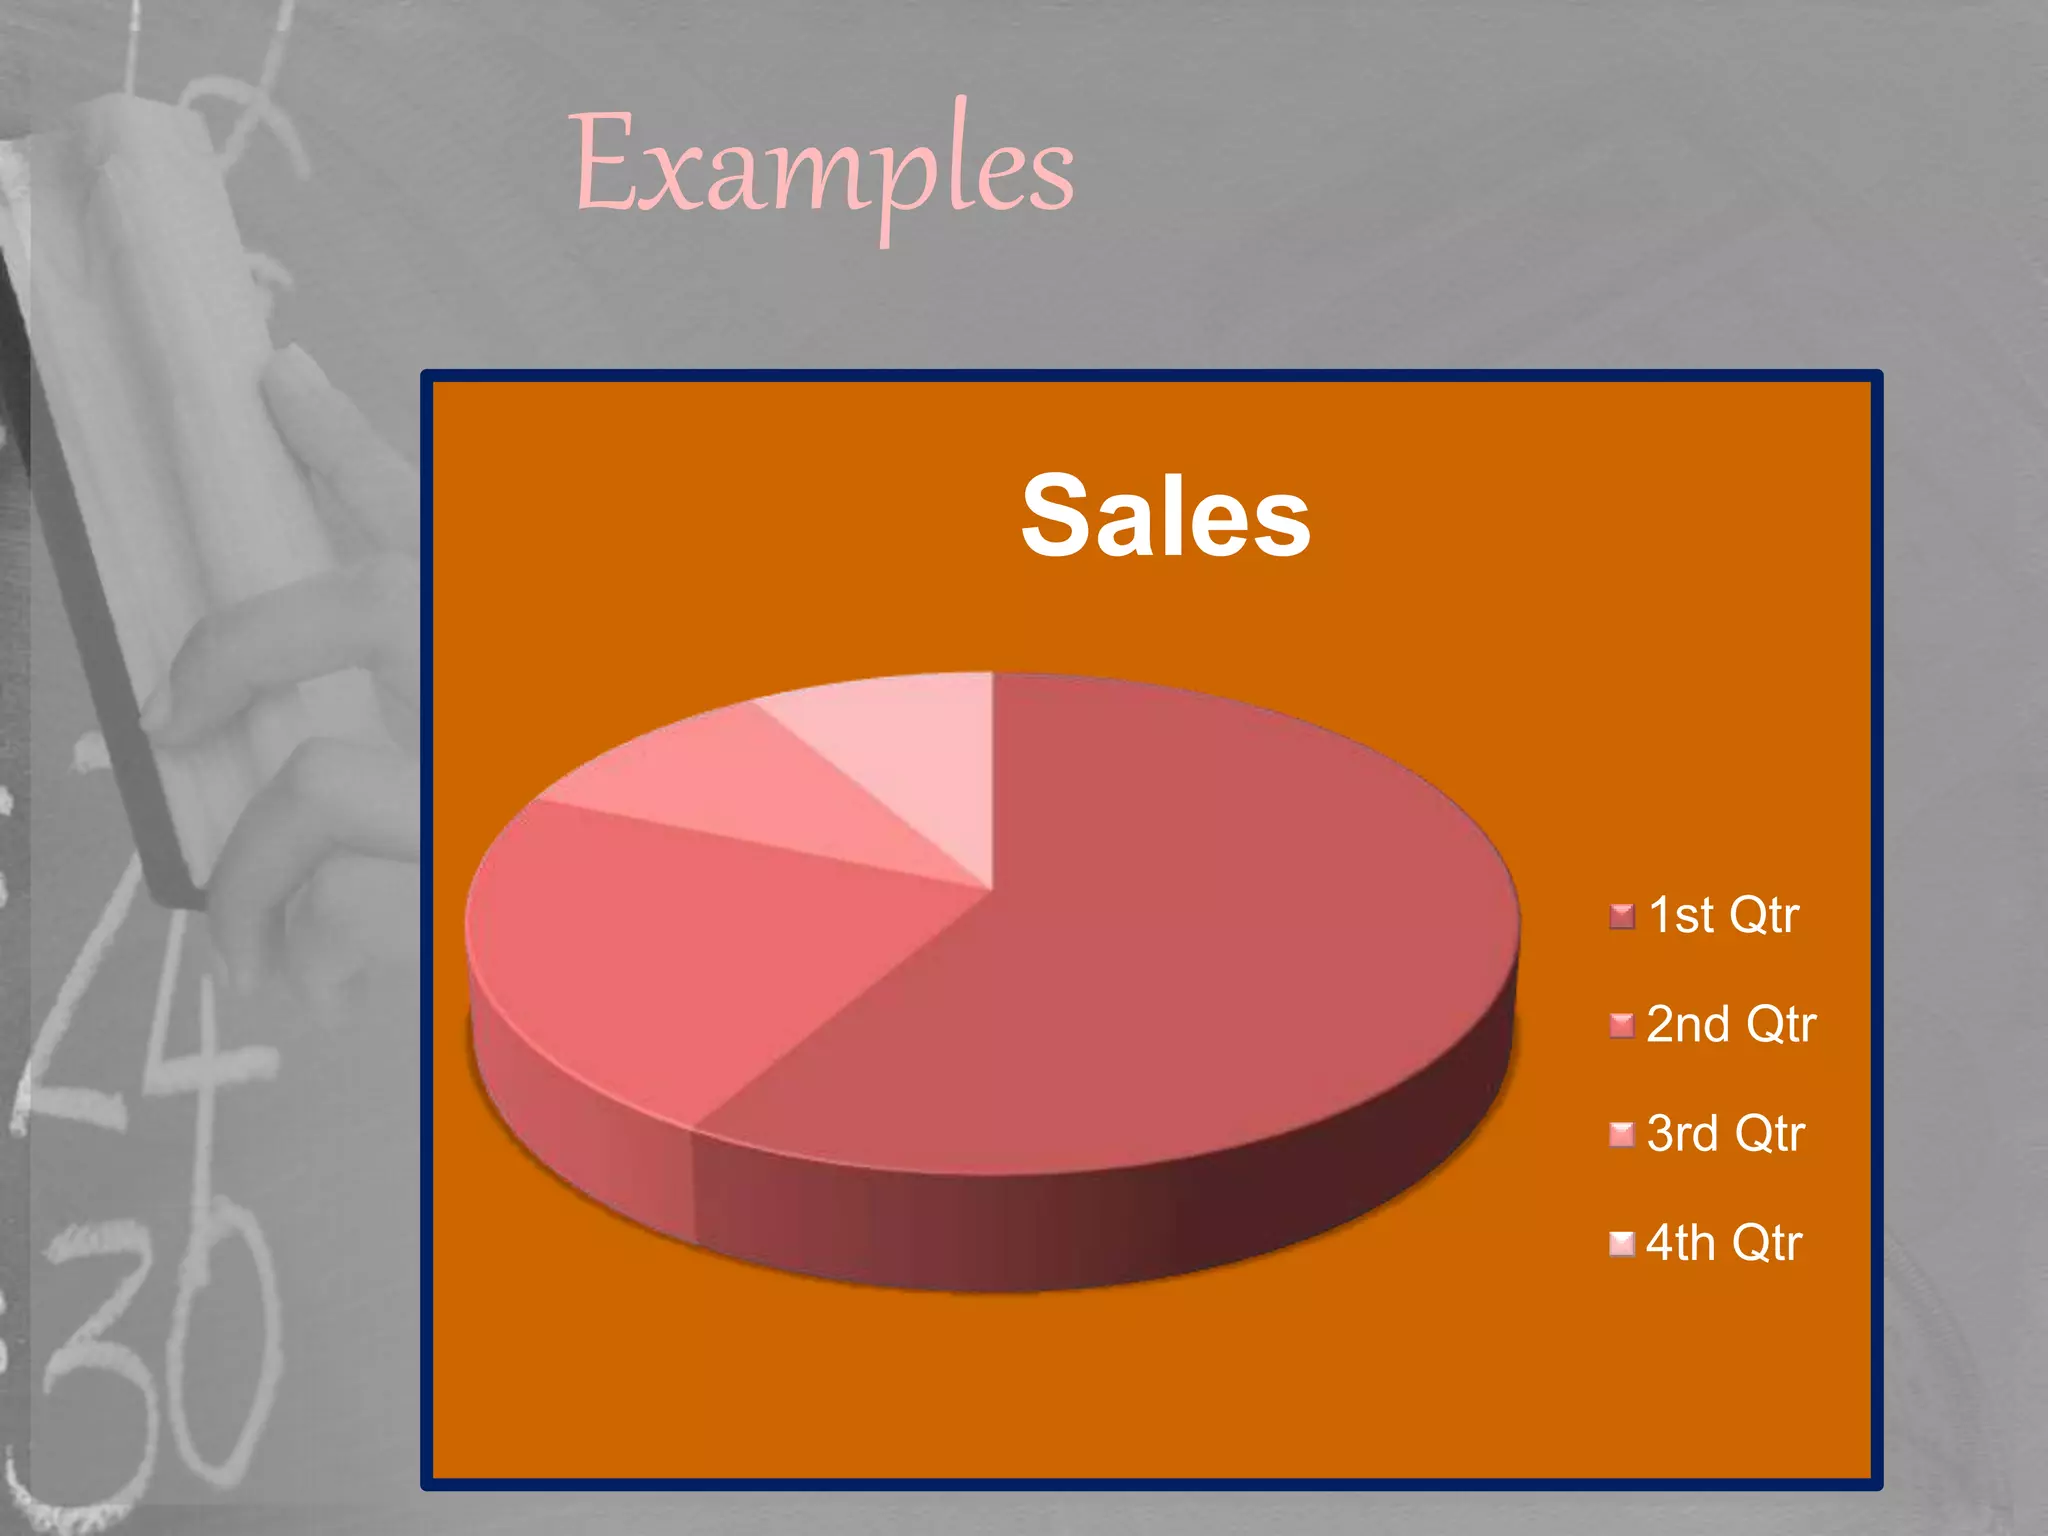
INTRODUCTION
Data Handling is the
way to maintain data
in a database system.
It involved extraction
and transformation of
data from one media
to another.
Frequency distribution
In statistics, a frequency
distribution is an arrangement of the
values that one or more variables take
in a sample. Each entry in the table
contains the frequency or count of the
occurrences of values within a
particular group or interval, and in this
way, the table summarizes the
distribution of values in the sample.
Class intervals frequency
0-5 4
5-10 5
10-15 8
15-20 6
20-25 3
Total 26
Examples
Graphical representation of data includes:-
Bar graphs
Double bar
graphs
Histogram
Pie charts
Bar graph
A bar chart or bar graph is
a chart with rectangular bars
with lengths proportional to the values that
they represent. The bars can be plotted
vertically or horizontally.
Bar charts are used for plotting discrete data
which has discrete values and is not
continuous. Some examples of
discontinuous data include 'shoe size' or
'eye colour‘ , for which you would use a bar
chart.
Examples
0 2 4 6
Category 1
Category 2
Category 3
Category 4
Series 3
Double bar graphs
• A double bar graph is a
bar graph with two bars
that compare two sets of
data. Don't get too
overwhelmed by the name.
They really are simple to
figure out when you look at
them.
Examples
0 1 2 3 4 5
Category 1
Category 2
Category 3
Category 4
Series 3
Series 2
Histograms
A histogram is graph that
shows data points as they
apply to various ranges.
Imagine, if you will, a graph
that shows ascending years
on the column and the
amount of beer sold monthly
on the line.
Examples
Pie charts
A pie chart (or a circle graph) is
a circular chart divided into sectors,
illustrating proportion. In a pie chart,
the arc length of each sector (and
consequently its central
angle and area), is proportional to the
quantity it represents. When angles
are measured with 1 turn as unit then
a number of percent is identified with
the same number of centiturns.
Examples
Sales
1st Qtr
2nd Qtr
3rd Qtr
4th Qtr
MADE BY:
KONDETI
YASHWANT

Data handling

  • 2.
    INTRODUCTION Data Handling isthe way to maintain data in a database system. It involved extraction and transformation of data from one media to another.
  • 3.
    Frequency distribution In statistics,a frequency distribution is an arrangement of the values that one or more variables take in a sample. Each entry in the table contains the frequency or count of the occurrences of values within a particular group or interval, and in this way, the table summarizes the distribution of values in the sample.
  • 4.
    Class intervals frequency 0-54 5-10 5 10-15 8 15-20 6 20-25 3 Total 26 Examples
  • 5.
    Graphical representation ofdata includes:- Bar graphs Double bar graphs Histogram Pie charts
  • 6.
    Bar graph A barchart or bar graph is a chart with rectangular bars with lengths proportional to the values that they represent. The bars can be plotted vertically or horizontally. Bar charts are used for plotting discrete data which has discrete values and is not continuous. Some examples of discontinuous data include 'shoe size' or 'eye colour‘ , for which you would use a bar chart.
  • 7.
    Examples 0 2 46 Category 1 Category 2 Category 3 Category 4 Series 3
  • 8.
    Double bar graphs •A double bar graph is a bar graph with two bars that compare two sets of data. Don't get too overwhelmed by the name. They really are simple to figure out when you look at them.
  • 9.
    Examples 0 1 23 4 5 Category 1 Category 2 Category 3 Category 4 Series 3 Series 2
  • 10.
    Histograms A histogram isgraph that shows data points as they apply to various ranges. Imagine, if you will, a graph that shows ascending years on the column and the amount of beer sold monthly on the line.
  • 11.
  • 12.
    Pie charts A piechart (or a circle graph) is a circular chart divided into sectors, illustrating proportion. In a pie chart, the arc length of each sector (and consequently its central angle and area), is proportional to the quantity it represents. When angles are measured with 1 turn as unit then a number of percent is identified with the same number of centiturns.
  • 13.
  • 14.