Downloaded 521 times
![k-means clustering
set.seed(8953)
iris2 <- iris
iris2$Species <- NULL
(kmeans.result <- kmeans(iris2, 3))
## K-means clustering with 3 clusters of sizes 38, 50, 62
##
## Cluster means:
## Sepal.Length Sepal.Width Petal.Length Petal.Width
## 1 6.850 3.074 5.742 2.071
## 2 5.006 3.428 1.462 0.246
## 3 5.902 2.748 4.394 1.434
##
## Clustering vector:
## [1] 2 2 2 2 2 2 2 2 2 2 2 2 2 2 2 2 2 2 2 2 2 2 2 2 2 2 2...
## [31] 2 2 2 2 2 2 2 2 2 2 2 2 2 2 2 2 2 2 2 2 3 3 1 3 3 3 3...
## [61] 3 3 3 3 3 3 3 3 3 3 3 3 3 3 3 3 3 1 3 3 3 3 3 3 3 3 3...
## [91] 3 3 3 3 3 3 3 3 3 3 1 3 1 1 1 1 3 1 1 1 1 1 1 3 3 1 1...
## [121] 1 3 1 3 1 1 3 3 1 1 1 1 1 3 1 1 1 1 3 1 1 1 3 1 1 1 3...
##
## Within cluster sum of squares by cluster:
## [1] 23.88 15.15 39.82
5 / 30](https://image.slidesharecdn.com/rdatamining-slides-clustering-140915032809-phpapp02/85/Data-Clustering-with-R-5-320.jpg)
![plot(iris2[c("Sepal.Length", "Sepal.Width")], col = kmeans.result$cluster)
points(kmeans.result$centers[, c("Sepal.Length", "Sepal.Width")],
col = 1:3, pch = 8, cex = 2) # plot cluster centers
4.5 5.0 5.5 6.0 6.5 7.0 7.5 8.0
2.0 2.5 3.0 3.5 4.0
Sepal.Length
Sepal.Width
7 / 30](https://image.slidesharecdn.com/rdatamining-slides-clustering-140915032809-phpapp02/85/Data-Clustering-with-R-7-320.jpg)
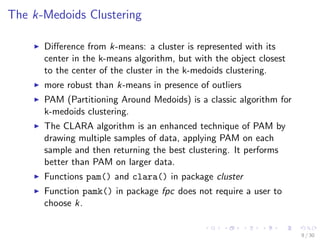
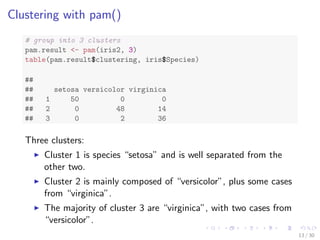
![Clustering with pamk()
library(fpc)
pamk.result - pamk(iris2)
# number of clusters
pamk.result$nc
## [1] 2
# check clustering against actual species
table(pamk.result$pamobject$clustering, iris$Species)
##
## setosa versicolor virginica
## 1 50 1 0
## 2 0 49 50
Two clusters:
I setosa
I a mixture of versicolor and virginica
10 / 30](https://image.slidesharecdn.com/rdatamining-slides-clustering-140915032809-phpapp02/85/Data-Clustering-with-R-10-320.jpg)
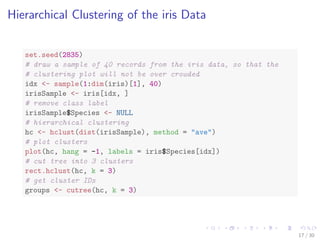

![Hierarchical Clustering of the iris Data
set.seed(2835)
# draw a sample of 40 records from the iris data, so that the
# clustering plot will not be over crowded
idx - sample(1:dim(iris)[1], 40)
irisSample - iris[idx, ]
# remove class label
irisSample$Species - NULL
# hierarchical clustering
hc - hclust(dist(irisSample), method = ave)
# plot clusters
plot(hc, hang = -1, labels = iris$Species[idx])
# cut tree into 3 clusters
rect.hclust(hc, k = 3)
# get cluster IDs
groups - cutree(hc, k = 3)
17 / 30](https://image.slidesharecdn.com/rdatamining-slides-clustering-140915032809-phpapp02/85/Data-Clustering-with-R-19-320.jpg)
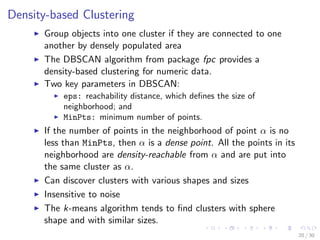
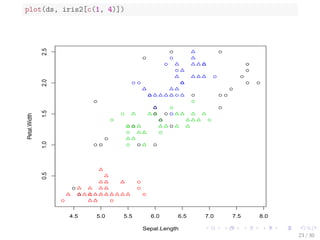
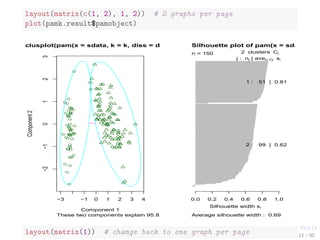
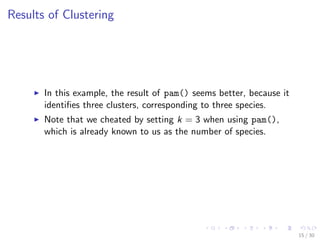
![Density-based Clustering of the iris data
library(fpc)
iris2 - iris[-5] # remove class tags
ds - dbscan(iris2, eps = 0.42, MinPts = 5)
# compare clusters with original class labels
table(ds$cluster, iris$Species)
##
## setosa versicolor virginica
## 0 2 10 17
## 1 48 0 0
## 2 0 37 0
## 3 0 3 33
I 1 to 3: identi](https://image.slidesharecdn.com/rdatamining-slides-clustering-140915032809-phpapp02/85/Data-Clustering-with-R-25-320.jpg)
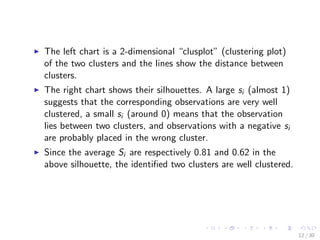
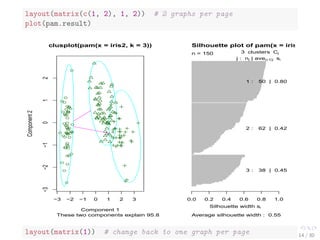
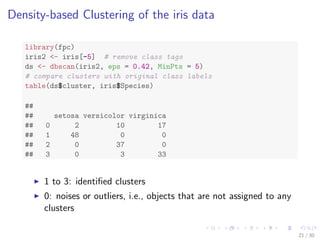
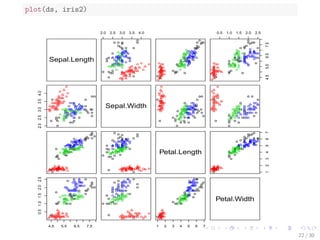
![plot(ds, iris2[c(1, 4)])
4.5 5.0 5.5 6.0 6.5 7.0 7.5 8.0
0.5 1.0 1.5 2.0 2.5
Sepal.Length
Petal.Width
23 / 30](https://image.slidesharecdn.com/rdatamining-slides-clustering-140915032809-phpapp02/85/Data-Clustering-with-R-28-320.jpg)
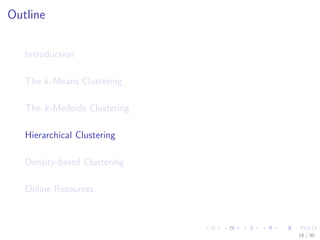
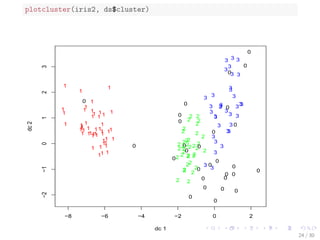
![Prediction with Clustering Model
I Label new data, based on their similarity with the clusters
I Draw a sample of 10 objects from iris and add small noises
to them to make a new dataset for labeling
I Random noises are generated with a uniform distribution
using function runif().
# create a new dataset for labeling
set.seed(435)
idx - sample(1:nrow(iris), 10)
# remove class labels
new.data - iris[idx,-5]
# add random noise
new.data - new.data + matrix(runif(10*4, min=0, max=0.2),
nrow=10, ncol=4)
# label new data
pred - predict(ds, iris2, new.data)
25 / 30](https://image.slidesharecdn.com/rdatamining-slides-clustering-140915032809-phpapp02/85/Data-Clustering-with-R-30-320.jpg)
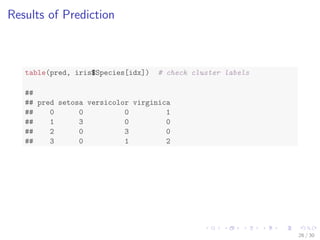
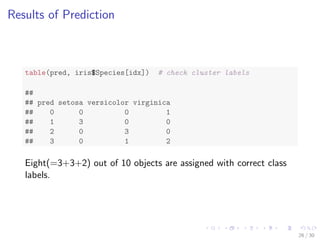
![Results of Prediction
table(pred, iris$Species[idx]) # check cluster labels
##
## pred setosa versicolor virginica
## 0 0 0 1
## 1 3 0 0
## 2 0 3 0
## 3 0 1 2
26 / 30](https://image.slidesharecdn.com/rdatamining-slides-clustering-140915032809-phpapp02/85/Data-Clustering-with-R-31-320.jpg)

The document discusses different clustering methods in R including k-means clustering, k-medoids clustering, hierarchical clustering, and density-based clustering. It provides code examples to demonstrate each method using the iris dataset. For k-means and k-medoids clustering, it shows how to interpret the results and check clustering against known classes. For hierarchical clustering, it generates a dendrogram and identifies clusters. For density-based clustering, it identifies clusters of different shapes and sizes and is able to label new prediction data.