Download as PDF, PPTX


![7Copyright (c) by Daniel K.C. Chan. All Rights Reserved.
%matplotlib inline
%config InlineBackend.figure_format = 'retina'
Python: Basic Settings
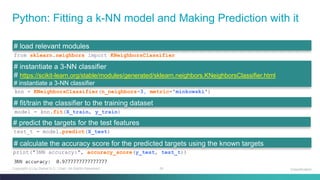
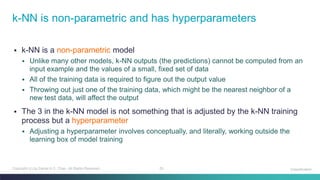
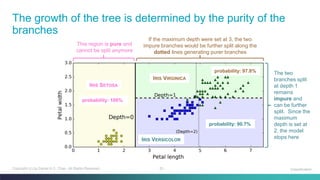
Classification
# display the output of plotting commands inline
# use the "retina" display mode, i.e. to render higher resolution images
import matplotlib.pyplot as plt
import warnings
# import the plotting module and binds it to the name "plt"
# display all warnings
# customize the display style
# set the dots per inch (dpi) from the default 100 to 300
# suppress warnings related to future versions
plt.style.use('seaborn')
plt.rcParams['figure.dpi'] = 300
warnings.simplefilter(action='ignore', category=FutureWarning)](https://image.slidesharecdn.com/machinelearning-classificationconcepts-201207110845/85/Machine-Learning-Classification-Concepts-Part-1-7-320.jpg)
![8Copyright (c) by Daniel K.C. Chan. All Rights Reserved.
import pandas as pd
import seaborn as sns
from sklearn import datasets
Python: Understanding the Iris Dataset (1)
Classification
# import the relevant modules
iris = datasets.load_iris()
# load the Iris dataset
# https://scikit-learn.org/stable/modules/generated/sklearn.datasets.load_iris.html
# create a dataframe from the feature values and names
# set the dataframe target column with the target values of the dataset
data = pd.DataFrame(iris.data, columns=iris.feature_names)
data['target'] = iris.target
data['target'] = data['target'].astype('category').cat.rename_categories(iris.target_names)
data.head(15)
# display the data shown earlier](https://image.slidesharecdn.com/machinelearning-classificationconcepts-201207110845/85/Machine-Learning-Classification-Concepts-Part-1-8-320.jpg)


![13Copyright (c) by Daniel K.C. Chan. All Rights Reserved.
from sklearn.model_selection import train_test_split
Python: Partitioning the Dataset
Classification
# load relevant modules
X_train, X_test, y_train, y_test = train_test_split(
data.drop('target', axis = 1), data['target'], test_size = 0.3, random_state = 0)
# partition dataset into training data and testing data
# https://scikit-learn.org/stable/modules/generated/sklearn.model_selection.train_test_split.html
# (1) separate the features from the target by dropping and projecting a column
# (2) specify the proportion of the testing dataset (30%)
# (3) control the shuffling using a seed (i.e. 0) to ensure reproducible output
print("Training data shape: ", X_train.shape)
print("Testing data shape: ", X_test.shape)
# display the number of rows and columns](https://image.slidesharecdn.com/machinelearning-classificationconcepts-201207110845/85/Machine-Learning-Classification-Concepts-Part-1-13-320.jpg)

![15Copyright (c) by Daniel K.C. Chan. All Rights Reserved.
import numpy as np
from sklearn.metrics import accuracy_score
Python: Evaluation by Accuracy Score
Classification
# load relevant modules
y_t = np.array([True, True, False, True])
ys = np.array([True, True, True, True])
# calculate the accuracy score using scikit-learn built-in function
# https://scikit-learn.org/stable/modules/generated/sklearn.metrics.accuracy_score.html
# it is the number of correct answers over the total number of answers
# for illustration purpose only
# build an array containing the correct answers and another array for the ML model results
print("sklearn accuracy:", accuracy_score(y_t, ys))
𝐴𝑐𝑐𝑢𝑟𝑎𝑐𝑦 =
𝑁𝑢𝑚𝑏𝑒𝑟 𝑜𝑓 𝐶𝑜𝑟𝑟𝑟𝑒𝑐𝑡 𝐴𝑛𝑠𝑤𝑒𝑟𝑠
𝑁𝑢𝑚𝑏𝑒𝑟 𝑜𝑓 𝐴𝑛𝑠𝑤𝑒𝑟𝑠](https://image.slidesharecdn.com/machinelearning-classificationconcepts-201207110845/85/Machine-Learning-Classification-Concepts-Part-1-15-320.jpg)


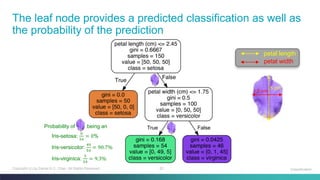


![39Copyright (c) by Daniel K.C. Chan. All Rights Reserved.
from sklearn.model_selection import cross_val_score
from sklearn.tree import DecisionTreeClassifier
Python: Decision Tree Classifier
Classification
# load relevant modules
dtc = DecisionTreeClassifier()
cross_val_score(dtc, data.drop('target',axis=1), data['target'], cv=3, scoring='accuracy')
# instantiate a decision tree classifier
# https://scikit-learn.org/stable/modules/generated/sklearn.tree.DecisionTreeClassifier.html
# evaluate the model using cross validation
# https://scikit-learn.org/stable/modules/generated/sklearn.model_selection.cross_val_score.html
# specify the cross validation to be a 3 folds cross validation
# specify the "accuracy" metric to be the model evaluation metric
# https://scikit-learn.org/stable/modules/model_evaluation.html#scoring-parameter](https://image.slidesharecdn.com/machinelearning-classificationconcepts-201207110845/85/Machine-Learning-Classification-Concepts-Part-1-39-320.jpg)
![40Copyright (c) by Daniel K.C. Chan. All Rights Reserved.
from sklearn.model_selection import cross_val_score
from sklearn.tree import DecisionTreeClassifier
Python: Decision Tree Classifier – Using Only Two Features
Classification
# load relevant modules
dtc = DecisionTreeClassifier(max_depth=2)
cross_val_score(dtc, data.drop('target',axis=1), data['target'], cv=3, scoring='accuracy')
dtc.fit(X, y)
# project two features, petal length and petal width, to predict the Iris species
# https://scikit-learn.org/stable/modules/generated/sklearn.tree.DecisionTreeClassifier.html
# evaluate the model using cross validation
# https://scikit-learn.org/stable/modules/generated/sklearn.model_selection.cross_val_score.html
X = iris.data[:,2:]
y = iris.target
# instantiate a decision tree classifier
# https://scikit-learn.org/stable/modules/generated/sklearn.tree.DecisionTreeClassifier.html](https://image.slidesharecdn.com/machinelearning-classificationconcepts-201207110845/85/Machine-Learning-Classification-Concepts-Part-1-40-320.jpg)
![41Copyright (c) by Daniel K.C. Chan. All Rights Reserved.
from sklearn import tree
from matplotlib.pyplot as plt
Python: Decision Tree Classifier – Show the Decision Tree
Classification
# import drawing libraries
print(iris.feature_names[2:])
print(iris.target_names)
print(data.columns)
print(data.target.nunique())
print(data.target.unique())
data.shape
# show attributes related to the dataset
tree.plot_tree(dtc);
# display the decision tree](https://image.slidesharecdn.com/machinelearning-classificationconcepts-201207110845/85/Machine-Learning-Classification-Concepts-Part-1-41-320.jpg)
![42Copyright (c) by Daniel K.C. Chan. All Rights Reserved.
fn = iris.feature_names[2:]
Python: Decision Tree Classifier – Show Majority Classes
Classification
# ['petal length (cm)','petal width (cm)']
cn = iris.target_names
# ['setosa', 'versicolor', 'virginica']
fig, axes = plt.subplots(
nrows=1, ncols=1,
figsize=(4,4), dpi=300)
tree.plot_tree(dtc,
feature_names=fn,
class_names=cn,
filled=True);
# paint nodes to indicate majority class](https://image.slidesharecdn.com/machinelearning-classificationconcepts-201207110845/85/Machine-Learning-Classification-Concepts-Part-1-42-320.jpg)


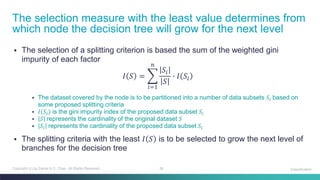
The document discusses machine learning classification concepts, focusing on the iris dataset used for training and testing classifiers like k-nearest neighbours and decision trees. It covers key topics such as data partitioning, evaluation by accuracy score, and defining metrics to measure distance for k-NN. Additionally, it explains the process of building a decision tree and calculating gini impurity for multiclass classification tasks.


![[ppt]](https://cdn.slidesharecdn.com/ss_thumbnails/ppt2931-thumbnail.jpg?width=640&height=640&fit=bounds)
![[ppt]](https://cdn.slidesharecdn.com/ss_thumbnails/ppt3441-thumbnail.jpg?width=640&height=640&fit=bounds)