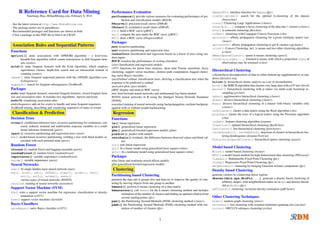
This document provides a summary of data mining and text mining packages and functions available in R. It lists popular packages and functions for tasks such as association rule mining, classification/prediction using decision trees and random forests, clustering, outlier detection, time series analysis, text cleaning/preparation, topic modeling, and social network analysis. It also includes packages and functions for evaluating model performance and visualizing results.
This document provides a reference card for data mining functions and packages in R. It lists popular R packages and functions for tasks such as association rule mining, classification/prediction, clustering, outlier detection, time series analysis, text mining, and social network analysis. Recommended packages and functions are shown in bold.
Mining Top-k Closed Sequential Patterns in Sequential Databases IOSR Journals
Abstract: In data mining community, sequential pattern mining has been studied extensively. Most studies
require the specification of minimum support threshold to mine the sequential patterns. However, it is difficult
for users to provide an appropriate threshold in practice. To overcome this, we propose mining top-k closed
sequential patterns of length no less than min_l, where k is the number of closed sequential patterns to be
mined, and min_l is the minimum length of each pattern. We mine closed patterns since they are solid
representations of frequent patterns.
Keywords: closed pattern, data mining, sequential pattern, scalability
The Optimum Clustering Framework: Implementing the Cluster Hypothesisyaevents
The document proposes a framework for optimum document clustering based on the cluster hypothesis. It defines a cluster metric called pairwise precision that evaluates how well a clustering groups together documents that are relevant to the same queries. The metric considers the number of document pairs that are both relevant or both irrelevant to a query within each cluster. The framework aims to find the clustering that maximizes this metric to optimally satisfy the cluster hypothesis. The document outlines experiments to test the framework and examine whether it leads to improved clustering over traditional methods.
Support Vector Machines in MapReduce presented an overview of support vector machines (SVMs) and how to implement them in a MapReduce framework to handle large datasets. The document discussed the theory behind basic linear SVMs and generalized multi-classification SVMs. It explained how to parallelize SVM training using stochastic gradient descent and randomly distributing samples across mappers and reducers. The document also addressed handling non-linear SVMs using kernel methods and approximations that allow SVMs to be treated as a linear problem in MapReduce. Finally, examples were given of large companies using SVMs trained on MapReduce to perform customer segmentation and improve inventory value.
The caret package provides a unified interface for predictive modeling and model tuning in R. It allows users to preprocess data, tune models using resampling methods, and evaluate and compare models. The package contains functions for splitting data, preprocessing data, training models using resampling for tuning hyperparameters, making predictions, and assessing model performance. It supports over 100 different modeling techniques and aims to streamline the model building process.
This set of slides is based on the presentation I gave at ACM DataScience camp 2014. This is suitable for those who are still new to R. It has a few basic data manipulation techniques, and then goes into the basics of using of the dplyr package (Hadley Wickham) #rstats #dplyr
“Practical Data Science”. R programming language and Jupiter notebooks are used in this tutorial. However, the concepts are generic and can be applied for Python or other programming language users as well.
This document summarizes an introduction to deep learning with MXNet and R. It discusses MXNet, an open source deep learning framework, and how to use it with R. It then provides an example of using MXNet and R to build a deep learning model to predict heart disease by analyzing MRI images. Specifically, it discusses loading MRI data, architecting a convolutional neural network model, training the model, and evaluating predictions against actual heart volume measurements. The document concludes by discussing additional ways the model could be explored and improved.
The document defines a function called covcor() that calculates and returns the covariance and correlation between variables in a data frame. The function takes a data frame as input, splits it by a grouping variable, applies covariance and correlation calculations to subsets of the data, and combines the results into an output data frame. Three methods for defining the covcor() function are presented: 1) Using subset() and merge(), 2) Using tapply(), and 3) Using ddply() from the plyr package. The function is demonstrated on orange tree data to calculate covariance and correlation between tree age and circumference for each tree. Transforming the circumference variable affects the covariance but not the correlation, demonstrating properties of these statistical measures.
The document discusses regression models for modeling relationships between input and output variables. It covers linear regression, using linear functions to model the relationship, and nonlinear regression, using nonlinear functions. Maximum a posteriori (MAP) estimation and least squares estimation are described as approaches for estimating the parameters of regression models from data. MAP estimation maximizes the posterior probability of the parameters given the data and assumes prior probabilities on the parameters, while least squares minimizes error. Regularized least squares is also covered, which adds a regularization term to improve stability. Computer experiments are demonstrated applying linear regression to classification problems.
This document provides an overview of the dplyr package in R. It describes several key functions in dplyr for manipulating data frames, including verbs like filter(), select(), arrange(), mutate(), and summarise(). It also covers grouping data with group_by() and joining data with joins like inner_join(). Pipelines of dplyr operations can be chained together using the %>% operator from the magrittr package. The document concludes that dplyr provides simple yet powerful verbs for transforming data frames in a convenient way.
Stockage, manipulation et analyse de données matricielles avec PostGIS RasterACSG Section Montréal
La plus importantes nouveautés de la base de données spatiale open source PostgreSQL/PostGIS 2.0 est le support pour les données raster. PostGIS Raster comprend un outil d’importation similaire à shp2pgsql basé sur GDAL et une série d’opérateurs SQL pour la manipulation et l'analyse des données matricielles. Le nouveau type RASTER est géoréférencé, multi-résolutions et multi-bandes et il supporte une valeur nulle (nodata) et un type de valeur de pixel par bande. PostGIS raster s’inspire de la simplicité de l’expérience vecteur offerte par PostGIS pour rendre toutes les opérations raster aussi simples que possible. Comme pour une couverture vecteur, une couverture raster est divisée en un ensemble d’enregistrements (une ligne = une tuile) stockés dans une seule table (contrairement à Oracle Spatial qui utilise deux types et donc deux tables ou plus). Il est possible d’importer une couverture complète et de la retuiler en une seule commande avec l’outil d’importation et de multiples résolutions de la même couverture peuvent être importées dans des tables adjacentes. Les propriétés des objets raster et de chacune des bandes peuvent être consultées et modifiées ainsi que les valeurs des pixels. Des fonctions existent pour obtenir le minimum, le maximum, la somme, la moyenne, la déviation standard, l’histogramme d’une tuile ou d’une couverture complète. Les fonctions ST_Intersection() et ST_Intersects() fonctionnent pratiquement de manière transparente entre des données raster et vecteur et une série de fonctions pour l’algèbre matricielle (ST_MapAlgebra()) permet de faire de l’analyse de type raster. Il est possible de reclasser les bandes et de les convertir en n’importe quel format d’écriture GDAL. Des fonctions pour générer des rasters et des bandes existent également pour du développement PL/pgSQL. Un driver GDAL pour convertir les couvertures raster en fichiers images est en développement et des plugins pour QGIS et svSIG existent déjà pour les visualiser.
The document discusses distributed linear classification on Apache Spark. It describes using Spark to train logistic regression and linear support vector machine models on large datasets. Spark improves on MapReduce by conducting communications in-memory and supporting fault tolerance. The paper proposes using a trust region Newton method to optimize the objective functions for logistic regression and linear SVM. Conjugate gradient is used to approximate the Hessian matrix and solve the Newton system without explicitly storing the large Hessian.
dmapply: A functional primitive to express distributed machine learning algor...Bikash Chandra Karmokar
ddR is a package that introduces distributed data structures in R like darray, dframe, and dlist. It provides a standardized API for distributed iteration and data manipulation through functions like dmapply. ddR aims to make distributed computing in R easier to use with good performance by writing algorithms once that can run on different distributed backends like Spark, HPE Distributed R through its unified interface. Evaluation shows ddR algorithms have performance comparable or better than custom implementations and other machine learning libraries.
This document discusses heaps and their use in implementing priority queues. It describes how a max-heap or min-heap is a complete binary tree that satisfies the heap property, where each internal node is greater than or equal to its children. It explains how a heap can be represented using a simple array and how to build a heap from an unsorted array in O(n) time by sifting nodes down. Deleting the root element and maintaining the heap property takes O(log n) time. Heap sort uses a heap to sort an array in O(n log n) time. Priority queues can be efficiently implemented using max-heaps.
Mining Approach for Updating Sequential PatternsIOSR Journals
This document describes an algorithm for incrementally mining sequential patterns from transactional databases when new transactions are added. The algorithm aims to minimize I/O and computation requirements by maintaining information on "maximally frequent" and "minimally infrequent" sequences from the original database. When new data arrives, it is combined with the existing maximal and minimal information to determine which portions of the original database need to be re-scanned. This approach improves execution time over fully re-mining the pattern space from scratch.
Processing Reachability Queries with Realistic Constraints on Massive Network...BigMine
Massive graphs are ubiquitous in various application domains, such as social networks, road networks, communication networks, biological networks, RDF graphs, and so on. Such graphs are massive (for example, with hundreds of millions of nodes and edges or even more) and contain rich information (for example, node/edge weights, labels and textual contents). In such massive graphs, an important class of problems is to process various graph structure related queries. Graph reachability, as an example, asks whether a node can reach another in a graph. However, the large graph scale presents new challenges for efficient query processing.
In this talk, I will introduce two new yet important types of graph reachability queries: weight constraint reachability that imposes edge weight constraint on the answer path, and k-hop reachability that imposes a length constraint on the answer path. With such realistic constraints, we can find more meaningful and practically feasible answers. These two reachablity queries have wide applications in many real-world problems, such as QoS routing and trip planning.
Overview of a few ways to group and summarize data in R using sample airfare data from DOT/BTS's O&D Survey.
Starts with naive approach with subset() & loops, shows base R's tapply() & aggregate(), highlights doBy and plyr packages.
Presented at the March 2011 meeting of the Greater Boston useR Group.
This document discusses optimization techniques for memory and cache usage. It begins with an overview of the memory hierarchy and justification for optimization. It then covers optimizing code and data caches through techniques like prefetching, structure layout, tree data structures, and linearization caching. It also discusses memory allocation policies and reducing aliasing through techniques like restricting pointers and analysis. The overall goal is to discuss how to improve cache utilization and thereby increase performance.
Query optimizers and people have one thing in common: the better they understand their data, the better they can do their jobs. Optimizing queries is hard if you don't have good estimates for the sizes of the intermediate join and aggregate results. Data profiling is a technique that scans data, looking for patterns within the data such as keys, functional dependencies, and correlated columns. These richer statistics can be used in Apache Calcite's query optimizer, and the projects that use it, such as Apache Hive, Phoenix and Drill. We describe how we built a data profiler as a table function in Apache Calcite, review the recent research and algorithms that made it possible, and show how you can use the profiler to improve the quality of your data.
A talk given by Julian Hyde at Apache: Big Data, Miami, on May 16th 2017.
The document discusses different clustering methods in R including k-means clustering, k-medoids clustering, hierarchical clustering, and density-based clustering. It provides code examples to demonstrate each method using the iris dataset. For k-means and k-medoids clustering, it shows how to interpret the results and check clustering against known classes. For hierarchical clustering, it generates a dendrogram and identifies clusters. For density-based clustering, it identifies clusters of different shapes and sizes and is able to label new prediction data.
A2DataDive workshop speakers Alex Ocampo, Chong Zhang, Sangwon Hyun, Yiqun Hu. A2 Data Dive. Feb. 10- 12, 2012. visit the wiki for more information: http://wiki.datawithoutborders.cc/index.php?title=Project:Current_events:A2_DD
This document provides an outline for a presentation on data mining with R. It introduces R and why it is useful for data mining. It then outlines various data mining techniques that can be performed in R, including classification, clustering, association rule mining, text mining, time series analysis, and social network analysis. Examples are provided for classification using decision trees on the iris dataset, k-means clustering on iris data, and association rule mining on the Titanic dataset.
This document discusses building regression and classification models in R, including linear regression, generalized linear models, and decision trees. It provides examples of building each type of model using various R packages and datasets. Linear regression is used to predict CPI data. Generalized linear models and decision trees are built to predict body fat percentage. Decision trees are also built on the iris dataset to classify flower species.
This document provides an introduction to using R for data mining. It discusses R being a full programming language and home to many data mining algorithms. The webinar aims to convince attendees that R is a serious platform for data mining. It covers getting started with R, popular machine learning functions and packages, and running example code. The document also discusses working with big data using RevoScaleR and Revolution R Enterprise.
The document discusses association rule mining with R. It provides an overview of association rule mining concepts like support, confidence and lift. It then demonstrates how to use the apriori() function in R to generate association rules from the Titanic dataset. The document shows how to remove redundant rules, interpret rules and visualize rules using scatter plots and matrices.
Text Mining with R -- an Analysis of Twitter DataYanchang Zhao
This document discusses analyzing Twitter data using text mining techniques in R. It outlines extracting tweets from Twitter and cleaning the text by removing punctuation, numbers, URLs, and stopwords. It then analyzes the cleaned text by finding frequent words, word associations, and creating a word cloud visualization. It performs text clustering on the tweets using hierarchical and k-means clustering. Finally, it models topics in the tweets using partitioning around medoids clustering. The overall goal is to demonstrate various text mining and natural language processing techniques for analyzing Twitter data in R.
This document provides a summary of R packages and functions for data mining techniques including association rules, frequent itemsets, sequential patterns, classification, regression, and clustering. It lists popular algorithms like APRIORI, ECLAT, k-means, hierarchical clustering, and density-based clustering. It also summarizes packages that implement these algorithms and evaluate model performance.
This document provides an overview of machine learning techniques that can be applied in finance, including exploratory data analysis, clustering, classification, and regression methods. It discusses statistical learning approaches like data mining and modeling. For clustering, it describes techniques like k-means clustering, hierarchical clustering, Gaussian mixture models, and self-organizing maps. For classification, it mentions discriminant analysis, decision trees, neural networks, and support vector machines. It also provides summaries of regression, ensemble methods, and working with big data and distributed learning.
This document provides an overview of various machine learning algorithms and concepts, including supervised learning techniques like linear regression, logistic regression, decision trees, random forests, and support vector machines. It also discusses unsupervised learning methods like principal component analysis and kernel-based PCA. Key aspects of linear regression, logistic regression, and random forests are summarized, such as cost functions, gradient descent, sigmoid functions, and bagging. Kernel methods are also introduced, explaining how the kernel trick can allow solving non-linear problems by mapping data to a higher-dimensional feature space.
Clustering and Visualisation using R programmingNixon Mendez
Clustering Analysis is a collection of patterns into clusters based on similarity.
Here we will discuss on the following :
Microarray Data of Yeast Cell Cycle
Clustering Analysis :-
Principal Component Analysis (PCA)
Multidimensional Scaling (MDS)
K-Means
Self-Organizing Maps (SOM)
Hierarchical Clustering
The document proposes a new method called Kernel-based Dynamic Subspace Method (KDSM) for classifying high-dimensional data. KDSM combines an ensemble technique of support vector machines with an optimal kernel method. It uses a dynamic subspace approach to select informative feature subsets and an optimal algorithm to select parameters for the radial basis function kernel. The method is tested on hyperspectral image data and achieves higher classification accuracy compared to other methods while also reducing computation time, especially for datasets with small training sizes.
Ubix is an integrated platform built on Apache Spark that allows users to ingest data from various sources, perform multiple analytics steps and transformations, and produce powerful interactive visualizations on both historical and streaming data. It contains over 170 functions for data wrangling, machine learning, graph processing, and visualization. While users could build their own Spark workflows, Ubix aims to simplify this process and provide an out-of-the-box platform for advanced analytics.
Cluster analysis is an unsupervised learning technique used to group unlabeled data points into meaningful clusters. There are several approaches to cluster analysis including partitioning methods like k-means, hierarchical clustering methods like agglomerative nesting (AGNES), and density-based methods like DBSCAN. The quality of clusters is evaluated based on intra-cluster similarity and inter-cluster dissimilarity. Cluster analysis has applications in fields like pattern recognition, image processing, and market segmentation.
This document discusses machine learning algorithms in R. It provides an overview of machine learning, data science, and the 5 V's of big data. It then discusses two main machine learning algorithms - clustering and classification. For clustering, it covers k-means clustering, providing examples of how to implement k-means clustering in R. For classification, it discusses decision trees, K-nearest neighbors (KNN), and provides an example of KNN classification in R. It also provides a brief overview of regression analysis, including examples of simple and multiple linear regression in R.
The document discusses various clustering methods used in data mining. It describes partitioning methods like k-means and k-medoids which group data into a set number of clusters based on distance between data points. Hierarchical clustering creates nested clusters based on distance metrics. Density-based methods find clusters based on connectivity and density. Model-based clustering fits a model to each cluster.
This document provides a cheat sheet on vector and matrix operations, time series analysis functions, modeling functions, and plotting functions in R. It includes the basic syntax for constructing and selecting vectors and matrices, as well as functions for time series decomposition, modeling, testing, and plotting time series data. Examples are given for accessing Quandl data and plotting it using ggplot2.
Nyc open-data-2015-andvanced-sklearn-expandedVivian S. Zhang
Scikit-learn is a machine learning library in Python, that has become a valuable tool for many data science practitioners.
This talk will cover some of the more advanced aspects of scikit-learn, such as building complex machine learning pipelines, model evaluation, parameter search, and out-of-core learning.
Apart from metrics for model evaluation, we will cover how to evaluate model complexity, and how to tune parameters with grid search, randomized parameter search, and what their trade-offs are. We will also cover out of core text feature processing via feature hashing.
---------------------------------------------------------
Andreas is an Assistant Research Scientist at the NYU Center for Data Science, building a group to work on open source software for data science. Previously he worked as a Machine Learning Scientist at Amazon, working on computer vision and forecasting problems. He is one of the core developers of the scikit-learn machine learning library, and maintained it for several years.
Material will be posted here:
https://github.com/amueller/pydata-nyc-advanced-sklearn
Blog:
peekaboo-vision.blogspot.com
Twitter:
https://twitter.com/t3kcit
Data Mining: Mining stream time series and sequence dataDatamining Tools
This document discusses various methodologies for processing and analyzing stream data, time series data, and sequence data. It covers topics such as random sampling and sketches/synopses for stream data, data stream management systems and queries, the Hoeffding tree and Very Fast Decision Tree (VFDT) algorithms for classification, ensemble methods and concept drift, clustering of evolving data streams, trend analysis and similarity search for time series data, Markov chains for sequence analysis, and algorithms like the forward algorithm, Viterbi algorithm, and Baum-Welch algorithm for hidden Markov models.
This document discusses various methodologies for processing and analyzing stream data, time series data, and sequence data. It covers topics such as random sampling and sketches/synopses for stream data, data stream management systems, the Hoeffding tree and VFDT algorithms for stream data classification, concept-adapting algorithms, ensemble approaches, clustering of evolving data streams, time series databases, Markov chains for sequence analysis, and algorithms like the forward algorithm, Viterbi algorithm, and Baum-Welch algorithm for hidden Markov models.
5.4 mining sequence patterns in biological dataKrish_ver2
This document discusses methods for mining sequence patterns in biological data, including alignment algorithms and hidden Markov models. It covers pairwise and multiple sequence alignment algorithms like Needleman-Wunsch, Smith-Waterman, BLAST, and FASTA. Hidden Markov models are introduced as a method to find conserved patterns or features in long biological sequences, such as CpG islands. The document outlines how hidden Markov models incorporate states, transitions, and emission probabilities to represent probabilistic sequences and can be used for tasks like evaluation, decoding, and learning on biological sequence data.
This document discusses using k-means clustering in Spark to detect device anomalies based on device feature data. It provides an example of device data with attributes like battery percentage and RAM usage. It also shows example Scala code to perform k-means clustering on this data, including normalizing the data first before clustering. The results show data points clustered and predictions assigned.
The caret package provides a unified interface for predictive modeling in R. It allows users to streamline model tuning and selection using resampling methods. Caret increases efficiency by integrating with parallel processing. It handles preprocessing, model training and tuning, and performance evaluation. The package documentation provides numerous examples for classification and regression tasks.
The document outlines the general pipeline for transcriptomics analysis based on microarray experiments. It discusses the main steps which include quality control, normalization, annotation, differential expression analysis, clustering, and supplemental analyses such as functional enrichment and transcription factor binding site analysis. Key points within each step are highlighted, such as common normalization and differential expression methods, different clustering algorithms, and tools used for enrichment and transcription factor analysis.
Distributed approximate spectral clustering for large scale datasetsBita Kazemi
The document proposes a distributed approximate spectral clustering (DASC) algorithm to process large datasets in a scalable way. DASC uses locality sensitive hashing to group similar data points and then approximates the kernel matrix on each group to reduce computation. It implements DASC using MapReduce and evaluates it on real and synthetic datasets, showing it can achieve similar clustering accuracy to standard spectral clustering but with an order of magnitude better runtime by distributing the computation across clusters.
Algoritma fuzzy c means fcm java c++ contoh programym.ygrex@comp
This document provides source code for an implementation of the fuzzy c-means clustering algorithm in Java. It includes:
1) An overview of the fuzzy c-means algorithm and its concepts
2) The Java source code for a basic fuzzy c-means clustering image processing task, including comments explaining the code
3) Initialization of parameters like the input image, number of clusters, maximum iterations, and more.
4) Main steps of the fuzzy c-means algorithm like calculating membership values, cluster centers, and objective function.
5) Checks for convergence and output of the cluster assignments.
Beyond the Basics of A/B Tests: Highly Innovative Experimentation Tactics You...Aggregage
This webinar will explore cutting-edge, less familiar but powerful experimentation methodologies which address well-known limitations of standard A/B Testing. Designed for data and product leaders, this session aims to inspire the embrace of innovative approaches and provide insights into the frontiers of experimentation!
Predictably Improve Your B2B Tech Company's Performance by Leveraging DataKiwi Creative
Harness the power of AI-backed reports, benchmarking and data analysis to predict trends and detect anomalies in your marketing efforts.
Peter Caputa, CEO at Databox, reveals how you can discover the strategies and tools to increase your growth rate (and margins!).
From metrics to track to data habits to pick up, enhance your reporting for powerful insights to improve your B2B tech company's marketing.
- - -
This is the webinar recording from the June 2024 HubSpot User Group (HUG) for B2B Technology USA.
Watch the video recording at https://youtu.be/5vjwGfPN9lw
Sign up for future HUG events at https://events.hubspot.com/b2b-technology-usa/
The Building Blocks of QuestDB, a Time Series Databasejavier ramirez
Talk Delivered at Valencia Codes Meetup 2024-06.
Traditionally, databases have treated timestamps just as another data type. However, when performing real-time analytics, timestamps should be first class citizens and we need rich time semantics to get the most out of our data. We also need to deal with ever growing datasets while keeping performant, which is as fun as it sounds.
It is no wonder time-series databases are now more popular than ever before. Join me in this session to learn about the internal architecture and building blocks of QuestDB, an open source time-series database designed for speed. We will also review a history of some of the changes we have gone over the past two years to deal with late and unordered data, non-blocking writes, read-replicas, or faster batch ingestion.
ViewShift: Hassle-free Dynamic Policy Enforcement for Every Data LakeWalaa Eldin Moustafa
Dynamic policy enforcement is becoming an increasingly important topic in today’s world where data privacy and compliance is a top priority for companies, individuals, and regulators alike. In these slides, we discuss how LinkedIn implements a powerful dynamic policy enforcement engine, called ViewShift, and integrates it within its data lake. We show the query engine architecture and how catalog implementations can automatically route table resolutions to compliance-enforcing SQL views. Such views have a set of very interesting properties: (1) They are auto-generated from declarative data annotations. (2) They respect user-level consent and preferences (3) They are context-aware, encoding a different set of transformations for different use cases (4) They are portable; while the SQL logic is only implemented in one SQL dialect, it is accessible in all engines.
#SQL #Views #Privacy #Compliance #DataLake
End-to-end pipeline agility - Berlin Buzzwords 2024Lars Albertsson
We describe how we achieve high change agility in data engineering by eliminating the fear of breaking downstream data pipelines through end-to-end pipeline testing, and by using schema metaprogramming to safely eliminate boilerplate involved in changes that affect whole pipelines.
A quick poll on agility in changing pipelines from end to end indicated a huge span in capabilities. For the question "How long time does it take for all downstream pipelines to be adapted to an upstream change," the median response was 6 months, but some respondents could do it in less than a day. When quantitative data engineering differences between the best and worst are measured, the span is often 100x-1000x, sometimes even more.
A long time ago, we suffered at Spotify from fear of changing pipelines due to not knowing what the impact might be downstream. We made plans for a technical solution to test pipelines end-to-end to mitigate that fear, but the effort failed for cultural reasons. We eventually solved this challenge, but in a different context. In this presentation we will describe how we test full pipelines effectively by manipulating workflow orchestration, which enables us to make changes in pipelines without fear of breaking downstream.
Making schema changes that affect many jobs also involves a lot of toil and boilerplate. Using schema-on-read mitigates some of it, but has drawbacks since it makes it more difficult to detect errors early. We will describe how we have rejected this tradeoff by applying schema metaprogramming, eliminating boilerplate but keeping the protection of static typing, thereby further improving agility to quickly modify data pipelines without fear.
Global Situational Awareness of A.I. and where its headedvikram sood
You can see the future first in San Francisco.
Over the past year, the talk of the town has shifted from $10 billion compute clusters to $100 billion clusters to trillion-dollar clusters. Every six months another zero is added to the boardroom plans. Behind the scenes, there’s a fierce scramble to secure every power contract still available for the rest of the decade, every voltage transformer that can possibly be procured. American big business is gearing up to pour trillions of dollars into a long-unseen mobilization of American industrial might. By the end of the decade, American electricity production will have grown tens of percent; from the shale fields of Pennsylvania to the solar farms of Nevada, hundreds of millions of GPUs will hum.
The AGI race has begun. We are building machines that can think and reason. By 2025/26, these machines will outpace college graduates. By the end of the decade, they will be smarter than you or I; we will have superintelligence, in the true sense of the word. Along the way, national security forces not seen in half a century will be un-leashed, and before long, The Project will be on. If we’re lucky, we’ll be in an all-out race with the CCP; if we’re unlucky, an all-out war.
Everyone is now talking about AI, but few have the faintest glimmer of what is about to hit them. Nvidia analysts still think 2024 might be close to the peak. Mainstream pundits are stuck on the wilful blindness of “it’s just predicting the next word”. They see only hype and business-as-usual; at most they entertain another internet-scale technological change.
Before long, the world will wake up. But right now, there are perhaps a few hundred people, most of them in San Francisco and the AI labs, that have situational awareness. Through whatever peculiar forces of fate, I have found myself amongst them. A few years ago, these people were derided as crazy—but they trusted the trendlines, which allowed them to correctly predict the AI advances of the past few years. Whether these people are also right about the next few years remains to be seen. But these are very smart people—the smartest people I have ever met—and they are the ones building this technology. Perhaps they will be an odd footnote in history, or perhaps they will go down in history like Szilard and Oppenheimer and Teller. If they are seeing the future even close to correctly, we are in for a wild ride.
Let me tell you what we see.
Codeless Generative AI Pipelines
(GenAI with Milvus)
https://ml.dssconf.pl/user.html#!/lecture/DSSML24-041a/rate
Discover the potential of real-time streaming in the context of GenAI as we delve into the intricacies of Apache NiFi and its capabilities. Learn how this tool can significantly simplify the data engineering workflow for GenAI applications, allowing you to focus on the creative aspects rather than the technical complexities. I will guide you through practical examples and use cases, showing the impact of automation on prompt building. From data ingestion to transformation and delivery, witness how Apache NiFi streamlines the entire pipeline, ensuring a smooth and hassle-free experience.
Timothy Spann
https://www.youtube.com/@FLaNK-Stack
https://medium.com/@tspann
https://www.datainmotion.dev/
milvus, unstructured data, vector database, zilliz, cloud, vectors, python, deep learning, generative ai, genai, nifi, kafka, flink, streaming, iot, edge
Analysis insight about a Flyball dog competition team's performanceroli9797
Insight of my analysis about a Flyball dog competition team's last year performance. Find more: https://github.com/rolandnagy-ds/flyball_race_analysis/tree/main
Analysis insight about a Flyball dog competition team's performance
R refcard-data-mining
1. R Reference Card for Data Mining
Yanchang Zhao, RDataMining.com, February 6, 2014
- See the latest version at http://www.RDataMining.com
- The package names are in parentheses.
- Recommended packages and functions are shown in bold.
- Click a package in this PDF file to find it on CRAN.
Association Rules and Sequential Patterns
Functions
apriori() mine associations with APRIORI algorithm – a level-wise,
breadth-first algorithm which counts transactions to find frequent item-
sets (arules)
eclat() mine frequent itemsets with the Eclat algorithm, which employs
equivalence classes, depth-first search and set intersection instead of
counting (arules)
cspade() mine frequent sequential patterns with the cSPADE algorithm (aru-
lesSequences)
seqefsub() search for frequent subsequences (TraMineR)
Packages
arules mine frequent itemsets, maximal frequent itemsets, closed frequent item-
sets and association rules. It includes two algorithms, Apriori and Eclat.
arulesViz visualizing association rules
arulesSequences add-on for arules to handle and mine frequent sequences
TraMineR mining, describing and visualizing sequences of states or events
Classification & Prediction
Decision Trees
ctree() conditional inference trees, recursive partitioning for continuous, cen-
sored, ordered, nominal and multivariate response variables in a condi-
tional inference framework (party)
rpart() recursive partitioning and regression trees (rpart)
mob() model-based recursive partitioning, yielding a tree with fitted models as-
sociated with each terminal node (party)
Random Forest
cforest() random forest and bagging ensemble (party)
randomForest() random forest (randomForest)
importance() variable importance (randomForest)
varimp() variable importance (party)
Neural Networks
nnet() fit single-hidden-layer neural network (nnet)
mlp(), dlvq(), rbf(), rbfDDA(), elman(), jordan(), som(),
art1(), art2(), artmap(), assoz()
various types of neural networks (RSNNS)
neuralnet training of neural networks (neuralnet)
Support Vector Machine (SVM)
svm() train a support vector machine for regression, classification or density-
estimation (e1071)
ksvm() support vector machines (kernlab)
Bayes Classifiers
naiveBayes() naive Bayes classifier (e1071)
Performance Evaluation
performance() provide various measures for evaluating performance of pre-
diction and classification models (ROCR)
PRcurve() precision-recall curves (DMwR)
CRchart() cumulative recall charts (DMwR)
roc() build a ROC curve (pROC)
auc() compute the area under the ROC curve (pROC)
ROC() draw a ROC curve (DiagnosisMed)
Packages
party recursive partitioning
rpart recursive partitioning and regression trees
randomForest classification and regression based on a forest of trees using ran-
dom inputs
ROCR visualize the performance of scoring classifiers
caret classification and regression models
r1071 functions for latent class analysis, short time Fourier transform, fuzzy
clustering, support vector machines, shortest path computation, bagged cluster-
ing, naive Bayes classifier, ...
rpartOrdinal ordinal classification trees, deriving a classification tree when the
response to be predicted is ordinal
rpart.plot plots rpart models
pROC display and analyze ROC curves
nnet feed-forward neural networks and multinomial log-linear models
RSNNS neural networks in R using the Stuttgart Neural Network Simulator
(SNNS)
neuralnet training of neural networks using backpropagation, resilient backprop-
agation with or without weight backtracking
Regression
Functions
lm() linear regression
glm() generalized linear regression
gbm() generalized boosted regression models (gbm)
predict() predict with models
residuals() residuals, the difference between observed values and fitted val-
ues
nls() non-linear regression
gls() fit a linear model using generalized least squares (nlme)
gnls() fit a nonlinear model using generalized least squares (nlme)
Packages
nlme linear and nonlinear mixed effects models
gbm generalized boosted regression models
Clustering
Partitioning based Clustering
partition the data into k groups first and then try to improve the quality of clus-
tering by moving objects from one group to another
kmeans() perform k-means clustering on a data matrix
kmeansruns() call kmeans for the k-means clustering method and includes
estimation of the number of clusters and finding an optimal solution from
several starting points (fpc)
pam() the Partitioning Around Medoids (PAM) clustering method (cluster)
pamk() the Partitioning Around Medoids (PAM) clustering method with esti-
mation of number of clusters (fpc)
kmeansCBI() interface function for kmeans (fpc)
cluster.optimal() search for the optimal k-clustering of the dataset
(bayesclust)
clara() Clustering Large Applications (cluster)
fanny(x,k,...) compute a fuzzy clustering of the data into k clusters (cluster)
kcca() k-centroids clustering (flexclust)
ccfkms() clustering with Conjugate Convex Functions (cba)
apcluster() affinity propagation clustering for a given similarity matrix (ap-
cluster)
apclusterK() affinity propagation clustering to get K clusters (apcluster)
cclust() Convex Clustering, incl. k-means and two other clustering algorithms
(cclust)
KMeansSparseCluster() sparse k-means clustering (sparcl)
tclust(x,k,alpha,...) trimmed k-means with which a proportion alpha of
observations may be trimmed (tclust)
Hierarchical Clustering
a hierarchical decomposition of data in either bottom-up (agglomerative) or top-
down (divisive) way
hclust() hierarchical cluster analysis on a set of dissimilarities
birch() the BIRCH algorithm that clusters very large data with a CF-tree (birch)
pvclust() hierarchical clustering with p-values via multi-scale bootstrap re-
sampling (pvclust)
agnes() agglomerative hierarchical clustering (cluster)
diana() divisive hierarchical clustering (cluster)
mona() divisive hierarchical clustering of a dataset with binary variables only
(cluster)
rockCluster() cluster a data matrix using the Rock algorithm (cba)
proximus() cluster the rows of a logical matrix using the Proximus algorithm
(cba)
isopam() Isopam clustering algorithm (isopam)
flashClust() optimal hierarchical clustering (flashClust)
fastcluster() fast hierarchical clustering (fastcluster)
cutreeDynamic(), cutreeHybrid() detection of clusters in hierarchical clus-
tering dendrograms (dynamicTreeCut)
HierarchicalSparseCluster() hierarchical sparse clustering (sparcl)
Model based Clustering
Mclust() model-based clustering (mclust)
HDDC() a model-based method for high dimensional data clustering (HDclassif)
fixmahal() Mahalanobis Fixed Point Clustering (fpc)
fixreg() Regression Fixed Point Clustering (fpc)
mergenormals() clustering by merging Gaussian mixture components (fpc)
Density based Clustering
generate clusters by connecting dense regions
dbscan(data,eps,MinPts,...) generate a density based clustering of
arbitrary shapes, with neighborhood radius set as eps and density thresh-
old as MinPts (fpc)
pdfCluster() clustering via kernel density estimation (pdfCluster)
Other Clustering Techniques
mixer() random graph clustering (mixer)
nncluster() fast clustering with restarted minimum spanning tree (nnclust)
orclus() ORCLUS subspace clustering (orclus)
1
2. Plotting Clustering Solutions
plotcluster() visualisation of a clustering or grouping in data (fpc)
bannerplot() a horizontal barplot visualizing a hierarchical clustering (cluster)
Cluster Validation
silhouette() compute or extract silhouette information (cluster)
cluster.stats() compute several cluster validity statistics from a clustering
and a dissimilarity matrix (fpc)
clValid() calculate validation measures for a given set of clustering algorithms
and number of clusters (clValid)
clustIndex() calculate the values of several clustering indexes, which can be
independently used to determine the number of clusters existing in a data
set (cclust)
NbClust() provide 30 indices for cluster validation and determining the number
of clusters (NbClust)
Packages
cluster cluster analysis
fpc various methods for clustering and cluster validation
mclust model-based clustering and normal mixture modeling
birch clustering very large datasets using the BIRCH algorithm
pvclust hierarchical clustering with p-values
apcluster Affinity Propagation Clustering
cclust Convex Clustering methods, including k-means algorithm, On-line Up-
date algorithm and Neural Gas algorithm and calculation of indexes for finding
the number of clusters in a data set
cba Clustering for Business Analytics, including clustering techniques such as
Proximus and Rock
bclust Bayesian clustering using spike-and-slab hierarchical model, suitable for
clustering high-dimensional data
biclust algorithms to find bi-clusters in two-dimensional data
clue cluster ensembles
clues clustering method based on local shrinking
clValid validation of clustering results
clv cluster validation techniques, contains popular internal and external cluster
validation methods for outputs produced by package cluster
bayesclust tests/searches for significant clusters in genetic data
clustsig significant cluster analysis, tests to see which (if any) clusters are statis-
tically different
clusterSim search for optimal clustering procedure for a data set
clusterGeneration random cluster generation
gcExplorer graphical cluster explorer
hybridHclust hybrid hierarchical clustering via mutual clusters
Modalclust hierarchical modal Clustering
iCluster integrative clustering of multiple genomic data types
EMCC evolutionary Monte Carlo (EMC) methods for clustering
rEMM extensible Markov Model (EMM) for data stream clustering
Outlier Detection
Functions
boxplot.stats()$out list data points lying beyond the extremes of the
whiskers
lofactor() calculate local outlier factors using the LOF algorithm (DMwR
or dprep)
lof() a parallel implementation of the LOF algorithm (Rlof)
Packages
Rlof a parallel implementation of the LOF algorithm
extremevalues detect extreme values in one-dimensional data
mvoutlier multivariate outlier detection based on robust methods
outliers some tests commonly used for identifying outliers
Time Series Analysis
Construction & Plot
ts() create time-series objects
plot.ts() plot time-series objects
smoothts() time series smoothing (ast )
sfilter() remove seasonal fluctuation using moving average (ast )
Decomposition
decomp() time series decomposition by square-root filter (timsac)
decompose() classical seasonal decomposition by moving averages
stl() seasonal decomposition of time series by loess
tsr() time series decomposition (ast)
ardec() time series autoregressive decomposition (ArDec)
Forecasting
arima() fit an ARIMA model to a univariate time series
predict.Arima() forecast from models fitted by arima
auto.arima() fit best ARIMA model to univariate time series (forecast)
forecast.stl(), forecast.ets(), forecast.Arima()
forecast time series using stl, ets and arima models (forecast)
Correlation and Covariance
acf() autocovariance or autocorrelation of a time series
ccf() cross-correlation or cross-covariance of two univariate series
Packages
forecast displaying and analysing univariate time series forecasts
TSclust time series clustering utilities
dtw Dynamic Time Warping (DTW)
timsac time series analysis and control program
ast time series analysis
ArDec time series autoregressive-based decomposition
dse tools for multivariate, linear, time-invariant, time series models
Text Mining
Text Cleaning and Preparation
Corpus() build a corpus, which is a collection of text documents (tm)
tm map() transform text documents, e.g., stemming, stopword removal (tm)
tm filter() filtering out documents (tm)
TermDocumentMatrix(), DocumentTermMatrix() construct a
term-document matrix or a document-term matrix (tm)
Dictionary() construct a dictionary from a character vector or a term-
document matrix (tm)
stemDocument() stem words in a text document (tm)
stemCompletion() complete stemmed words (tm)
SnowballStemmer() Snowball word stemmers (Snowball)
stopwords(language) return stopwords in different languages (tm)
removeNumbers(), removePunctuation(), removeWords() re-
move numbers, punctuation marks, or a set of words from a text docu-
ment (tm)
removeSparseTerms() remove sparse terms from a term-document matrix (tm)
Frequent Terms and Association
findAssocs() find associations in a term-document matrix (tm)
findFreqTerms() find frequent terms in a term-document matrix (tm)
termFreq() generate a term frequency vector from a text document (tm)
Topic Modelling
LDA() fit a LDA (latent Dirichlet allocation) model (topicmodels)
CTM() fit a CTM (correlated topics model) model (topicmodels)
terms() extract the most likely terms for each topic (topicmodels)
topics() extract the most likely topics for each document (topicmodels)
Sentiment Analysis
polarity() polarity score (sentiment analysis) (qdap)
Text Categorization
textcat() n-gram based text categorization (textcat)
Text Visualizatoin
wordcloud() plot a word cloud (wordcloud)
comparison.cloud() plot a cloud comparing the frequencies of words
across documents (wordcloud)
commonality.cloud() plot a cloud of words shared across documents
(wordcloud)
Packages
tm a framework for text mining applications
topicmodels fit topic models with LDA and CTM
wordcloud various word clouds
lda fit topic models with LDA
wordnet an interface to the WordNet
RTextTools automatic text classification via supervised learning
qdap transcript analysis, text mining and natural language processing
tm.plugin.dc a plug-in for package tm to support distributed text mining
tm.plugin.mail a plug-in for package tm to handle mail
textir a suite of tools for inference about text documents and associated sentiment
tau utilities for text analysis
textcat n-gram based text categorization
Social Network Analysis and Graph Mining
Functions
graph(), graph.edgelist(), graph.adjacency(),
graph.incidence() create graph objects respectively from edges,
an edge list, an adjacency matrix and an incidence matrix (igraph)
plot(), tkplot(), rglplot() static, interactive and 3D plotting of
graphs (igraph)
gplot(), gplot3d() plot graphs (sna)
vcount(), ecount() number of vertices/edges (igraph)
V(), E() vertex/edge sequence of igraph (igraph)
is.directed() whether the graph is directed (igraph)
are.connected() check whether two nodes are connected (igraph)
degree(), betweenness(), closeness(), transitivity() various cen-
trality scores (igraph, sna)
add.edges(), add.vertices(), delete.edges(), delete.vertices()
add and delete edges and vertices (igraph)
neighborhood() neighborhood of graph vertices (igraph, sna)
get.adjlist() adjacency lists for edges or vertices (igraph)
nei(), adj(), from(), to() vertex/edge sequence indexing (igraph)
2
3. cliques(), largest.cliques(), maximal.cliques(), clique.number()
find cliques, ie. complete subgraphs (igraph)
clusters(), no.clusters() maximal connected components of a graph and
the number of them (igraph)
fastgreedy.community(), spinglass.community() community detection
(igraph)
cohesive.blocks() calculate cohesive blocks (igraph)
induced.subgraph() create a subgraph of a graph (igraph)
%->%, %<-%, %--% edge sequence indexing (igraph)
get.edgelist() return an edge list in a two-column matrix (igraph)
read.graph(), write.graph() read and writ graphs from and to files
of various formats (igraph)
Packages
igraph network analysis and visualization
sna social network analysis
statnet a set of tools for the representation, visualization, analysis and simulation
of network data
egonet ego-centric measures in social network analysis
snort social network-analysis on relational tables
network tools to create and modify network objects
bipartite visualising bipartite networks and calculating some (ecological) indices
blockmodelinggeneralized and classical blockmodeling of valued networks
diagram visualising simple graphs (networks), plotting flow diagrams
NetCluster clustering for networks
NetData network data for McFarland’s SNA R labs
NetIndices estimating network indices, including trophic structure of foodwebs
in R
NetworkAnalysis statistical inference on populations of weighted or unweighted
networks
tnet analysis of weighted, two-mode, and longitudinal networks
Spatial Data Analysis
Functions
geocode() geocodes a location using Google Maps (ggmap)
plotGoogleMaps() create a plot of spatial data on Google Maps (plot-
GoogleMaps)
qmap() quick map plot (ggmap)
get map() queries the Google Maps, OpenStreetMap, or Stamen Maps server
for a map at a certain location (ggmap)
gvisGeoChart(), gvisGeoMap(), gvisIntensityMap(),
gvisMap() Google geo charts and maps (googleVis)
GetMap() download a static map from the Google server (RgoogleMaps)
ColorMap() plot levels of a variable in a colour-coded map (RgoogleMaps)
PlotOnStaticMap() overlay plot on background image of map tile
(RgoogleMaps)
TextOnStaticMap() plot text on map (RgoogleMaps)
Packages
plotGoogleMaps plot spatial data as HTML map mushup over Google Maps
RgoogleMaps overlay on Google map tiles in R
ggmap Spatial visualization with Google Maps and OpenStreetMap
plotKML visualization of spatial and spatio-temporal objects in Google Earth
SGCS Spatial Graph based Clustering Summaries for spatial point patterns
spdep spatial dependence: weighting schemes, statistics and models
Statistics
Summarization
summary() summarize data
describe() concise statistical description of data (Hmisc)
boxplot.stats() box plot statistics
Analysis of Variance
aov() fit an analysis of variance model
anova() compute analysis of variance (or deviance) tables for one or more fitted
model objects
Statistical Tests
chisq.test() chi-squared contingency table tests and goodness-of-fit tests
ks.test() Kolmogorov-Smirnov tests
t.test() student’s t-test
prop.test() test of equal or given proportions
binom.test() exact binomial test
Mixed Effects Models
lme() fit a linear mixed-effects model (nlme)
nlme() fit a nonlinear mixed-effects model (nlme)
Principal Components and Factor Analysis
princomp() principal components analysis
prcomp() principal components analysis
Other Functions
var(), cov(), cor() variance, covariance, and correlation
density() compute kernel density estimates
Packages
nlme linear and nonlinear mixed effects models
Graphics
Functions
plot() generic function for plotting
barplot(), pie(), hist() bar chart, pie chart and histogram
boxplot() box-and-whisker plot
stripchart() one dimensional scatter plot
dotchart() Cleveland dot plot
qqnorm(), qqplot(), qqline() QQ (quantile-quantile) plot
coplot() conditioning plot
splom() conditional scatter plot matrices (lattice)
pairs() a matrix of scatterplots
cpairs() enhanced scatterplot matrix (gclus)
parcoord() parallel coordinate plot (MASS)
cparcoord() enhanced parallel coordinate plot (gclus)
parallelplot() parallel coordinates plot (lattice)
densityplot() kernel density plot (lattice)
contour(), filled.contour() contour plot
levelplot(), contourplot() level plots and contour plots (lattice)
smoothScatter() scatterplots with smoothed densities color representation;
capable of visualizing large datasets
sunflowerplot() a sunflower scatter plot
assocplot() association plot
mosaicplot() mosaic plot
matplot() plot the columns of one matrix against the columns of another
fourfoldplot() a fourfold display of a 2×2×k contingency table
persp() perspective plots of surfaces over the x?y plane
cloud(), wireframe() 3d scatter plots and surfaces (lattice)
interaction.plot() two-way interaction plot
iplot(), ihist(), ibar(), ipcp() interactive scatter plot, histogram, bar
plot, and parallel coordinates plot (iplots)
pdf(), postscript(), win.metafile(), jpeg(), bmp(),
png(), tiff() save graphs into files of various formats
gvisAnnotatedTimeLine(), gvisAreaChart(),
gvisBarChart(), gvisBubbleChart(),
gvisCandlestickChart(), gvisColumnChart(),
gvisComboChart(), gvisGauge(), gvisGeoChart(),
gvisGeoMap(), gvisIntensityMap(),
gvisLineChart(), gvisMap(), gvisMerge(),
gvisMotionChart(), gvisOrgChart(),
gvisPieChart(), gvisScatterChart(),
gvisSteppedAreaChart(), gvisTable(),
gvisTreeMap() various interactive charts produced with the Google
Visualisation API (googleVis)
gvisMerge() merge two googleVis charts into one (googleVis)
Packages
ggplot2 an implementation of the Grammar of Graphics
googleVis an interface between R and the Google Visualisation API to create
interactive charts
rCharts interactive javascript visualizations from R
lattice a powerful high-level data visualization system, with an emphasis on mul-
tivariate data
vcd visualizing categorical data
iplots interactive graphics
Data Manipulation
Functions
transform() transform a data frame
scale() scaling and centering of matrix-like objects
t() matrix transpose
aperm() array transpose
sample() sampling
table(), tabulate(), xtabs() cross tabulation
stack(), unstack() stacking vectors
split(), unsplit() divide data into groups and reassemble
reshape() reshape a data frame between “wide” and “long” format
merge() merge two data frames; similar to database join operations
aggregate() compute summary statistics of data subsets
by() apply a function to a data frame split by factors
melt(), cast() melt and then cast data into the reshaped or aggregated
form you want (reshape)
complete.cases() find complete cases, i.e., cases without missing values
na.fail, na.omit, na.exclude, na.pass handle missing values
Packages
reshape flexibly restructure and aggregate data
data.table extension of data.frame for fast indexing, ordered joins, assignment,
and grouping and list columns
gdata various tools for data manipulation
3
4. Data Access
Functions
save(), load() save and load R data objects
read.csv(), write.csv() import from and export to .CSV files
read.table(), write.table(), scan(), write() read and
write data
read.xlsx(), write.xlsx() read and write Excel files (xlsx)
read.fwf() read fixed width format files
write.matrix() write a matrix or data frame (MASS)
readLines(), writeLines() read/write text lines from/to a connection,
such as a text file
sqlQuery() submit an SQL query to an ODBC database (RODBC)
sqlFetch() read a table from an ODBC database (RODBC)
sqlSave(), sqlUpdate() write or update a table in an ODBC database
(RODBC)
sqlColumns() enquire about the column structure of tables (RODBC)
sqlTables() list tables on an ODBC connection (RODBC)
odbcConnect(), odbcClose(), odbcCloseAll() open/close con-
nections to ODBC databases (RODBC)
dbSendQuery execute an SQL statement on a given database connection (DBI)
dbConnect(), dbDisconnect() create/close a connection to a DBMS
(DBI)
Packages
RODBC ODBC database access
foreign read and write data in other formats, such as Minitab, S, SAS, SPSS,
Stata, Systat, ...
DBI a database interface (DBI) between R and relational DBMS
RMySQL interface to the MySQL database
RJDBC access to databases through the JDBC interface
RSQLite SQLite interface for R
ROracle Oracle database interface (DBI) driver
RpgSQL DBI/RJDBC interface to PostgreSQL database
RODM interface to Oracle Data Mining
xlsx read, write, format Excel 2007 and Excel 97/2000/XP/2003 files
xlsReadWrite read and write Excel files
WriteXLS create Excel 2003 (XLS) files from data frames
Web Data Access
Functions
download.file() download a file from the Internet
xmlParse(), htmlParse() parse an XML or HTML file (XML)
userTimeline(), homeTimeline(), mentions(),
retweetsOfMe() retrieve various timelines within the Twitter uni-
verse (twitteR)
searchTwitter() a search of Twitter based on a supplied search string (twit-
teR)
getUser(), lookupUsers() get information of Twitter users (twitteR)
getFollowers(), getFollowerIDs(), getFriends(),
getFriendIDs() get a list of followers/friends or their IDs of a
Twitter user (twitteR)
twListToDF() convert twitteR lists to data frames (twitteR)
Packages
twitteR an interface to the Twitter web API
RCurl general network (HTTP/FTP/...) client interface for R
XML reading and creating XML and HTML documents
MapReduce and Hadoop
Functions
mapreduce() define and execute a MapReduce job (rmr2)
keyval() create a key-value object (rmr2)
from.dfs(), to.dfs() read/write R objects from/to file system (rmr2)
Packages
rmr2 perform data analysis with R via MapReduce on a Hadoop cluster
rhdfs connect to the Hadoop Distributed File System (HDFS)
rhbase connect to the NoSQL HBase database
Rhipe R and Hadoop Integrated Processing Environment
RHive distributed computing via HIVE query
Segue Parallel R in the cloud using Amazon’s Elastic Map Reduce (EMR) engine
HadoopStreaming Utilities for using R scripts in Hadoop streaming
hive distributed computing via the MapReduce paradigm
rHadoopClient Hadoop client interface for R
Large Data
Functions
as.ffdf() coerce a dataframe to an ffdf (ff)
read.table.ffdf(), read.csv.ffdf() read data from a flat file to an ffdf
object (ff)
write.table.ffdf(), write.csv.ffdf() write an ffdf object to a flat file
(ff)
ffdfappend() append a dataframe or an ffdf to an existing ffdf (ff)
big.matrix() create a standard big.matrix, which is constrained to available
RAM (bigmemory)
read.big.matrix() create a big.matrix by reading from an ASCII file (big-
memory)
write.big.matrix() write a big.matrix to a file (bigmemory)
filebacked.big.matrix() create a file-backed big.matrix, which may ex-
ceed available RAM by using hard drive space (bigmemory)
mwhich() expanded “which”-like functionality (bigmemory)
Packages
ff memory-efficient storage of large data on disk and fast access functions
ffbase basic statistical functions for package ff
filehash a simple key-value database for handling large data
g.data create and maintain delayed-data packages
BufferedMatrix a matrix data storage object held in temporary files
biglm regression for data too large to fit in memory
bigmemory manage massive matrices with shared memory and memory-mapped
files
biganalytics extend the bigmemory package with various analytics
bigtabulate table-, tapply-, and split-like functionality for matrix and
big.matrix objects
Parallel Computing
Functions
sfInit(), sfStop() initialize and stop the cluster (snowfall)
sfLapply(), sfSapply(), sfApply() parallel versions of
lapply(), sapply(), apply() (snowfall)
foreach(...) %dopar% looping in parallel (foreach)
registerDoSEQ(), registerDoSNOW(), registerDoMC() register respec-
tively the sequential, SNOW and multicore parallel backend with the
foreach package (foreach, doSNOW, doMC)
Packages
snowfall usability wrapper around snow for easier development of parallel R
programs
snow simple parallel computing in R
multicore parallel processing of R code on machines with multiple cores or
CPUs
snowFT extension of snow supporting fault tolerant and reproducible applica-
tions, and easy-to-use parallel programming
Rmpi interface (Wrapper) to MPI (Message-Passing Interface)
rpvm R interface to PVM (Parallel Virtual Machine)
nws provide coordination and parallel execution facilities
foreach foreach looping construct for R
doMC foreach parallel adaptor for the multicore package
doSNOW foreach parallel adaptor for the snow package
doMPI foreach parallel adaptor for the Rmpi package
doParallel foreach parallel adaptor for the multicore package
doRNG generic reproducible parallel backend for foreach Loops
GridR execute functions on remote hosts, clusters or grids
fork R functions for handling multiple processes
Interface to Weka
Package RWeka is an R interface to Weka, and enables to use the following Weka
functions in R.
Association rules:
Apriori(), Tertius()
Regression and classification:
LinearRegression(), Logistic(), SMO()
Lazy classifiers:
IBk(), LBR()
Meta classifiers:
AdaBoostM1(), Bagging(), LogitBoost(), MultiBoostAB(),
Stacking(),
CostSensitiveClassifier()
Rule classifiers:
JRip(), M5Rules(), OneR(), PART()
Regression and classification trees:
J48(), LMT(), M5P(), DecisionStump()
Clustering:
Cobweb(), FarthestFirst(), SimpleKMeans(), XMeans(),
DBScan()
Filters:
Normalize(), Discretize()
Word stemmers:
IteratedLovinsStemmer(), LovinsStemmer()
Tokenizers:
AlphabeticTokenizer(), NGramTokenizer(), WordTokenizer()
Interface to Other Programming Languages
Functions
.jcall() call a Java method (rJava)
.jnew() create a new Java object (rJava)
.jinit() initialize the Java Virtual Machine (JVM) (rJava)
4
5. .jaddClassPath() adds directories or JAR files to the class path (rJava)
Packages
rJava low-level R to Java interface
Generating Reports
Functions
Sweave() mixing text and R/S code for automatic report generation
Packages
knitr a general-purpose package for dynamic report generation in R
R2HTML making HTML reports
R2PPT generating Microsoft PowerPoint presentations
Building GUIs and Web Applications
shiny web application framework for R
svDialogs dialog boxes
gWidgets a toolkit-independent API for building interactive GUIs
R Editors/GUIs
RStudio a free integrated development environment (IDE) for R
Tinn-R a free GUI for R language and environment
rattle graphical user interface for data mining in R
Rpad workbook-style, web-based interface to R
RPMG graphical user interface (GUI) for interactive R analysis sessions
Red-R An open source visual programming GUI interface for R
R AnalyticFlow a software which enables data analysis by drawing analysis
flowcharts
latticist a graphical user interface for exploratory visualisation
Other R Reference Cards
R Reference Card, by Tom Short
http://rpad.googlecode.com/svn-history/r76/Rpad_homepage/
R-refcard.pdf or
http://cran.r-project.org/doc/contrib/Short-refcard.pdf
R Reference Card, by Jonathan Baron
http://cran.r-project.org/doc/contrib/refcard.pdf
R Functions for Regression Analysis, by Vito Ricci
http://cran.r-project.org/doc/contrib/Ricci-refcard-regression.
pdf
R Functions for Time Series Analysis, by Vito Ricci
http://cran.r-project.org/doc/contrib/Ricci-refcard-ts.pdf
RDataMining Books
R and Data Mining: Examples and Case Studies
introduces into using R for data mining with examples and case studies.
http://www.rdatamining.com/books/rdm
Data Mining Applications with R
presents 15 real-world applications on data mining with R.
http://www.rdatamining.com/books/dmar
RDataMining Website, Group, Twitter & Package
RDataMining Website
http://www.rdatamining.com
RDataMining Group on LinkedIn (4000+ members)
http://group.rdatamining.com
RDataMining on Twitter (1400+ followers)
http://twitter.com/rdatamining
RDataMining Project on R-Forge
http://www.rdatamining.com/package
http://package.rdatamining.com
Comments & Feedback
If you have any comments, or would like to suggest any relevant R pack-
ages/functions, please feel free to email me <yanchang@rdatamining.com>.
Thanks.
5