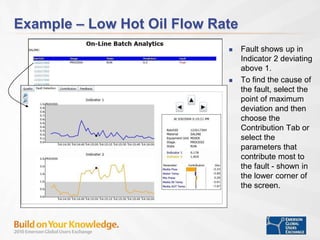
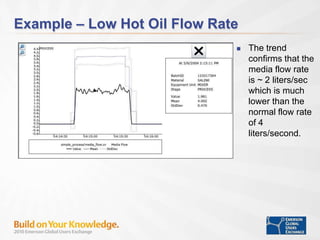
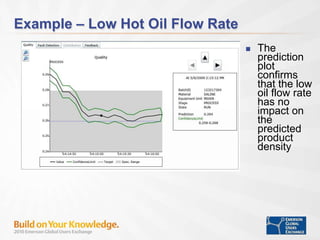
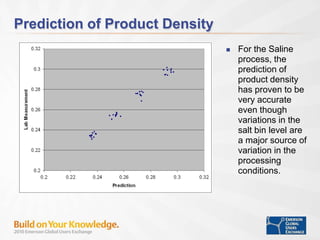
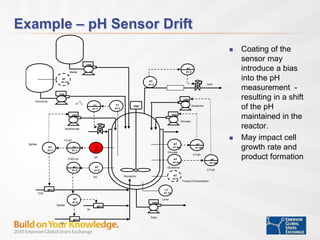
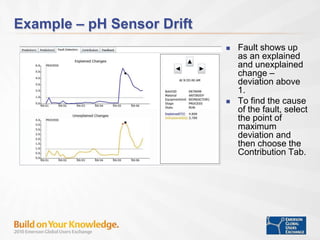
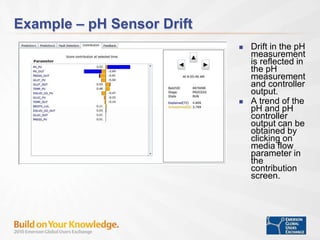
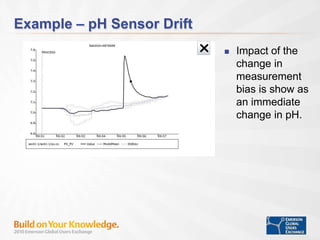
Data Analytic and Spectral
Analyzer
Bridging the Gap with On-line Analytics
 On-line Decision Support for Operations Personnel
– Product quality predictions
– Early process fault detection
 Embedded On-line Analytics brings quality information, fault
detection, and abnormal situation knowledge to the operator –
bridging the gap between quality and control.
 The PAT Guidelines issued by the FDA emphasized the use of
multivariate analytics as a means of reducing cost, improving
product quality in the pharmaceutical industry.
 On-line Data Analytics is targeted for DeltaV v12.
QUALITY CONTROL
Information at the Operator Interface
Analytic
Process
Models
Evaluation
process
operation
Process measurements, lab and Truck
analysis over last year
Calculated Feed Composition
Process
measurements
Operator Interface
Predicted End of Batch
Quality
Fault Detection
TT
207
TC
207
TT
206
TC
206
Coolant return
Bioreactor
RSP
AT
205AT
204
FC
203
FC
201
FT
201
Feed
e.g. Glucose
AC
204
Reagent
e.g. Ammonia
FC
202
FT
202
Air
pH
AC
205
Dissolved
Oxygen
Vent
PT
208
PC
208
RSP
Charge
e.g. Media
FT
203 Coolant
supply
IT
209
LT
210
To Harvest
TT
207
TC
207
TC
207
TT
206
TC
206
TC
206
Coolant return
Bioreactor
RSP
AT
205AT
204
FC
203
FC
203
FC
201
FC
201
FT
201
Feed
e.g. Glucose
AC
204
AC
204
Reagent
e.g. Ammonia
FC
202
FC
202
FT
202
Air
pH
AC
205
AC
205
Dissolved
Oxygen
Vent
PT
208
PC
208
PC
208
RSP
Charge
e.g. Media
FT
203 Coolant
supply
IT
209
LT
210
To Harvest
Storage Tank Design
Tank
Design 2
Tank
Design 1
Tank
Design 3
Storage Tank Design
Tank
Design 2
Tank
Design 1
Tank
Design 3
3 Step Monitoring Procedure
1. If either Fault Detection plot
exceeds or approaches the upper
control limit of 1.0, click on that
point in the trend and
-> Select the Parameter in the
lower corner of the screen that
contributed to the fault
2. Evaluate the parameter trends
from process operation standpoint
-> take corrective action if
necessary
3. Inspect impact of fault on quality
prediction plot to find out how
quality may be affected
Note: Use Up arrow to return to the
Analytics Overview.
If a fault is indicted in the analytics overview screen, then selecting the
batch number will bring up the Fault Detection view.
Analytics Overview
Quality Parameter Prediction
ContributionParameter Trend (s)
2
Fault Detection
31
Example – Low Hot Oil Flow Rate
 When the hot oil
valve is opened,
the flow rate is
much lower
than normal
 The lower flow
rate impacts the
time needed for
the mixer to
reach target
temperature –
extending batch
time
Example – Low Hot Oil Flow Rate
 Fault shows up in
Indicator 2 deviating
above 1.
 To find the cause of
the fault, select the
point of maximum
deviation and then
choose the
Contribution Tab or
select the
parameters that
contribute most to
the fault - shown in
the lower corner of
the screen.
Example – Low Hot Oil Flow Rate
 The trend
confirms that the
media flow rate
is ~ 2 liters/sec
which is much
lower than the
normal flow rate
of 4
liters/second.
Example – Low Hot Oil Flow Rate
 The
prediction
plot
confirms
that the low
oil flow rate
has no
impact on
the
predicted
product
density
Prediction of Product Density
 For the Saline
process, the
prediction of
product density
has proven to be
very accurate
even though
variations in the
salt bin level are
a major source of
variation in the
processing
conditions.
Example – pH Sensor Drift
O2
Bioreactor
VSD
VSD
TC
41-7
AT
41-4s2
AT
41-4s1
AT
41-2
TT
41-7
AT
41-6
LT
41-14
Glucose
Glutamine
pH
DO
Product Concentration
VSD
VSD
AC
41-4s1
AC
41-4s2
Media
Glucose
Glutamine
VSD
Bicarbonate
AY
41-1
AC
41-1
Splitter
AC
41-2
AY
41-2
Splitter
CO2
Air
Level
Drain
0.002 g/L
7.0 pH
2.0 g/L
2.0 g/L
37
o
C
VSD
Inoculums
VSD
PT
41-3 Vent
MFC
MFC
MFC
PC
41-3
AT
41-15
 Coating of the
sensor may
introduce a bias
into the pH
measurement -
resulting in a shift
of the pH
maintained in the
reactor.
 May impact cell
growth rate and
product formation
AT
41-1
Example – pH Sensor Drift
 Fault shows up
as an explained
and unexplained
change –
deviation above
1.
 To find the cause
of the fault, select
the point of
maximum
deviation and
then choose the
Contribution Tab.
Example – pH Sensor Drift
 Drift in the pH
measurement
is reflected in
the pH
measurement
and controller
output.
 A trend of the
pH and pH
controller
output can be
obtained by
clicking on
media flow
parameter in
the
contribution
screen.
Example – pH Sensor Drift
 Impact of the
change in
measurement
bias is show as
an immediate
change in pH.
Example – pH Sensor Drift
 Longer term the
faulty pH
measurement is
reflected in an
abnormally low
reagent addition
being used to
maintain the
indicated pH.
Learning More
A workshop is being offered at Emerson Exchange on
data analytics and field trail at Lubrizol, Rouen. The
schedule for this workshop is:
08-167 Batch Process Analytics (PA) – An In
Depth Update
– Tuesday, Room 206B, 10:00 AM
– Thursday, Room 206A, 11:00 AM
Spectral Analyzers
 Spectral analyzers may be used at critical
points throughout the process.
– Pharmaceutical - inspection of feedstock,
blend uniformity, granulation, drying and
coating and particle size analysis. Online
QA/QC tool for production.
– Chemical - acid value, adhesive content,
cure, melt index, and polymer processes -
reaction monitoring
– Refinery, petrochemical - fuel production
monitoring
 A wide variety of commercial on-line, at-line,
and laboratory spectral analyzers are
available.
 Calibration of an NIR analyzer is based on
use of spectral data to develop principal
component analysis(PCA) and projection of
latent structures (PLS) models.
Example: NIR Analyzers
 Careful development of a set of
calibration samples and their use
in PCA/PLS model development
is the basis for near-infrared
analytical methods.
 For purposes of analysis, the
spectral data for a sample
should be saved and accessed
as one set of data e.g. an
array.
 3-D plotting of spectral data can
be helpful in screening samples
and in analyzing on-line use of
spectral data.
Off-line PCA/
PLS Model
Development
On-line Quality
Parameter
Prediction
Historian
Array/Data Set
Application
station
NIR Analyzer
Controller
VIM
Interface
3-D Plot of
Spectral Data
Learning More
 The technical feasibility of providing 3-D plotting and historian
collection of array data has been explore and the value of such
a capability demonstrated in at a field trail conducted on an
absorber and stripper process unit at UT Pickle Research
Center, Austin, TX.
 Two presentations on this field trail are scheduled for Emerson
Exchange.
04-132 Process Analysis Using 3D plots
– Tuesday, 3:00:00 PM, Room 207B
– Thursday, 3:15:00 PM, Room 201

Data Analytics Spectral Analyzer

  • 1.
    Data Analytic andSpectral Analyzer
  • 2.
    Bridging the Gapwith On-line Analytics  On-line Decision Support for Operations Personnel – Product quality predictions – Early process fault detection  Embedded On-line Analytics brings quality information, fault detection, and abnormal situation knowledge to the operator – bridging the gap between quality and control.  The PAT Guidelines issued by the FDA emphasized the use of multivariate analytics as a means of reducing cost, improving product quality in the pharmaceutical industry.  On-line Data Analytics is targeted for DeltaV v12. QUALITY CONTROL
  • 3.
    Information at theOperator Interface Analytic Process Models Evaluation process operation Process measurements, lab and Truck analysis over last year Calculated Feed Composition Process measurements Operator Interface Predicted End of Batch Quality Fault Detection TT 207 TC 207 TT 206 TC 206 Coolant return Bioreactor RSP AT 205AT 204 FC 203 FC 201 FT 201 Feed e.g. Glucose AC 204 Reagent e.g. Ammonia FC 202 FT 202 Air pH AC 205 Dissolved Oxygen Vent PT 208 PC 208 RSP Charge e.g. Media FT 203 Coolant supply IT 209 LT 210 To Harvest TT 207 TC 207 TC 207 TT 206 TC 206 TC 206 Coolant return Bioreactor RSP AT 205AT 204 FC 203 FC 203 FC 201 FC 201 FT 201 Feed e.g. Glucose AC 204 AC 204 Reagent e.g. Ammonia FC 202 FC 202 FT 202 Air pH AC 205 AC 205 Dissolved Oxygen Vent PT 208 PC 208 PC 208 RSP Charge e.g. Media FT 203 Coolant supply IT 209 LT 210 To Harvest Storage Tank Design Tank Design 2 Tank Design 1 Tank Design 3 Storage Tank Design Tank Design 2 Tank Design 1 Tank Design 3
  • 4.
    3 Step MonitoringProcedure 1. If either Fault Detection plot exceeds or approaches the upper control limit of 1.0, click on that point in the trend and -> Select the Parameter in the lower corner of the screen that contributed to the fault 2. Evaluate the parameter trends from process operation standpoint -> take corrective action if necessary 3. Inspect impact of fault on quality prediction plot to find out how quality may be affected Note: Use Up arrow to return to the Analytics Overview. If a fault is indicted in the analytics overview screen, then selecting the batch number will bring up the Fault Detection view. Analytics Overview Quality Parameter Prediction ContributionParameter Trend (s) 2 Fault Detection 31
  • 5.
    Example – LowHot Oil Flow Rate  When the hot oil valve is opened, the flow rate is much lower than normal  The lower flow rate impacts the time needed for the mixer to reach target temperature – extending batch time
  • 6.
    Example – LowHot Oil Flow Rate  Fault shows up in Indicator 2 deviating above 1.  To find the cause of the fault, select the point of maximum deviation and then choose the Contribution Tab or select the parameters that contribute most to the fault - shown in the lower corner of the screen.
  • 7.
    Example – LowHot Oil Flow Rate  The trend confirms that the media flow rate is ~ 2 liters/sec which is much lower than the normal flow rate of 4 liters/second.
  • 8.
    Example – LowHot Oil Flow Rate  The prediction plot confirms that the low oil flow rate has no impact on the predicted product density
  • 9.
    Prediction of ProductDensity  For the Saline process, the prediction of product density has proven to be very accurate even though variations in the salt bin level are a major source of variation in the processing conditions.
  • 10.
    Example – pHSensor Drift O2 Bioreactor VSD VSD TC 41-7 AT 41-4s2 AT 41-4s1 AT 41-2 TT 41-7 AT 41-6 LT 41-14 Glucose Glutamine pH DO Product Concentration VSD VSD AC 41-4s1 AC 41-4s2 Media Glucose Glutamine VSD Bicarbonate AY 41-1 AC 41-1 Splitter AC 41-2 AY 41-2 Splitter CO2 Air Level Drain 0.002 g/L 7.0 pH 2.0 g/L 2.0 g/L 37 o C VSD Inoculums VSD PT 41-3 Vent MFC MFC MFC PC 41-3 AT 41-15  Coating of the sensor may introduce a bias into the pH measurement - resulting in a shift of the pH maintained in the reactor.  May impact cell growth rate and product formation AT 41-1
  • 11.
    Example – pHSensor Drift  Fault shows up as an explained and unexplained change – deviation above 1.  To find the cause of the fault, select the point of maximum deviation and then choose the Contribution Tab.
  • 12.
    Example – pHSensor Drift  Drift in the pH measurement is reflected in the pH measurement and controller output.  A trend of the pH and pH controller output can be obtained by clicking on media flow parameter in the contribution screen.
  • 13.
    Example – pHSensor Drift  Impact of the change in measurement bias is show as an immediate change in pH.
  • 14.
    Example – pHSensor Drift  Longer term the faulty pH measurement is reflected in an abnormally low reagent addition being used to maintain the indicated pH.
  • 15.
    Learning More A workshopis being offered at Emerson Exchange on data analytics and field trail at Lubrizol, Rouen. The schedule for this workshop is: 08-167 Batch Process Analytics (PA) – An In Depth Update – Tuesday, Room 206B, 10:00 AM – Thursday, Room 206A, 11:00 AM
  • 16.
    Spectral Analyzers  Spectralanalyzers may be used at critical points throughout the process. – Pharmaceutical - inspection of feedstock, blend uniformity, granulation, drying and coating and particle size analysis. Online QA/QC tool for production. – Chemical - acid value, adhesive content, cure, melt index, and polymer processes - reaction monitoring – Refinery, petrochemical - fuel production monitoring  A wide variety of commercial on-line, at-line, and laboratory spectral analyzers are available.  Calibration of an NIR analyzer is based on use of spectral data to develop principal component analysis(PCA) and projection of latent structures (PLS) models.
  • 17.
    Example: NIR Analyzers Careful development of a set of calibration samples and their use in PCA/PLS model development is the basis for near-infrared analytical methods.  For purposes of analysis, the spectral data for a sample should be saved and accessed as one set of data e.g. an array.  3-D plotting of spectral data can be helpful in screening samples and in analyzing on-line use of spectral data. Off-line PCA/ PLS Model Development On-line Quality Parameter Prediction Historian Array/Data Set Application station NIR Analyzer Controller VIM Interface 3-D Plot of Spectral Data
  • 18.
    Learning More  Thetechnical feasibility of providing 3-D plotting and historian collection of array data has been explore and the value of such a capability demonstrated in at a field trail conducted on an absorber and stripper process unit at UT Pickle Research Center, Austin, TX.  Two presentations on this field trail are scheduled for Emerson Exchange. 04-132 Process Analysis Using 3D plots – Tuesday, 3:00:00 PM, Room 207B – Thursday, 3:15:00 PM, Room 201