PAT Innovation, Christoph Herwig Vienna GBX LIVE
•
1 like•690 views

BIO Pharmaceutical Innovation Manufacturing Leaders’ Summit 2015 – Heathrow, UK An exclusive invite only networking summit; bringing together up to 150 decision makers from pharma manufacturing, operations, supply chain, packaging etc. showcasing an action packed 2 day programme conducted by some of the industries most prominent thought leaders and innovators from emerging, large to academic organisations in pharma manufacturing, operations and cGmp etc. www.pims.gb.com www.gbx.uk.com

Recommended
Recommended
More Related Content
What's hot
What's hot (8)
Viewers also liked
Similar to PAT Innovation, Christoph Herwig Vienna GBX LIVE
Similar to PAT Innovation, Christoph Herwig Vienna GBX LIVE (20)
More from GBX Summits
More from GBX Summits (20)
Recently uploaded
Recently uploaded (20)
PAT Innovation, Christoph Herwig Vienna GBX LIVE
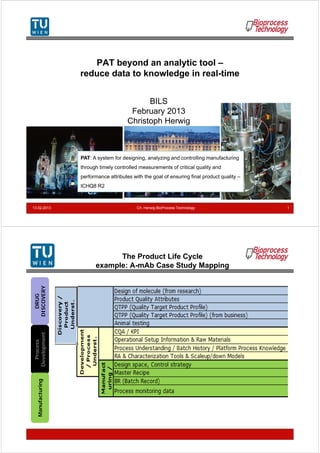
- 1. 13.02.2013 Ch. Herwig BioProcess Technology 1 PAT beyond an analytic tool – reduce data to knowledge in real-time BILS February 2013 Christoph Herwig PAT: A system for designing, analyzing and controlling manufacturing through timely controlled measurements of critical quality and performance attributes with the goal of ensuring final product quality – ICHQ8 R2 The Product Life Cycle example: A-mAb Case Study Mapping DRUG DISCOVERY Process Development Manufacturing
- 2. The Product Life Cycle Knowledge Management Tasks Knowledge Management Gap Analysis example: A-mAb Case Study Mapping http://www.ispe.org/ patcop/resources WHAT HOW WHY
- 3. Show Tools to Extend the PAT Definition to Knowledge Management I) Data from Analytical Devices II) Combination of Data for new Data III) Extract Information from Data and Control IV) Extract Knowledge from Information Manage Knowledge: Q10! 13.02.2013 Ch. Herwig BioProcess Technology 5 PAT: A system for designing, analyzing and controlling manufacturing through timely controlled measurements of critical quality and performance attributes with the goal of ensuring final product quality – ICHQ8 R2 13.02.2013 Ch. Herwig BioProcess Technology 6 I Data From Analytical Devices
- 4. Temporal resolution? What for? #1, #2 or #3? When was the final biomass reached? Low temporal resolution High temporal resolution Choose adequate temporal resolution! What happened in between? 13.02.2013 Ch. Herwig BioProcess Technology 7 13.02.2013 Ch. Herwig BioProcess Technology 8 Bioreactor process flow diagram for bioprocess development QIR N.N QIR N.N. QIR Gluc QIR EtOH QIR MeOH QIR Gly SIR M CW 220V MES; FIRCFIRC QIR O2 QIR R-OH QIR CO2 Gas Analyzer Figaro Waste Air PIRC Air HV1 HV3 HV2 CW MES; To Inactivation Collection FIRC MES; MEA; WIR MES; QIR MeOH QIR EtOH QIR HAc QIR FAc QIR FAl QIR AcAl Gas Chromatograph QIR MeOH QIR EtOH QIR Gly QIR Gluc QIR Sorb QIR N.N Enyzmatic Phomotric Robot FTIR Turbidity QIRC pH QIRC pO2 QIR Biomass QIR Biomass Capcit. QIR NADH Fluoresc. MEA; FIRC In-line On-line Off-line Feed 2 Feed 1 Base WIR WIR Steam Off-line WIRC orSeptum Indication Recording FIRC FI FIRC Control PIMS PIMS Local PIMS PIMS NONE PLS PIMS NONE LEGEND On-line On-line In-line
- 5. Online HPLC Metabolites, substrates, but also Product Quantitiy and Quality • 0.2 µm Filtration Probe • HPLC Setup RP-HPLC Column for Online Protein and Peptide Analytics Ion Exchange Collumn for Online small Metabolite and Substrate Quantification • 3D Autosampler • Flow Cell 13.02.2013 Ch. Herwig BioProcess Technology 9 Di-Electric Spectroscopy Capacitance • Capacitance as an indicator for morphological variations • Differentiate biomass aspects! A: Start exponential fed-batch phase B: Start linear induction fed-batch phase C: Effects of Induction Green: Ratio biomass / capacitance Purple: Feed profile Blue: Biomass Red: Capacitance 13.02.2013 Ch. Herwig BioProcess Technology 10
- 6. Continuous, inline morphological measurements for real-time morphological process monitoring Log Frequency [Hz] Capacitance [pF] Mean cell size Volume/Surface ratio Morphology Biomass concentration +++ - - - +++ - - - Real-time morphological analysis 13.02.2013 Ch. Herwig BioProcess Technology 11 on-line multiple component analysis for efficient bioprocess development raw data consistent for rate and yield calculation? quantitative bioprocess development Online Enzymatic Photometric Robot Dietzsch et al. Journal of Biotechnology, doi: 10.1016/j.jbiotec.2012.03.010 13.02.2013 Ch. Herwig BioProcess Technology 12
- 7. But Data are noisy and information is difficult to be extracted • Effect of noise on data, but even worse on information P. Wechselberger. C. Herwig, Biotechn Progr., 2011 13.02.2013 Ch. Herwig BioProcess Technology 13 Why Control Glucose Concentration in MAb Processes? • Glucose concentration impacts on specific antibody production rate • Glucose concentration impacts on metabolite formation rate • Glucose concentration impacts on MAb glycosylation pattern Glucose concentration is critical in respect to productivity and product quality! 13.02.2013 Ch. Herwig BioProcess Technology 14
- 8. Goal: Control of Glucose Concentration Incomplete Glycosylation, Quality Issues! X Low Productivity, High Lactate Production Process Performs Well X OK! Control of glucose concentration in a narrow range favourable! 13.02.2013 Ch. Herwig BioProcess Technology 15 Error Propagation on Control Strategies Fatal Decision Making on High Error Signals Error12%Error0% Optimal Parameters for 0% Error Optimal Parameters for 12% Error 13.02.2013 Ch. Herwig BioProcess Technology 16
- 9. 13.02.2013 Ch. Herwig BioProcess Technology 17 II Combining Data for New Data 17 Scope & Goal for Softsensor Development • Software solution for dynamically changing – Process conditions – Growth stoichiometry • Softsensor should be – Based on minimum prior knowledge – No need for training data sets – Generic; Valid for different hosts and process conditions – Easily adaptable from fed-batch to induced states Generic Prior Knowledge Accurate 13.02.2013 Ch. Herwig BioProcess Technology 18
- 10. Real-time Hybrid Exploitation based on first principle relationships 13.02.2013 Ch. Herwig BioProcess Technology 19 Off-line Process Monitoring Outputs: Concentrations: ci, x, p Substrates, Metabolites Products, Biomass Nucleotides, Proteome Internal components Tools: 13C labelled metabolite profile 2D- / µ-Array proteomics Stoichiometry Outputs: ri, Yj/i, µ, rp ci, x, p, Tools: Black Box, MFA Mass & Elemental Bal. Kinetic models Outputs: ri, Yj/i, µ, rp ci, x, p, Tools: Unstructured, Structured Segregated, etc. Observer Algorithms Outputs: ri, Yj/i, µ, rp ci, x, p, Tools: State Observer Ext. Kalman Filter Experiment Validation Outputs: Failure Detection Tools: Mass & Elemental Bal. Statistics PLSR Chemometrics DPCA Data Analysis Outputs: ci, x, p Tools: Statistics PLSR Chemometrics DPCA On-line Process Monitoring Outputs: Process controls Reaction parameters Rates: Offgas OUR, CER Concentrations: ci, x Substrates, Metabolites Products, Biomass Nucleotides Internal components Tools: On-line Sensors At-line Sensors Real-Time Off-line Off-line to running process Data Information Estimation of biomass concentration in induced bioprocesses • Rate based soft-sensors – No strain specific information necessary – Simple input variables (Off- gas analysis, feed flow rates) • Robust estimation of biomass concentration – even under induced conditions – yield coefficients are changing over time Sagmeister et al. 2013 Chemical Engineering Science submitted manuscript
- 11. 13.02.2013 Ch. Herwig BioProcess Technology 21 III Extract Information from Data and Control 21 Why is the conversion of Data to Information important? 13.02.2013 Ch. Herwig BioProcess Technology 22 0 0.02 0.04 0.06 0.08 0.1 0.12 0 0.5 1 1.5 2 2.5 3 3.5 4 0 2 4 6 8 10 12 14 16 HAc,AcetAl[g/l] EtOH[g/l] time [h] Dcrit SHIFTSHIFT--DOWNDOWN REDRED--OXOX OXOX DcritDcritDcrit SHIFTSHIFT--DOWNDOWN REDRED--OXOX OXOX -0.1 0 0.1 0.2 0.3 0.4 0.5 0.6 0 2 4 6 8 10 12 14 16 Yields[C-mol/C-mol] time [h] Raw Data can be misleading! Own method to quantify consistent rates in dynamic process conditions in real time Herwig, C, et.al.. 2001. On-line stoichiometry and identification of metabolic state in dynamic process conditions. Biotechnol. Bioeng. 75:345-354. DATA INFORMATION
- 12. Concept of physiological and mechanistic understanding Process Process Parameters Product Physiological Assessment Rates/Yields Sagmeister et.at. PDA Journal, 2012 13.02.2013 Ch. Herwig BioProcess Technology 23 Multivariate understanding of recombinant protein production using specific rates • Combine raw data to scalable entities • Use of specific entities for knowledge extraction 24 Feed-Profiles Biomass [g/L] / = Specific rate of substrate uptake qs [g/g/h]
- 13. Kalman Filter Closed Loop Control Strategy PIMS Simatic PCS 7 Box 13.02.2013 Ch. Herwig BioProcess Technology 25 Induced P. pastoris fed-batch with methanol as C-source On-line Performance of Closed Loop Controller Demonstration of Kalman closed-loop control of the specific substrate uptake rate qs in induced P. Pastoris fed-batch process qs from Kalman Filter qs setpoint qs calculated from off-line data 13.02.2013 Ch. Herwig BioProcess Technology 26
- 14. Comparison of developed modules Highest variance in off-line estimation, lowest variance in tools that use reconciliation Comparison based on three individual fermentation runs for all three devices 13.02.2013 Ch. Herwig BioProcess Technology 28 IV Extract Knowledge from Information 28
- 15. Current Solution: „How“ but not „Why“ CPPs k=-0.007 k=0 k=+0.007 T=20°CT=27.5°CT=35°C Specific Activity [kU/gbiomass] Induction Phase Temperature [°C] Induction Phase Feeding Exponent k 13.02.2013 Ch. Herwig BioProcess Technology 29 Knowledge Data CPPs CQA Multivariate understanding of recombinant protein production using specific rates • Combine raw data to scalable entities • Use of specific entities for knowledge extraction 30 Feed-Profiles Biomass [g/L] / = Specific rate of substrate uptake qs [g/g/h]
- 16. Reduction of development time: Integration of physiological factors in DoE Usual feed profile design Physiological feed profile design Careful selection of physiological factors for the design of the DoE significantly reduces number of experiments Physiological factors allow mechanistic understanding of expression system and build up platform knowledge Reduced factors as based on specific substrate uptake rate Wechselberger, P., Sagmeister, P., Engelking, H., Schmidt, T., Wenger, J., Herwig, C., (2012) Bioprocess and Biosystems Engineering 13.02.2013 Ch. Herwig BioProcess Technology 31 13.02.2013 Ch. Herwig BioProcess Technology 32 Stress analysis ensures robustness for scale up: On-line analysis of key regulations using specific parameters and metabolic modeling qox.phos O2, NADH qEtOH qferm qHAc qcat, ox qcat qana CO2 CO2, NADH Pyr HAc EtOH AcAl CO2, NADH Glc X NADH qglc NADH NADH qox.phos O2, NADH qEtOH qferm qHAc qcat, ox qcat qana CO2 CO2, NADH Pyr HAc EtOH AcAl CO2, NADH Glc X NADH qglc NADH NADH qEtOH qferm qHAc qcat, ox qcat qana CO2 CO2, NADH Pyr HAc EtOH AcAl CO2, NADH Glc X NADH qglc NADH NADH 20 30 40 50 60 70 80 90 100 5 5.5 6 6.5 7 7.5 q cat , q glc , q ana [mmol glc /mol X /h] q O2 [mmol/g X /h] q glucoseq catq ana q ox phos 0 0.1 0.2 0.3 0.4 0.5 2 4 6 8 10 12 0 4 8 12 16 20 Glc[g/l] Biomass[g/l],q o2 ,q co2 [mmol/g/h] time [h] phase i) phase ii) phase iii) 0 0.05 0.1 0.15 0.2 0.25 0.3 0.35 0.4 0 0.5 1 1.5 2 2.5 3 0 5 10 15 20 AcetAl[g/l] EtOH,HAc[g/l] time [h] Herwig, C, von Stockar, U. 2002. A small metabolic flux model to identify transient metabolic regulations in S. cerevisiae. Bioprocess Biosyst. Eng. 24:395- 403
- 17. Well Controlled Cultivations Execution of the knowledge generation cycle G6P S7P E4P R5P F6P G3P GLC his RNA phen trp tyr 3PG cys glc ser RNA PEP PYR AcCoAmit ala ileu leu val phen trp tyr leu AKG OAAasn asp ileu met thr RNA arg glum glut lys pro POLY ACET HAC ETOH 1-C NADH NADPH GOH AA LIPID RNA BIOMASS POLY O AcCoAcyt SUC NADH cyt NADHmit NADPHcyt NADPHmit LIPID lys PYR OAA AcCoAmit AcCoAcyt NADPH -2 -1 0 1 2 3 4 5 -5 0 5 1 0 1 5 2 0 2 5 -1 0 1 2 3 -5 0 5 1 0 1 5 2 0 2 5 -1 0 1 2 3 4 -5 0 5 1 0 1 5 2 0 2 5 -0.5 0 0.5 1 1 .5 -5 0 5 1 0 1 5 2 0 2 5 -0.1 0 0.1 0.2 0.3 -5 0 5 1 0 1 5 2 0 2 5 -0.04 -0.02 0 0.02 0.04 0.06 0.08 -5 0 5 1 0 1 5 2 0 2 5 -2 0 2 4 6 8 -5 0 5 1 0 1 5 2 0 2 5 -2 0 2 4 6 8 -5 0 5 1 0 1 5 2 0 2 5 -1 0 1 2 3 4 5 -5 0 5 1 0 1 5 2 0 2 5 -2 0 2 4 6 8 -5 0 5 1 0 15 2 0 25 -0.2 0 0.2 0.4 0.6 0.8 -5 0 5 1 0 1 5 2 0 2 5 -2 -1 0 1 2 3 -5 0 5 1 0 15 2 0 25 -1 0 1 2 3 4 -5 0 5 10 1 5 20 2 5 -0.5 0 0.5 1 1.5 2 -5 0 5 10 1 5 20 2 5 -0.2 -0.1 0 0.1 0.2 0.3 0.4 0.5 -5 0 5 10 1 5 20 2 5 -2 -1 0 1 2 3 -5 0 5 1 0 15 2 0 25 -1 .5 -1 -0.5 0 0.5 1 1 .5 2 2 .5 -5 0 5 1 0 15 2 0 25 -1.5 -1 -0.5 0 0.5 1 1.5 2 -5 0 5 1 0 1 5 2 0 2 5 -0.2 0 0.2 0.4 0.6 -5 0 5 10 1 5 20 2 5 -10 -5 0 5 10 1 5 20 -5 0 5 10 15 20 25 -4 -2 0 2 4 6 8 -5 0 5 1 0 15 2 0 25 -2 -1 0 1 2 3 -5 0 5 1 0 15 2 0 25 -0.5 0 0.5 1 1 .5 -5 0 5 1 0 15 2 0 25 -0.04 -0.02 0 0.02 0.04 0.06 0.08 -5 0 5 10 15 20 25 -5 0 5 1 0 1 5 -5 0 5 1 0 15 2 0 25 -2 -1 0 1 2 3 4 5 6 -5 0 5 1 0 15 2 0 25 -0.02 0 0.02 0.04 0.06 -5 0 5 1 0 15 2 0 25 -1 .5 -1 -0.5 0 0.5 1 1 .5 2 2 .5 -5 0 5 1 0 15 2 0 25 0.00 20.00 40.00 60.00 80.00 1 00.00 -5 0 5 10 1 5 20 2 5 QIR N.N QIR N.N. QIR Gluc QIR EtOH QIR MeOH QIR Gly SIR M CW 220V MES; FIRCFIRC QIR O2 QIR R-OH QIR CO2 Gas Analyzer Figaro Waste Air PIRC Air HV1 HV3 HV2 CW MES; To Inactivation Collection FIRC MES; MEA; WIR MES; QIR MeOH QIR EtOH QIR HAc QIR FAc QIR FAl QIR AcAl Gas Chromatograph QIR MeOH QIR EtOH QIR Gly QIR Gluc QIR Sorb QIR N.N Enyzmatic Phomotric Robot FTIR Turbidity QIRC pH QIRC pO2 QIR Biomass QIR Biomass Capcit. QIR NADH Fluoresc. MEA; FIRC In-line On-line Off-line Feed 2 Feed 1 Base WIR WIR Steam Off-line WIRC orSe ptu m Indication Recording FIRC FI FIRC Control PIMS PIMS Local PIMS PIMS NONE PLS PIMS NONE LEGEND On-line On-line In-line Knowledge Generation Tools • Multivariate Regression • Metabolic Flux Modelling Dynamic Pertubations • Scale Down Models • Advanced Feeding Regimes Efficient & Scalable Time (h)Time (h) D (hD (h--11)) 0 Time (h)Time (h)0 Dcrit SHIFTSHIFT--DOWNDOWN REDRED--OXOX OXOX Dcrit SHIFTSHIFT--UPUP OXOX REDRED--OXOX Dcrit SHIFTSHIFT--UPUP OXOX OXOX PULSEPULSE glucoseglucose < 0.004 h-2 Dcrit AA--statstat-- OXOX REDRED--OXOX < 0.004 h-2 Dcrit AA--statstat-- REDRED--OXOX OXOX Time (h)Time (h) D (hD (h--11)) 0 Time (h)Time (h)0 Dcrit SHIFTSHIFT--DOWNDOWN REDRED--OXOX OXOX DcritDcritDcrit SHIFTSHIFT--DOWNDOWN REDRED--OXOX OXOX Dcrit SHIFTSHIFT--UPUP OXOX REDRED--OXOX DcritDcritDcrit SHIFTSHIFT--UPUP OXOX REDRED--OXOX Dcrit SHIFTSHIFT--UPUP OXOX OXOX DcritDcritDcrit SHIFTSHIFT--UPUP OXOX OXOX PULSEPULSE glucoseglucose PULSEPULSE glucoseglucose < 0.004 h-2 Dcrit AA--statstat-- OXOX REDRED--OXOX < 0.004 h-2 Dcrit < 0.004 h-2 Dcrit < 0.004 h-2 Dcrit AA--statstat-- OXOX REDRED--OXOX < 0.004 h-2 Dcrit AA--statstat-- REDRED--OXOX OXOX < 0.004 h-2 Dcrit AA--statstat-- REDRED--OXOX OXOX 13.02.2013 Ch. Herwig BioProcess Technology 33 13.02.2013 Ch. Herwig BioProcess Technology 34 Conclusions 34
- 18. Current Coverage Information-Management Knowledge-Management Collectdata Storedata Organizedata Structuredata Convertdata toinformation Investigate Modeling/ (Re-)Design Monitoringfor continous improvement Product-and process- design Siemens / SIPAT AEGIS / Discoverant S-Matrix Umetrics Modde/Simca 4Tune Exputec Very little functionality complete functionality Strategy to transfer data from process development to manufacturing 13.02.2013 Ch. Herwig BioProcess Technology 36 Process Development Manufacturing Scaleup Accuracy Frequency raw data rates vol. rates specific rates g/g/h Independent from scale & initial conditions Process Control CPP Process Understanding
- 19. Tools to Extend the PAT Definition to Knowledge Management I) Data from Analytical Devices II) Combination of Data for new Data III) Extract Information from Data and Control IV) Extract Knowledge from Information Manage Knowledge: Q10! 13.02.2013 Ch. Herwig BioProcess Technology 37 Bioprocess Development: Data Quality! Softsensors: Inexpensive, High quality, Increases process transparency! Data Reduction, Platform knowledge Transferable Less Experiments Mechanistic knowledge Scalable! Standards, across phases and products! Establish business process Thank you for your attention! Univ.Prof. Dr. Christoph Herwig Vienna University of Technology Institute of Chemical Engineering Research Division Biochemical Engineering Gumpendorferstrasse 1a/ 166 - 4 A-1060 Wien Austria emailto: christoph.herwig@tuwien.ac.at Tel (Office): +43 1 58801 166400 Tel (Mobile): +43 676 47 37 217 Fax: +43 1 58801 166980 URL : http://institute.tuwien.ac.at/chemical_engineering/bioprocess_engineering/EN/ 13.02.2013 Ch. Herwig BioProcess Technology 38 https://www.facebook.com/BioVTatTUWien