Download as PDF, PPTX

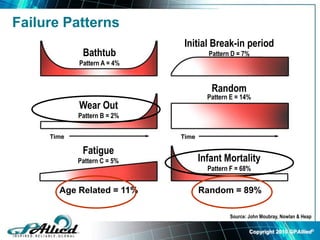
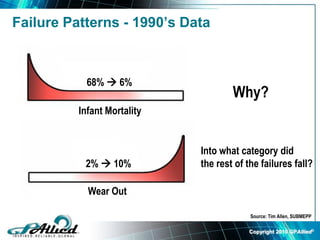
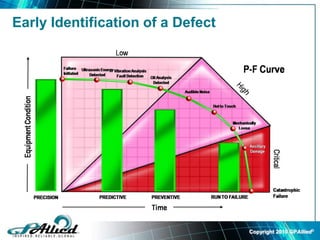
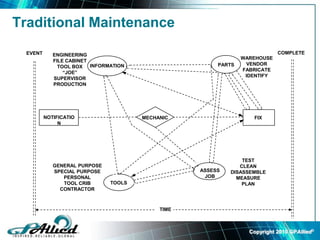
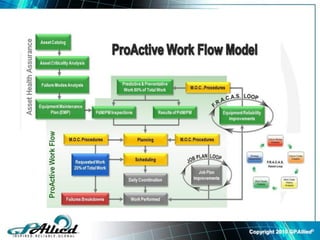
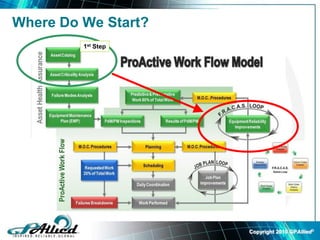
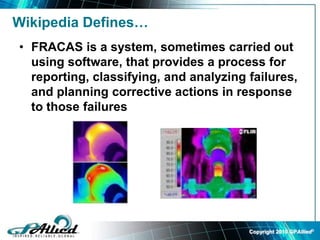
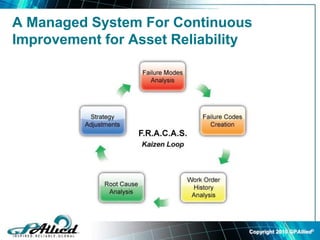
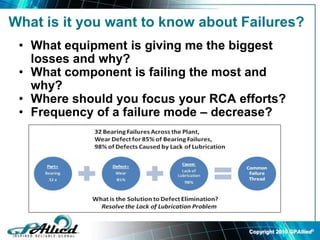
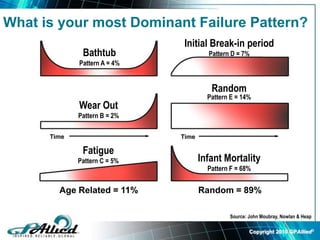
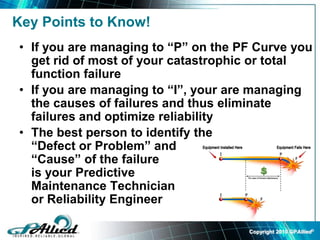
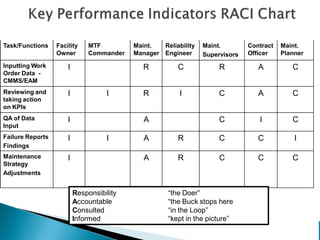
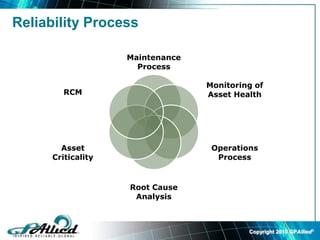
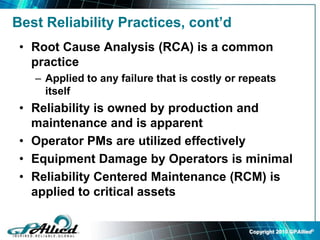
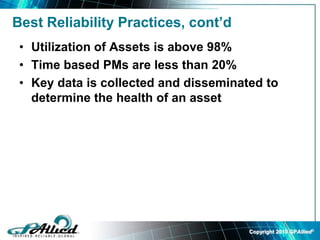
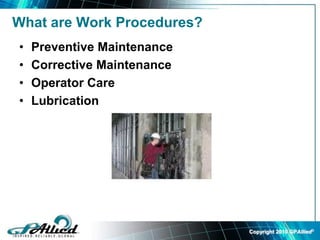
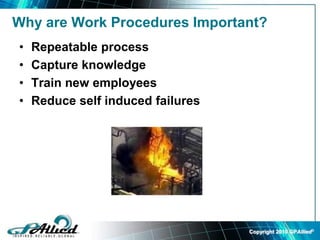
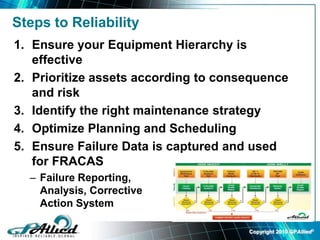

This document contains a summary of a presentation on best practices in maintenance and reliability by Ricky Smith. It discusses key topics like reliability definitions, failure patterns, predictive maintenance, FRACAS systems, and reliability metrics. It emphasizes that most equipment failures are self-induced due to issues like improper installation, maintenance, or lubrication. It also outlines steps for improving reliability like prioritizing assets, identifying maintenance strategies, and using failure data for continuous improvement. The goal is to move from reactive to proactive maintenance through practices like condition monitoring and root cause analysis.