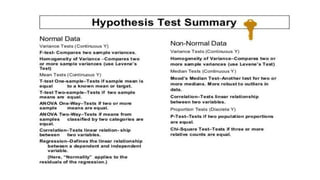
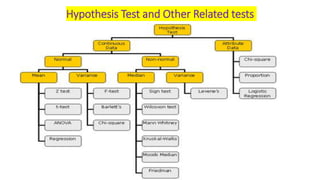
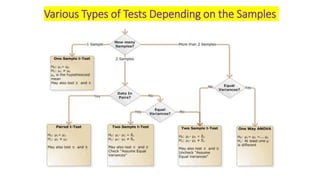
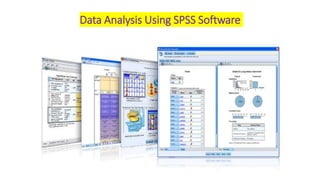
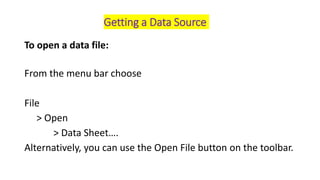
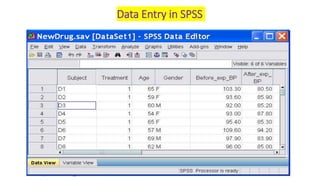
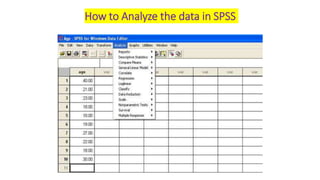
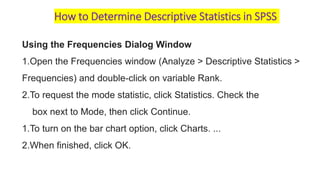
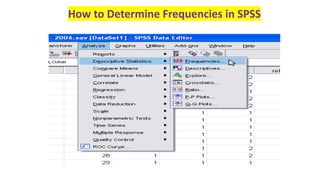
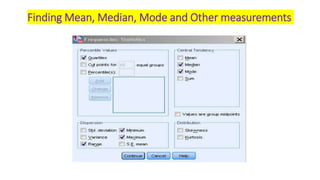
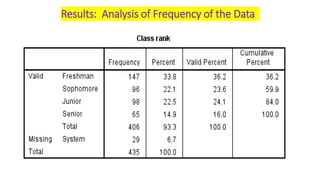
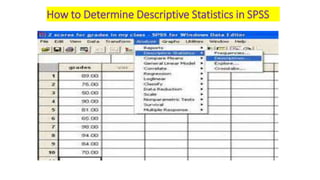
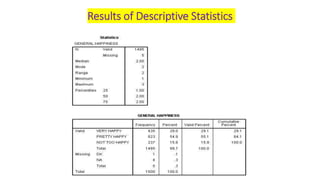
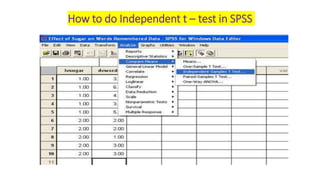
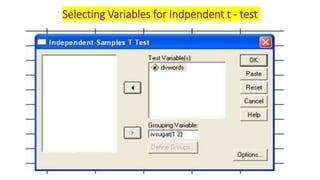
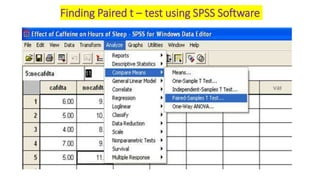
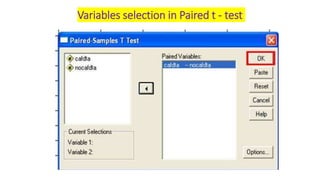
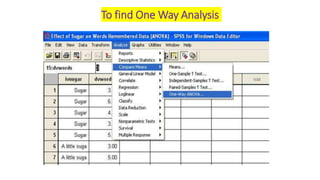
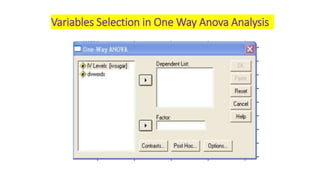
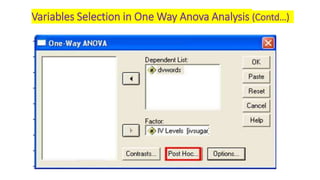
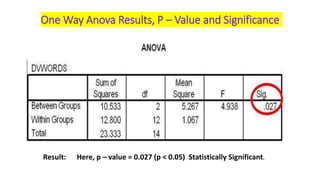
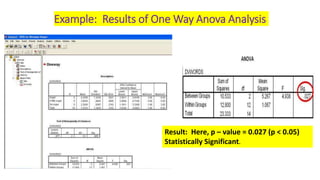
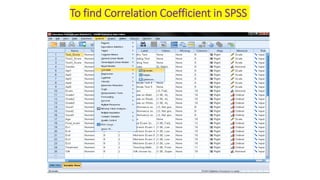
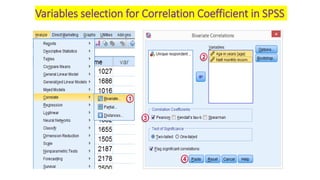
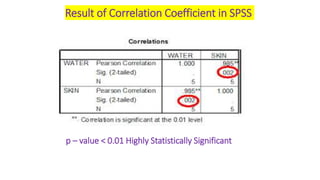
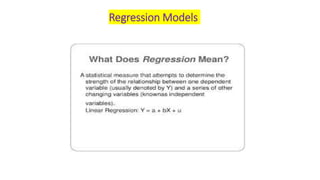
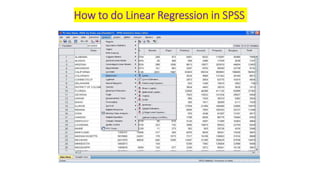
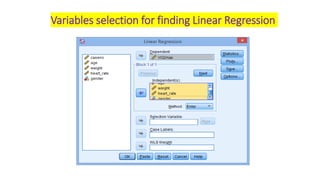
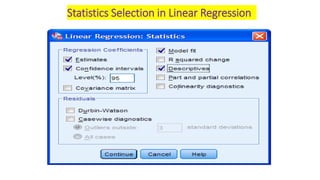
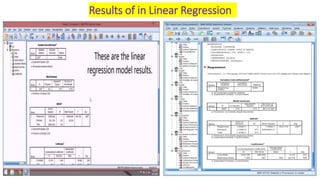
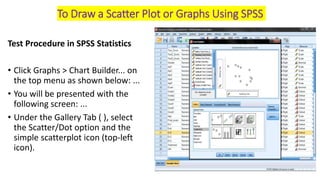
Data Analysis and Working on SPSS
Dr. Senthilvel Vasudevan, M.Sc., M.Phil., DST., PGDBS., Ph. D,
Lecturer in Pharmacy (Biostatistics),
Dept. of Pharmacy Practice,
College of Pharmacy,
KSAU-HS,
Riyadh, Saudi Arabia.
Research Methodology II (CAMS 412)
Lecture: 6
Date: 23/10/2016
Characteristics of a Normal Distribution
• About 68% of values drawn from
a normal distribution are within
one standard deviation σ away
from the mean.
• About 95% of the values lie
within two standard deviations
• About 99.7% are within three
standard deviations.
• This fact is known as the 68-95-
99.7 (empirical) rule, or the 3-
sigma rule.
Normal Distribution and Standard Deviations
Critical Region and Confident Region
Normal Curve
95% C.I
Level of Significant 5%
Ho – Null Hyp.
H1 – Alt. Hyp.
Hypothesis Test and Other Related tests
Various Types of Tests Depending on the Samples
Data Analysis Using SPSS Software
SPSS Data Editor Window
When you start a session, you see the
Data Editor Window.
• Before you can analyze, you need some data to analyze.
Getting a Data Source
To open a data file:
From the menu bar choose
File
> Open
> Data Sheet….
Alternatively, you can use the Open File button on the toolbar.
Data Entry in SPSS
How to Analyze the data in SPSS
How to Determine Descriptive Statistics in SPSS
Using the Frequencies Dialog Window
1.Open the Frequencies window (Analyze > Descriptive Statistics >
Frequencies) and double-click on variable Rank.
2.To request the mode statistic, click Statistics. Check the
box next to Mode, then click Continue.
1.To turn on the bar chart option, click Charts. ...
2.When finished, click OK.
How to Determine Frequencies in SPSS
Finding Mean, Median, Mode and Other measurements
Results: Analysis of Frequency of the Data
How to Determine Descriptive Statistics in SPSS
Results of Descriptive Statistics
How to do Independent t – test in SPSS
Selecting Variables for Indpendent t - test
Finding Paired t – test using SPSS Software
Variables selection in Paired t - test
To find One Way Analysis
Variables Selection in One Way Anova Analysis
Variables Selection in One Way Anova Analysis (Contd…)
One Way Anova Results, P – Value and Significance
Result: Here, p – value = 0.027 (p < 0.05) Statistically Significant.
Example: Results of One Way Anova Analysis
Result: Here, p – value = 0.027 (p < 0.05)
Statistically Significant.
To find Correlation Coefficient in SPSS
Variables selection for Correlation Coefficient in SPSS
p – value < 0.01 Highly Statistically Significant
Result of Correlation Coefficient in SPSS
Regression Models
How to do Linear Regression in SPSS
Variables selection for finding Linear Regression
Statistics Selection in Linear Regression
Results of in Linear Regression
Linear
Mixed
Models
Test Procedure in SPSS Statistics
• Click Graphs > Chart Builder... on
the top menu as shown below: ...
• You will be presented with the
following screen: ...
• Under the Gallery Tab ( ), select
the Scatter/Dot option and the
simple scatterplot icon (top-left
icon).
To Draw a Scatter Plot or Graphs Using SPSS
Scatter Plot or Graphs for Many Values Using SPSS
Thanks to all

Data analysis and working on spss

  • 1.
    Data Analysis andWorking on SPSS Dr. Senthilvel Vasudevan, M.Sc., M.Phil., DST., PGDBS., Ph. D, Lecturer in Pharmacy (Biostatistics), Dept. of Pharmacy Practice, College of Pharmacy, KSAU-HS, Riyadh, Saudi Arabia. Research Methodology II (CAMS 412) Lecture: 6 Date: 23/10/2016
  • 2.
    Characteristics of aNormal Distribution
  • 4.
    • About 68%of values drawn from a normal distribution are within one standard deviation σ away from the mean. • About 95% of the values lie within two standard deviations • About 99.7% are within three standard deviations. • This fact is known as the 68-95- 99.7 (empirical) rule, or the 3- sigma rule. Normal Distribution and Standard Deviations
  • 5.
    Critical Region andConfident Region Normal Curve 95% C.I Level of Significant 5% Ho – Null Hyp. H1 – Alt. Hyp.
  • 8.
    Hypothesis Test andOther Related tests
  • 9.
    Various Types ofTests Depending on the Samples
  • 10.
    Data Analysis UsingSPSS Software
  • 11.
    SPSS Data EditorWindow When you start a session, you see the Data Editor Window. • Before you can analyze, you need some data to analyze.
  • 12.
    Getting a DataSource To open a data file: From the menu bar choose File > Open > Data Sheet…. Alternatively, you can use the Open File button on the toolbar.
  • 13.
  • 14.
    How to Analyzethe data in SPSS
  • 15.
    How to DetermineDescriptive Statistics in SPSS Using the Frequencies Dialog Window 1.Open the Frequencies window (Analyze > Descriptive Statistics > Frequencies) and double-click on variable Rank. 2.To request the mode statistic, click Statistics. Check the box next to Mode, then click Continue. 1.To turn on the bar chart option, click Charts. ... 2.When finished, click OK.
  • 16.
    How to DetermineFrequencies in SPSS
  • 17.
    Finding Mean, Median,Mode and Other measurements
  • 18.
    Results: Analysis ofFrequency of the Data
  • 19.
    How to DetermineDescriptive Statistics in SPSS
  • 20.
  • 21.
    How to doIndependent t – test in SPSS
  • 22.
    Selecting Variables forIndpendent t - test
  • 23.
    Finding Paired t– test using SPSS Software
  • 24.
    Variables selection inPaired t - test
  • 25.
    To find OneWay Analysis
  • 26.
    Variables Selection inOne Way Anova Analysis
  • 27.
    Variables Selection inOne Way Anova Analysis (Contd…)
  • 28.
    One Way AnovaResults, P – Value and Significance Result: Here, p – value = 0.027 (p < 0.05) Statistically Significant.
  • 29.
    Example: Results ofOne Way Anova Analysis Result: Here, p – value = 0.027 (p < 0.05) Statistically Significant.
  • 30.
    To find CorrelationCoefficient in SPSS
  • 31.
    Variables selection forCorrelation Coefficient in SPSS
  • 32.
    p – value< 0.01 Highly Statistically Significant Result of Correlation Coefficient in SPSS
  • 33.
  • 34.
    How to doLinear Regression in SPSS
  • 35.
    Variables selection forfinding Linear Regression
  • 36.
    Statistics Selection inLinear Regression
  • 37.
    Results of inLinear Regression
  • 38.
  • 39.
    Test Procedure inSPSS Statistics • Click Graphs > Chart Builder... on the top menu as shown below: ... • You will be presented with the following screen: ... • Under the Gallery Tab ( ), select the Scatter/Dot option and the simple scatterplot icon (top-left icon). To Draw a Scatter Plot or Graphs Using SPSS
  • 40.
    Scatter Plot orGraphs for Many Values Using SPSS
  • 41.