INTRO TO STATISTICS
INTRO TO SPSS INTERFACE
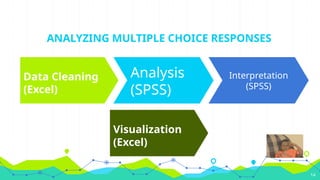
CLEANING MULTIPLE CHOICE RESPONSE DATA WITH EXCEL
ANALYZING MULTIPLE CHOICE RESPONSE DATA
INTERPRETATION
Q & A SESSION
PRACTICAL HANDS-ON ACTIVITY
Basics of Statistical
Analysiswith SPSS:
Handling Multiple-Choice
Data
April 25th
, 2025
FORTUNE EFFIONG
Rising Scholars National Research Hub, Nigeria
2.
WHAT WILL BECOVERED IN THIS WORKSHOP
1. INTRO TO STATISTICS
2. INTRO TO SPSS INTERFACE
3. CLEANING MULTIPLE CHOICE RESPONSE DATA WITH EXCEL
4. ANALYZING MULTIPLE CHOICE RESPONSE DATA
5. INTERPRETATION
6. Q & A SESSION
7. PRACTICAL HANDS-ON ACTIVITY
2
Data Analytics andDDDM?
◉ Data-driven decision-making (DDDM) is the process
of using data to inform your decision-making
process and validate a course of action before
committing to it.
◉ Data analytics refers to the process and practice
of analyzing data to answer questions, extract
insights, and identify trends.
◉ The main goal of data analytics is to extract
meaningful insights from data that an organization
can use to inform its strategy and, ultimately, reach
its objectives. 4
5.
Types of DataAnalytics
◉ Descriptive Analytics – "What happened?“
◉ Diagnostic Analytics – "Why did it happen?“
◉ Predictive Analytics – "What could happen?“
◉ Prescriptive Analytics – "What should we do?"
5
6.
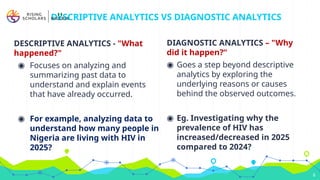
DESCRIPTIVE ANALYTICS -"What
happened?"
◉ Focuses on analyzing and
summarizing past data to
understand and explain events
that have already occurred.
◉ For example, analyzing data to
understand how many people in
Nigeria are living with HIV in
2025?
DESCRIPTIVE ANALYTICS VS DIAGNOSTIC ANALYTICS
DIAGNOSTIC ANALYTICS – "Why
did it happen?“
◉ Goes a step beyond descriptive
analytics by exploring the
underlying reasons or causes
behind the observed outcomes.
◉ Eg. Investigating why the
prevalence of HIV has
increased/decreased in 2025
compared to 2024?
6
7.
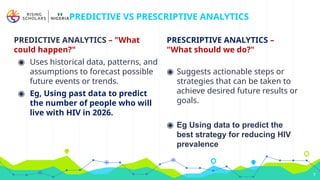
PREDICTIVE ANALYTICS –"What
could happen?"
◉ Uses historical data, patterns, and
assumptions to forecast possible
future events or trends.
◉ Eg, Using past data to predict
the number of people who will
live with HIV in 2026.
PREDICTIVE VS PRESCRIPTIVE ANALYTICS
PRESCRIPTIVE ANALYTICS –
"What should we do?"
◉ Suggests actionable steps or
strategies that can be taken to
achieve desired future results or
goals.
◉ Eg Using data to predict the
best strategy for reducing HIV
prevalence
7
8.
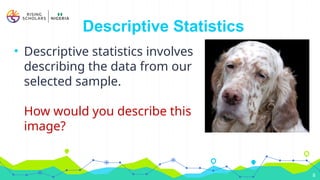
• Descriptive statisticsinvolves
describing the data from our
selected sample.
How would you describe this
image?
8
Descriptive Statistics
9.
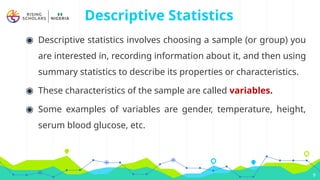
Descriptive Statistics
◉ Descriptivestatistics involves choosing a sample (or group) you
are interested in, recording information about it, and then using
summary statistics to describe its properties or characteristics.
◉ These characteristics of the sample are called variables.
◉ Some examples of variables are gender, temperature, height,
serum blood glucose, etc.
9
10.
Descriptive Statistics
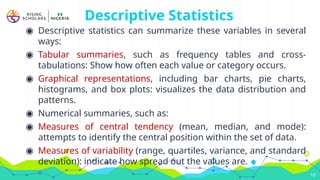
◉ Descriptivestatistics can summarize these variables in several
ways:
◉ Tabular summaries, such as frequency tables and cross-
tabulations: Show how often each value or category occurs.
◉ Graphical representations, including bar charts, pie charts,
histograms, and box plots: visualizes the data distribution and
patterns.
◉ Numerical summaries, such as:
◉ Measures of central tendency (mean, median, and mode):
attempts to identify the central position within the set of data.
◉ Measures of variability (range, quartiles, variance, and standard
deviation): indicate how spread out the values are.
10
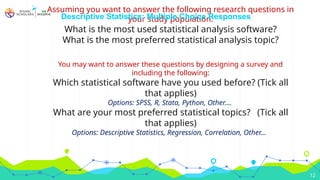
Assuming youwant to answer the following research questions in
your study population:
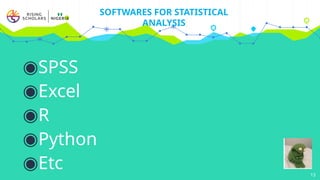
What is the most used statistical analysis software?
What is the most preferred statistical analysis topic?
You may want to answer these questions by designing a survey and
including the following:
Which statistical software have you used before? (Tick all
that applies)
Options: SPSS, R, Stata, Python, Other….
What are your most preferred statistical topics? (Tick all
that applies)
Options: Descriptive Statistics, Regression, Correlation, Other…
12
Descriptive Statistics: Multiple Choice Responses
16
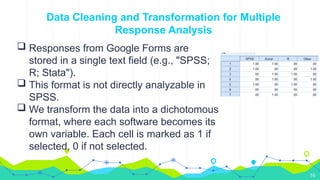
Data Cleaning andTransformation for Multiple
Response Analysis
Responses from Google Forms are
stored in a single text field (e.g., "SPSS;
R; Stata").
This format is not directly analyzable in
SPSS.
We transform the data into a dichotomous
format, where each software becomes its
own variable. Each cell is marked as 1 if
selected, 0 if not selected.
17.
Data Cleaning andTransformation for
Multiple Response Analysis
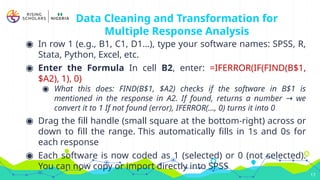
◉ In row 1 (e.g., B1, C1, D1…), type your software names: SPSS, R,
Stata, Python, Excel, etc.
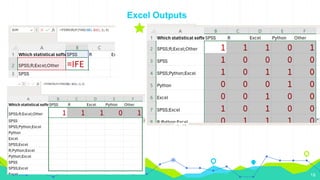
◉ Enter the Formula In cell B2, enter: =IFERROR(IF(FIND(B$1,
$A2), 1), 0)
◉ What this does: FIND(B$1, $A2) checks if the software in B$1 is
mentioned in the response in A2. If found, returns a number we
→
convert it to 1 If not found (error), IFERROR(..., 0) turns it into 0
◉ Drag the fill handle (small square at the bottom-right) across or
down to fill the range. This automatically fills in 1s and 0s for
each response
◉ Each software is now coded as 1 (selected) or 0 (not selected).
You can now copy or import directly into SPSS
17
Step-by-Step: Multiple ResponseAnalysis
20
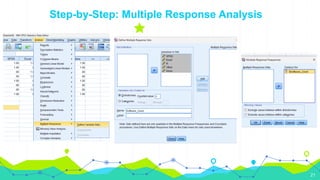
Go to Analyze → Multiple Response → Define Variable Sets
Select your software variables (e.g., SPSS, R, Python, etc.)
Click ➡️Define Set
Choose Dichotomies
Counted Value = 1
Name your set (e.g., “Software_Used”)
Click Add and then Close
Now go to Analyze → Multiple Response → Frequencies
Select the set you just created
Click OK to view frequencies
Interpretation
23
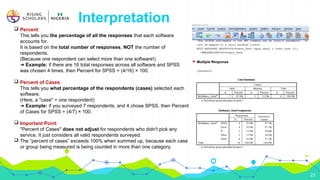
Percent:
This tellsyou the percentage of all the responses that each software
accounts for.
It is based on the total number of responses, NOT the number of
respondents.
(Because one respondent can select more than one software!)
➔ Example: if there are 16 total responses across all software and SPSS
was chosen 4 times, then Percent for SPSS = (4/16) × 100.
Percent of Cases:
This tells you what percentage of the respondents (cases) selected each
software.
(Here, a "case" = one respondent)
➔ Example: if you surveyed 7 respondents, and 4 chose SPSS, then Percent
of Cases for SPSS = (4/7) × 100.
Important Point:
"Percent of Cases" does not adjust for respondents who didn't pick any
service. It just considers all valid respondents surveyed.
The “percent of cases” exceeds 100% when summed up, because each case
or group being measured is being counted in more than one category.
THANK YOU FORYOUR TIME
Linkedin:
https://www.linkedin.com/in/fortune-effion
g-2068591a1/
X:
https://x.com/fortunebeffiong
Facebook:
https://web.facebook.com/fortu
ne.effiong
effiongfortuneb@gmail.com
25
Editor's Notes
#9 The aim is simply to describe the data from the sample you have.
#15 SPSS and many other analysis tools cannot directly analyze responses stored as combined text (e.g., "SPSS; R; Stata" in one cell). Instead, each possible response must be coded into its own column like this (next slide):
#17 The Manual Way is Time-Consuming. Going row by row to separate software options is tedious and inefficient. Especially with large datasets, manual processing increases error risk.
#20 Optional: Use Crosstabs or Charts for deeper insights