Download as PDF, PPTX
![Using Scales
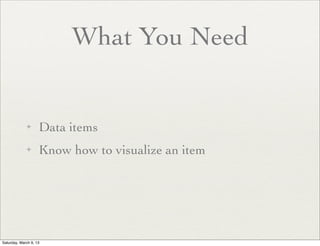
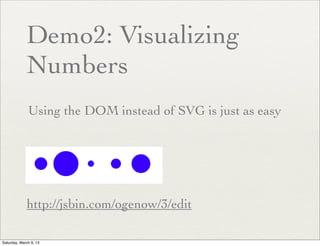
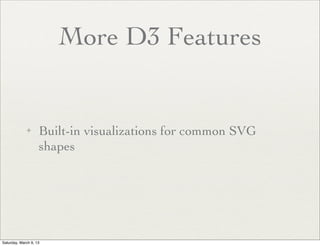
✦ The scale function creates a
scale var xScale = d3.scale.linear()
.domain([0,data.length])
.range([50,500]);
✦ Domain is the input
.attr('cx', function(d, i) {
✦ Range is the output return xScale( i );
})
✦ Basically, it translates
FROM domain TO range
✦ https://github.com/
mbostock/d3/wiki/Scales
Saturday, March 9, 13](https://image.slidesharecdn.com/d3-130309114003-phpapp01/85/D3-js-16-320.jpg)
![D3 Charts Example
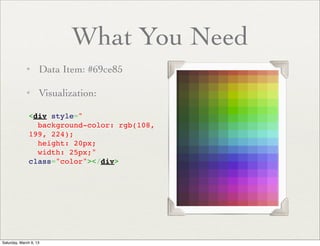
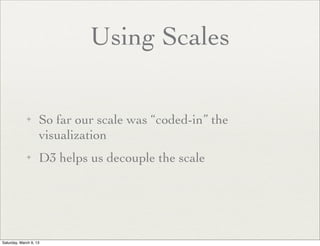
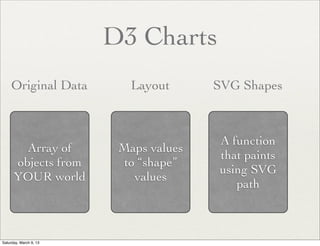
var pie_values = [
{ y: 10, label: 'foo'},
Your Data { y: 20, label: 'bar'},
{ y: 40, label: 'buz'},
{ y: 30, label: 'hss'}
];
Saturday, March 9, 13](https://image.slidesharecdn.com/d3-130309114003-phpapp01/85/D3-js-21-320.jpg)
![D3 Charts Example
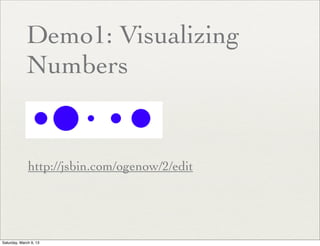
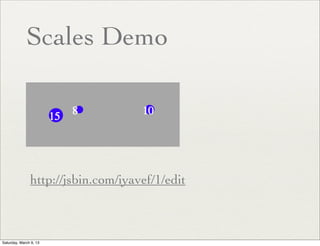
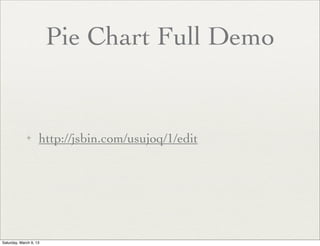
Layout
[
{"data":{"y":10,"label":"foo"},"value":10,"startAngle":
5.654866776461628,"endAngle":6.283185307179586},
{"data":{"y":20,"label":"bar"},"value":20,"startAngle":
4.39822971502571,"endAngle":5.654866776461628},
{"data":{"y":40,"label":"buz"},"value":40,"startAngle":
0,"endAngle":2.5132741228718345},
{"data":{"y":30,"label":"hss"},"value":30,"startAngle":
2.5132741228718345,"endAngle":4.39822971502571}
]
Saturday, March 9, 13](https://image.slidesharecdn.com/d3-130309114003-phpapp01/85/D3-js-22-320.jpg)
![D3 Charts Example
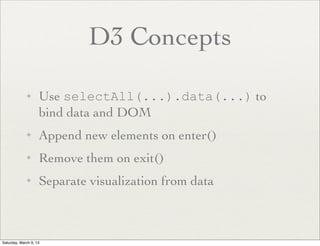
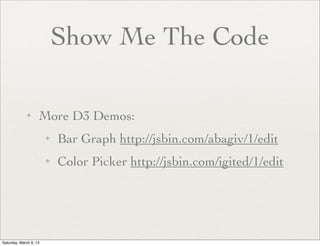
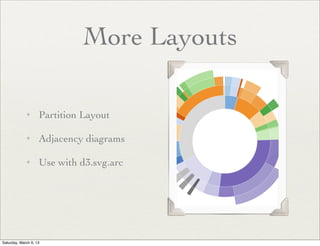
✦ Create a shape with:
var arc = d3.svg.arc().outerRadius(150).innerRadius(0);
✦ Now we get:
arc(p_data[0]) ==
"M-88.16778784387098,-121.3525491562421A150,150 0 0,1
-2.7553642961003488e-14,-150L0,0Z"
Saturday, March 9, 13](https://image.slidesharecdn.com/d3-130309114003-phpapp01/85/D3-js-23-320.jpg)


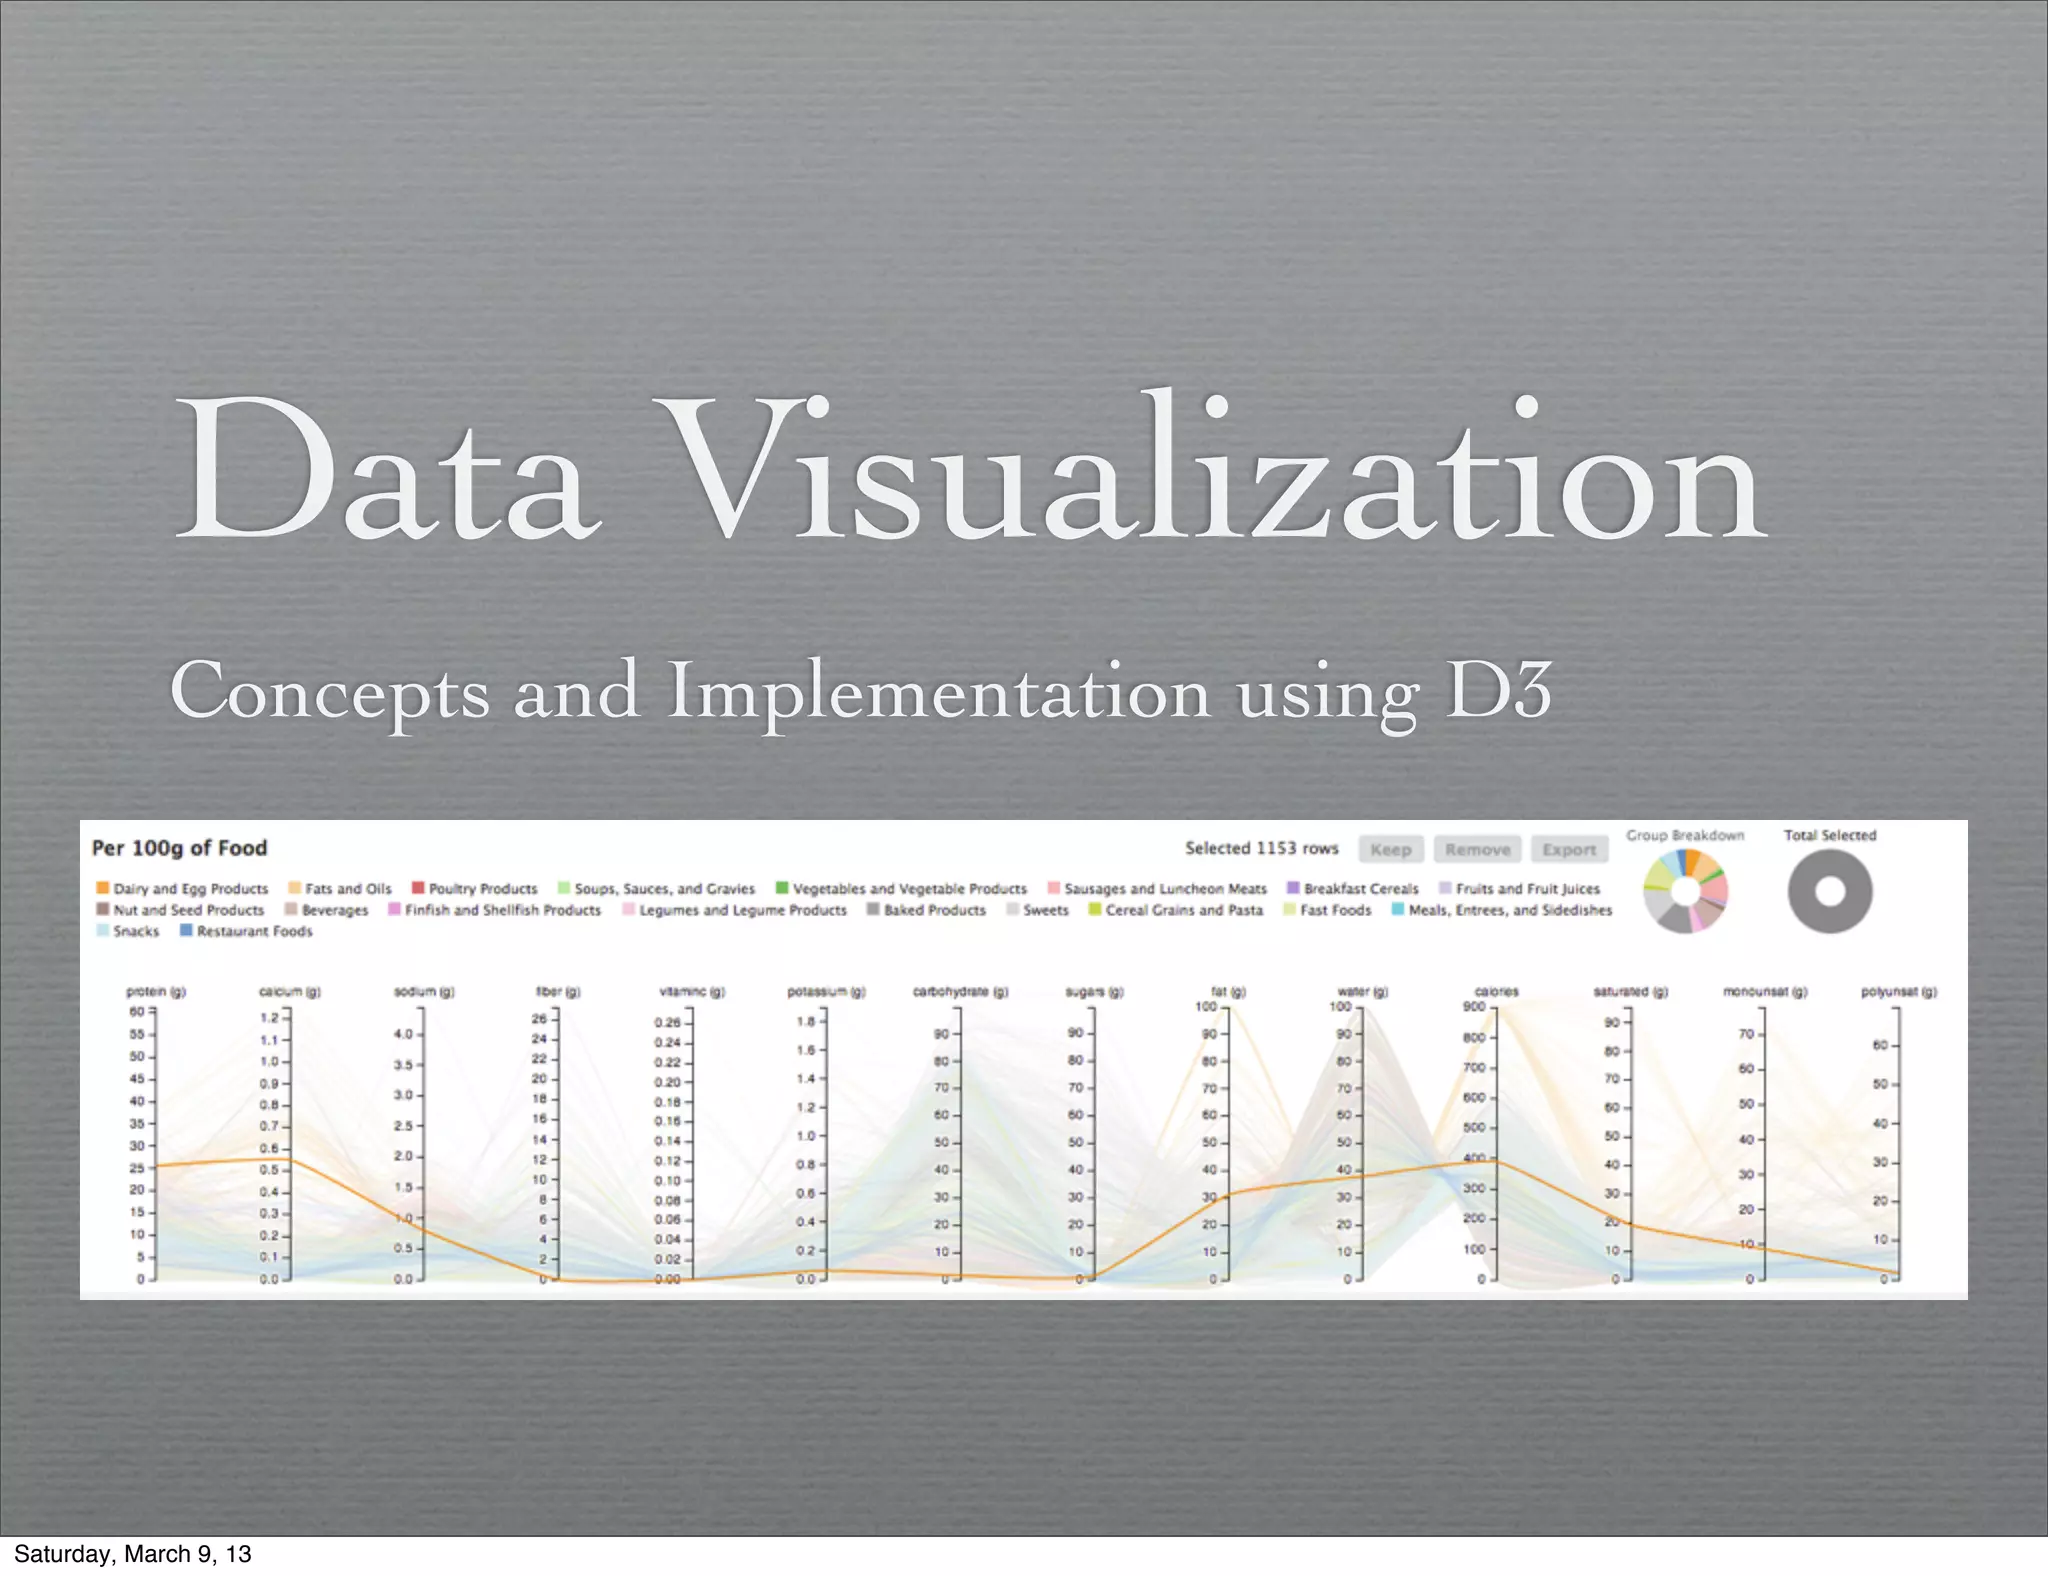
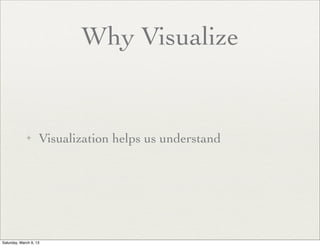
This document outlines an agenda and introduction to data visualization concepts and implementation using D3. It discusses why visualization is useful, challenges with versatile data and visualization, and how D3 is different by allowing the user to choose the visualization rather than prescribing a particular visualization. It then demonstrates basic D3 concepts like binding data to DOM elements and using scales to map data values to visual properties before discussing built-in visualization types, layouts, and providing resources for additional examples.