Downloaded 27 times


![A Scatter Chart (part 1)
Step #1 define a JS array with data values:
var dataXValues=[10, 50, 20, 80,150,180,220];
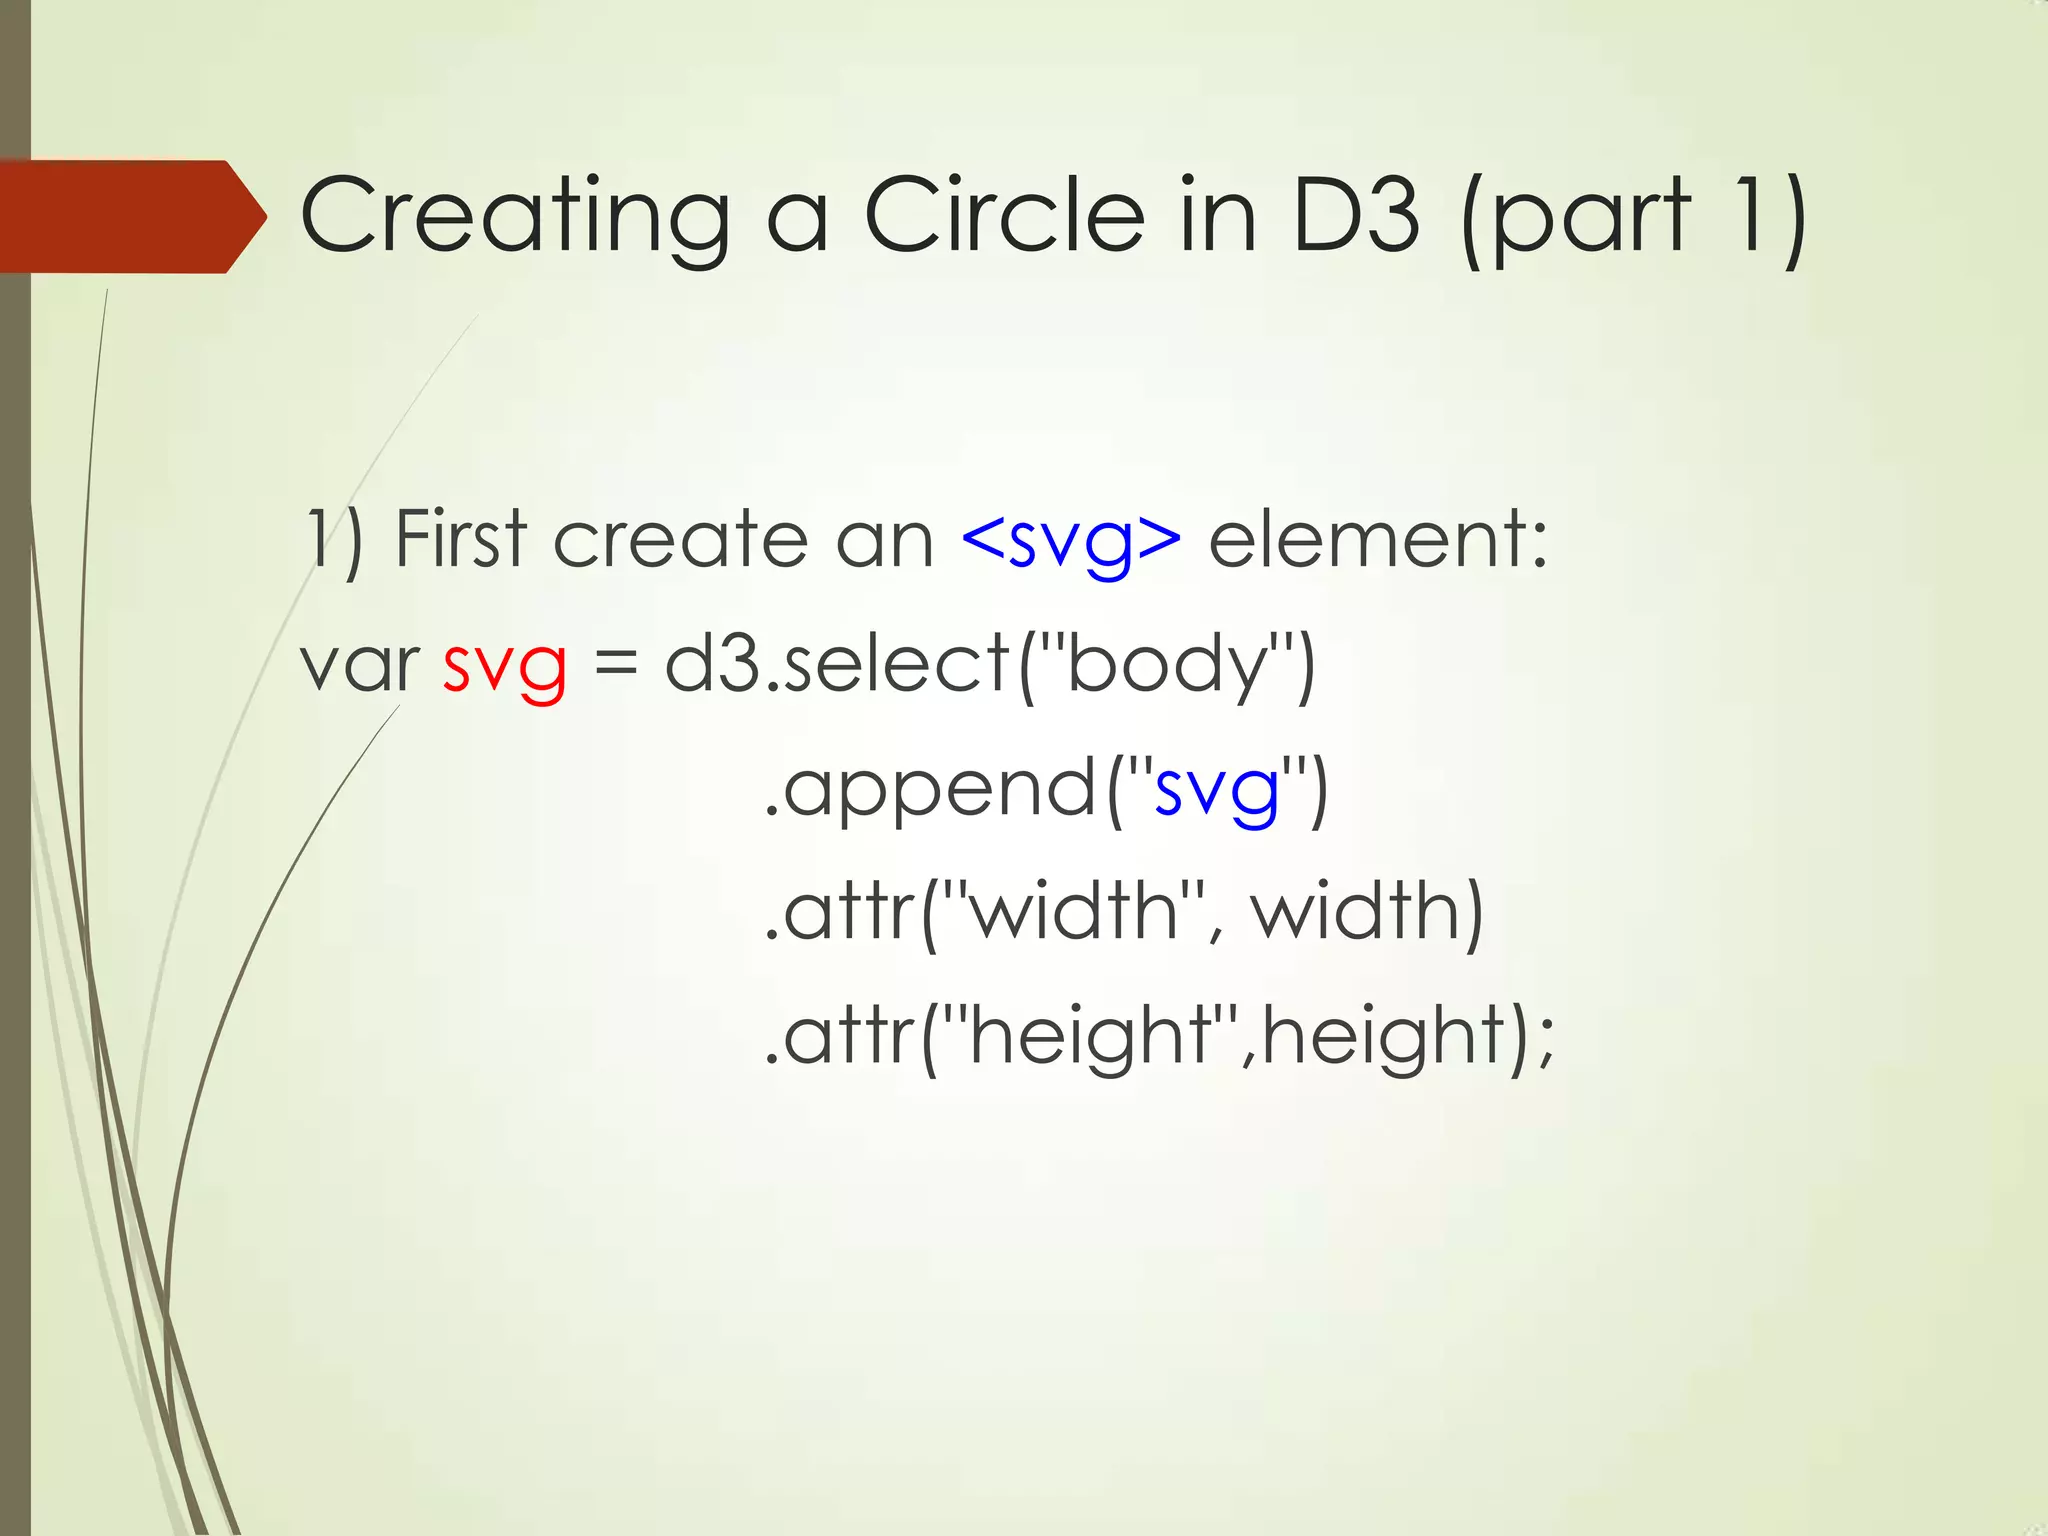
Step #2 Create an SVG element:
var svg = d3.select("body")
.append("svg")
.attr("width", width)
.attr("height", height);](https://image.slidesharecdn.com/svcc-2013-d3-131006184750-phpapp01/75/Svcc-2013-d3-14-2048.jpg)
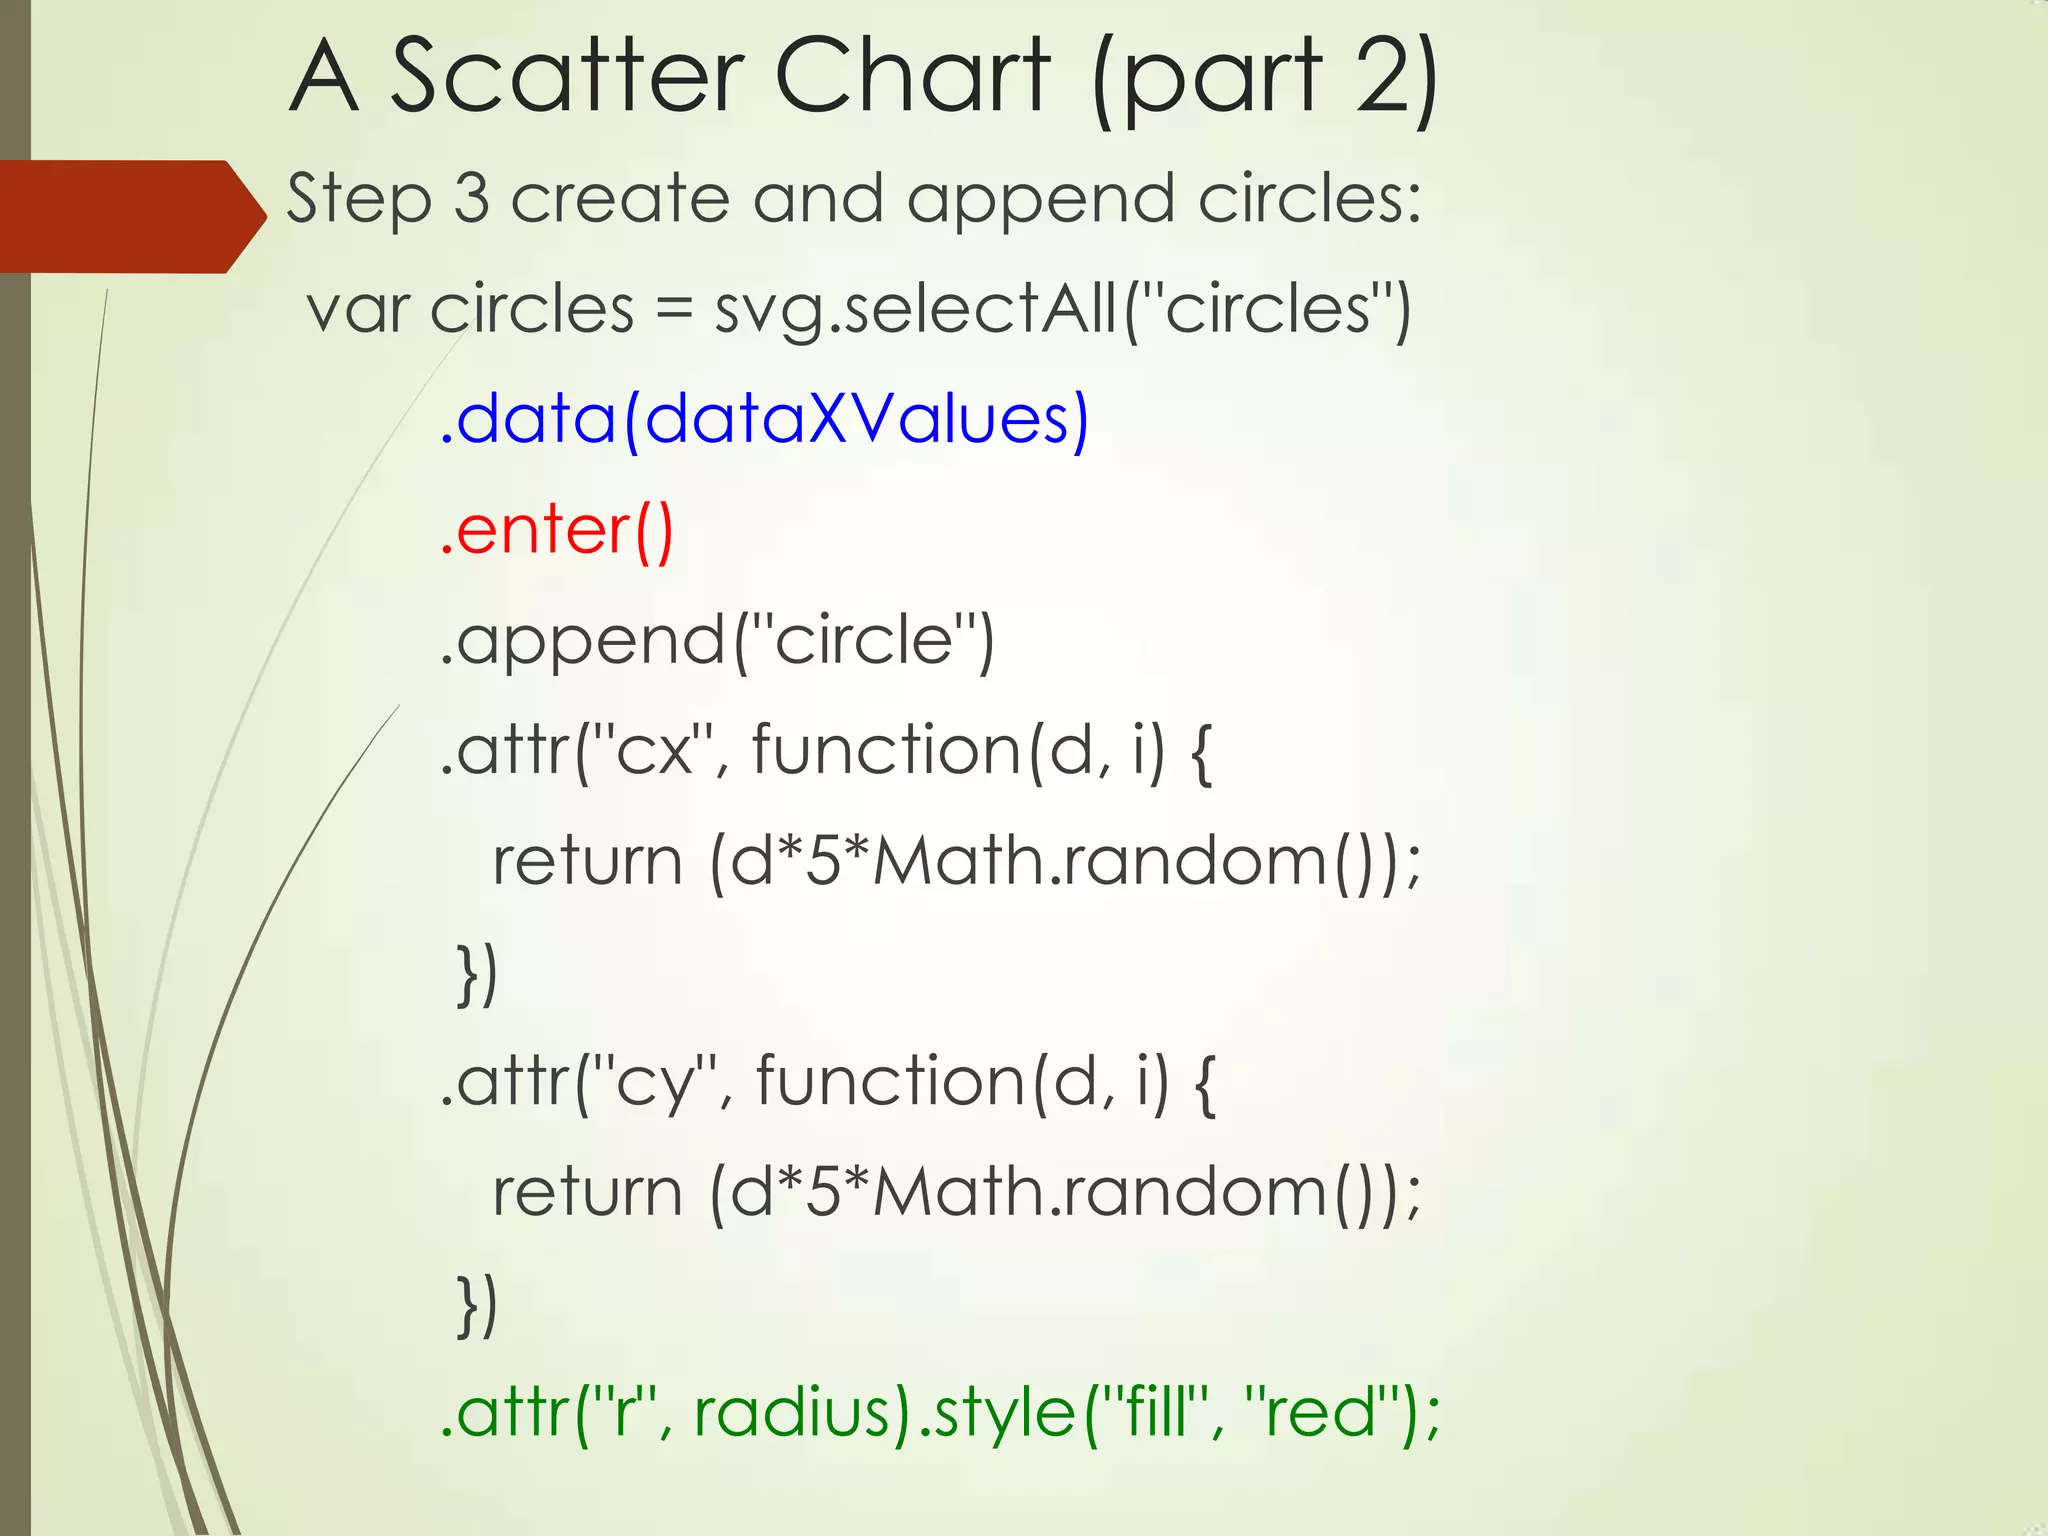
![Using Arrays for all Circle Attributes
var generalizedCircles = svg.selectAll("circles")
.data(dataXValues).enter().append("circle")
.attr("cx", function(d, i) { return d; })
.attr("cy", function(d, i) { return dataYValues[i]; })
.attr(”r", function(d, i) { return dataRValues[i];
})
.style (”fill", function(d, i) { return dataFValues[i];})](https://image.slidesharecdn.com/svcc-2013-d3-131006184750-phpapp01/75/Svcc-2013-d3-16-2048.jpg)
![Using Arrays for Rectangle Attributes
var generalizedRectangles = svg.selectAll(”rect")
.data(dataXValues).enter().append(”rect")
.attr(“x", function(d, i) { return dataXValues[i]; })
.attr(“y", function(d, i) { return dataYValues[i]; })
.attr(”width", function(d, i) { return dataWValues[i]; })
.attr(”height", function(d, i) { return dataHValues[i]; })
.style (”fill", function(d, i) { return dataFValues[i]; })](https://image.slidesharecdn.com/svcc-2013-d3-131006184750-phpapp01/75/Svcc-2013-d3-17-2048.jpg)

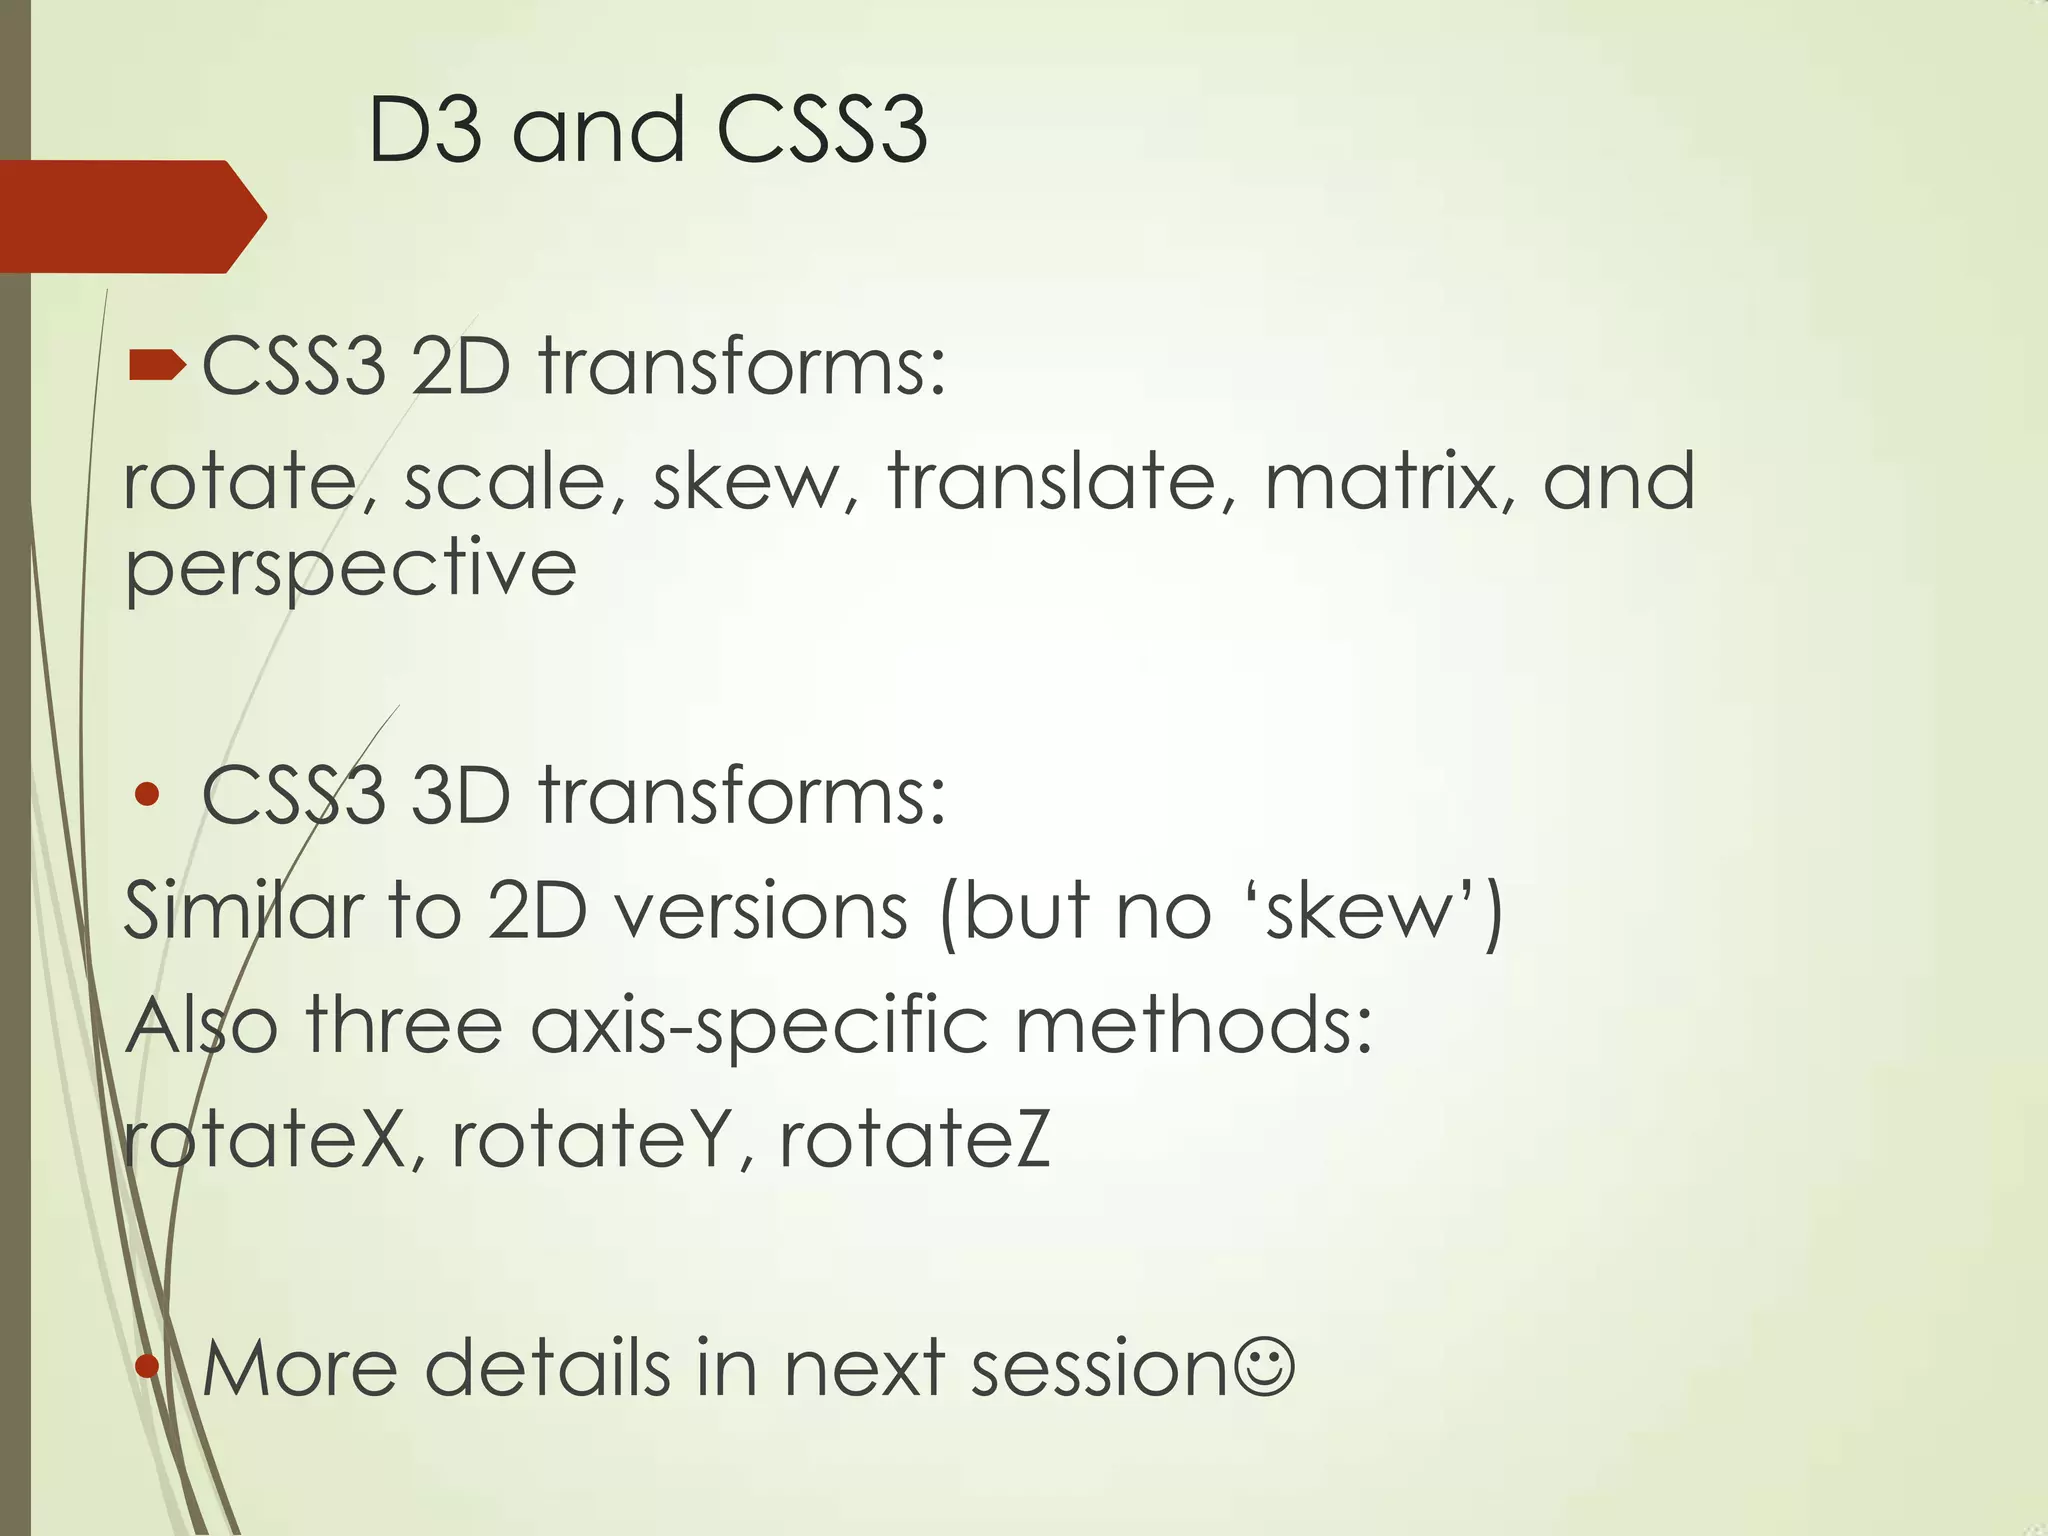
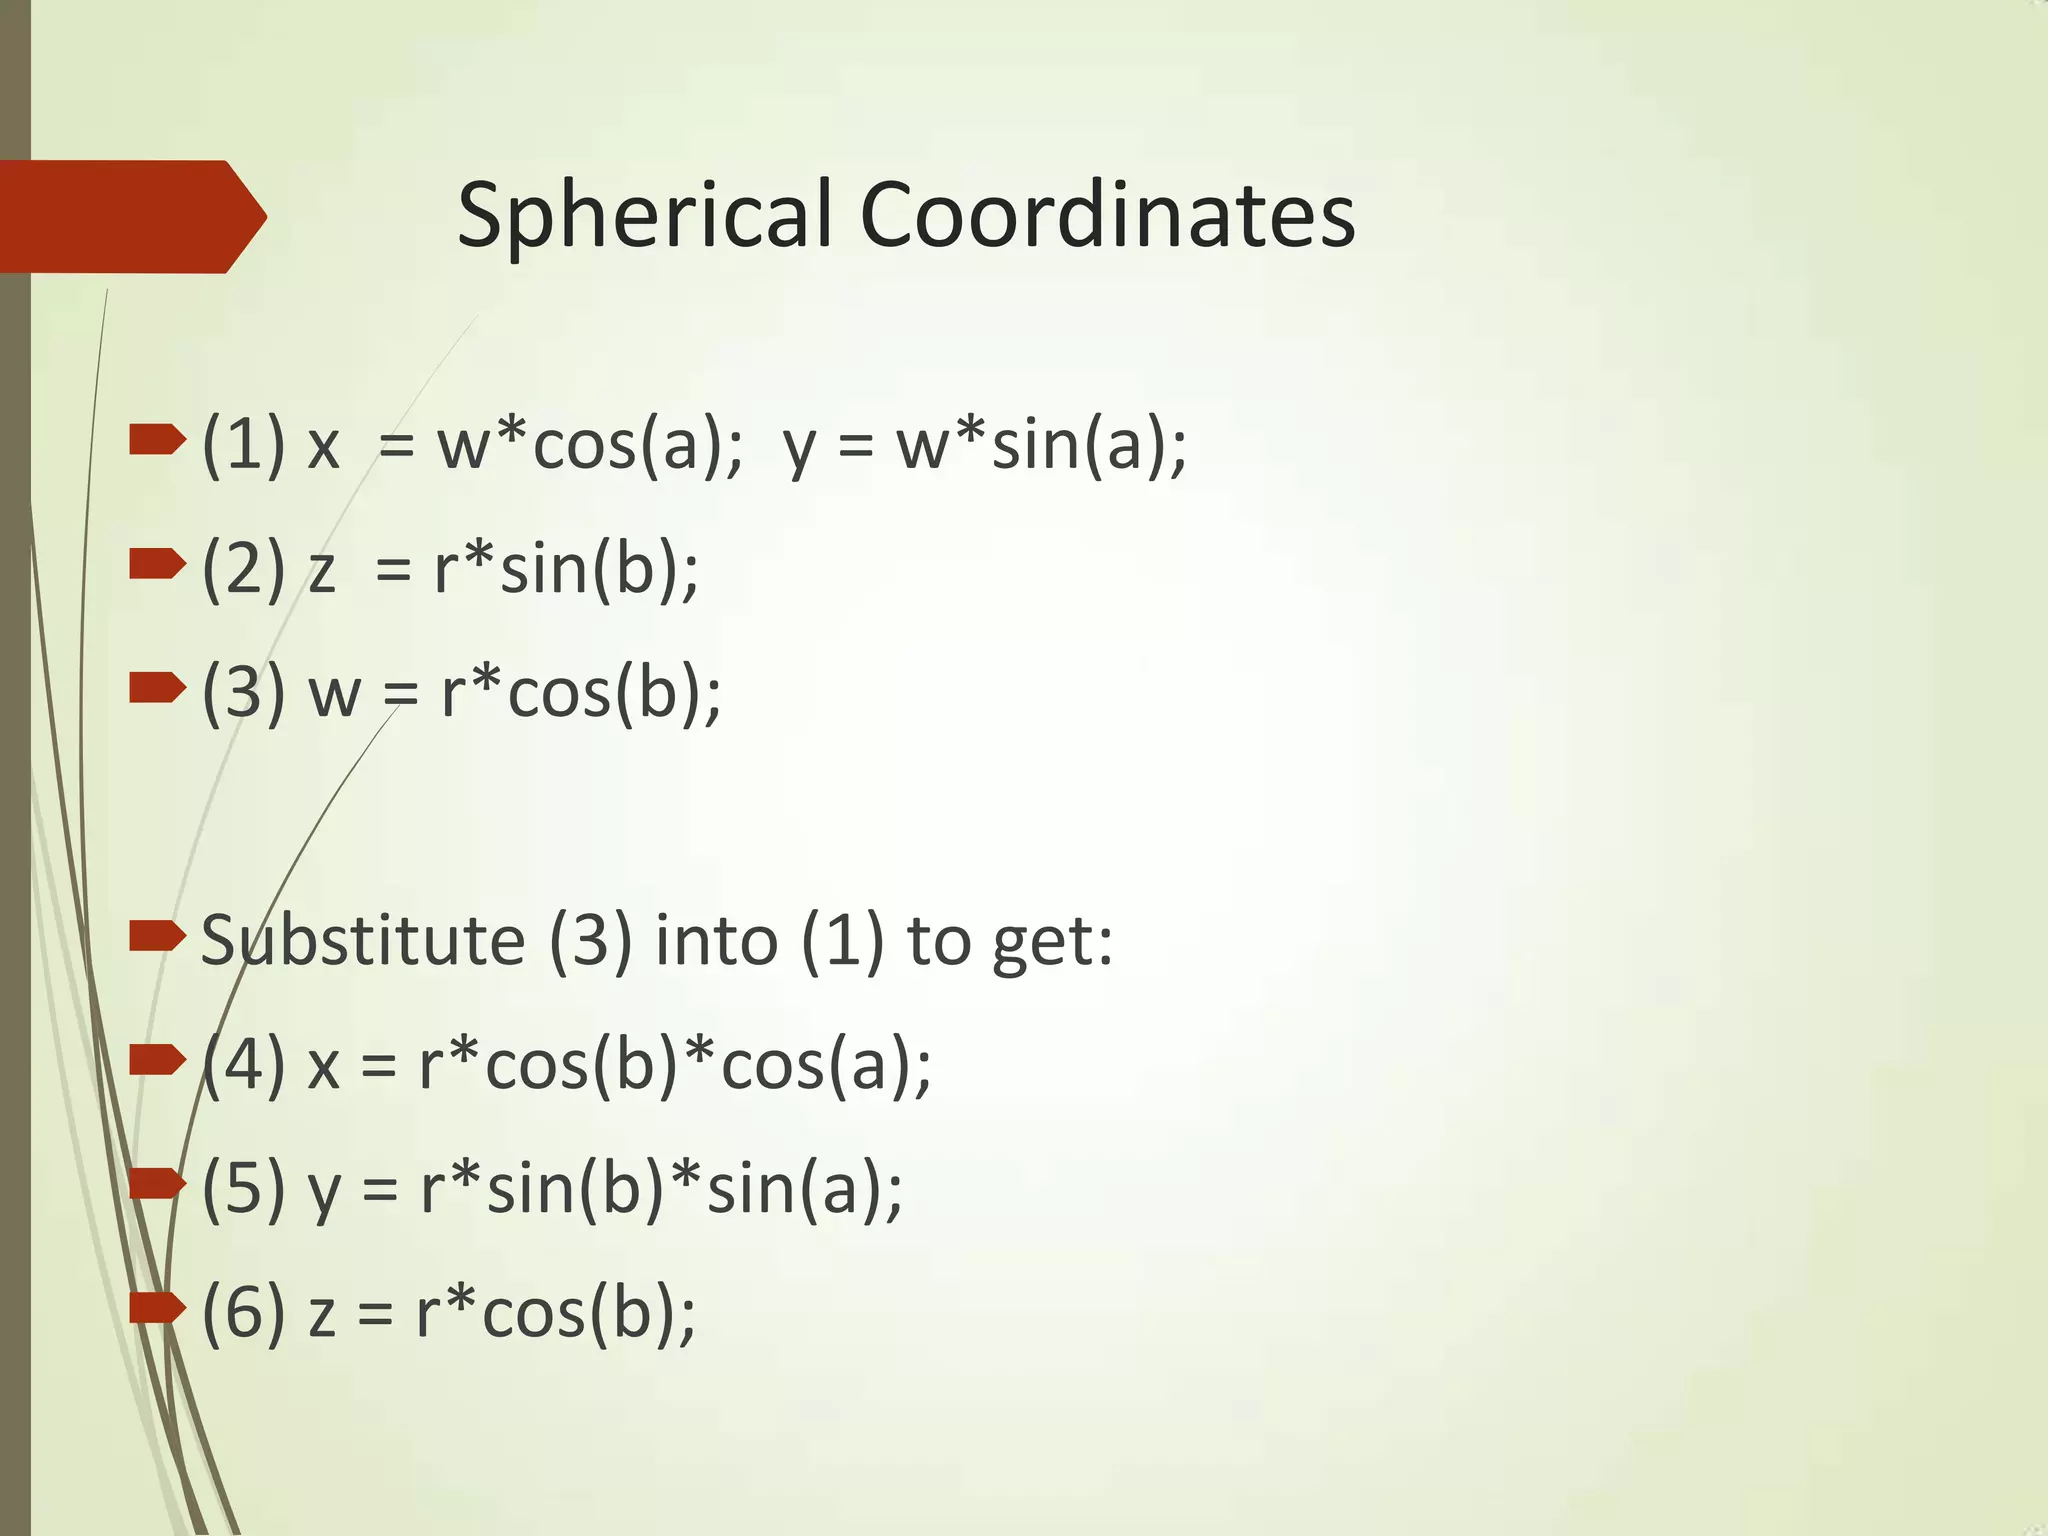
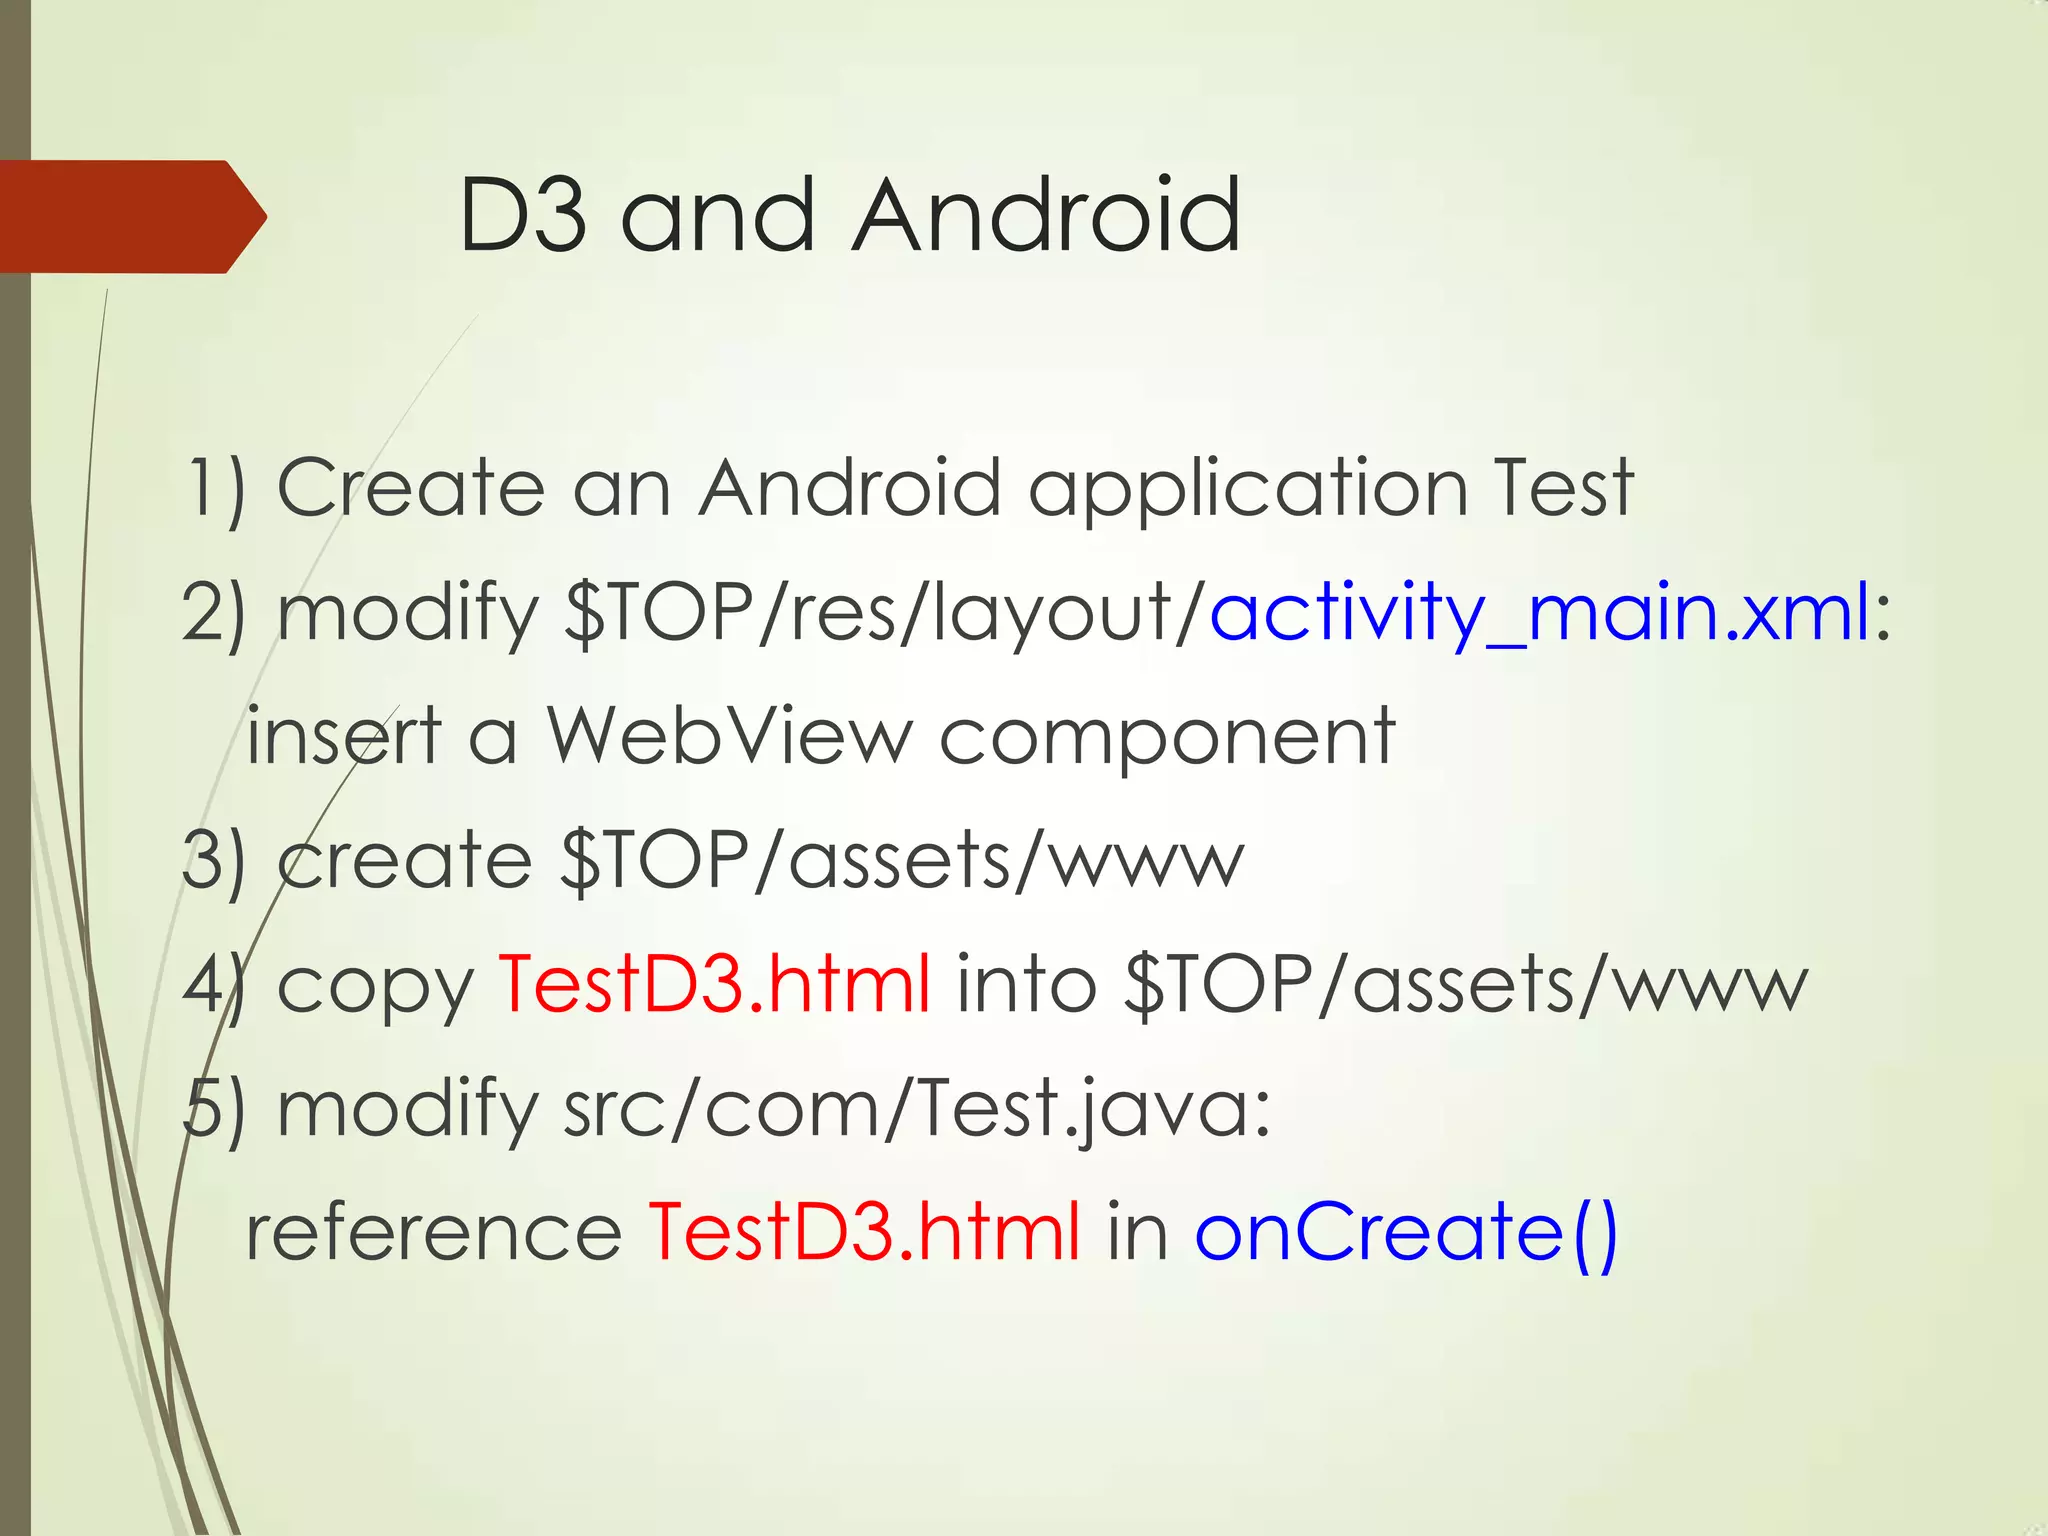

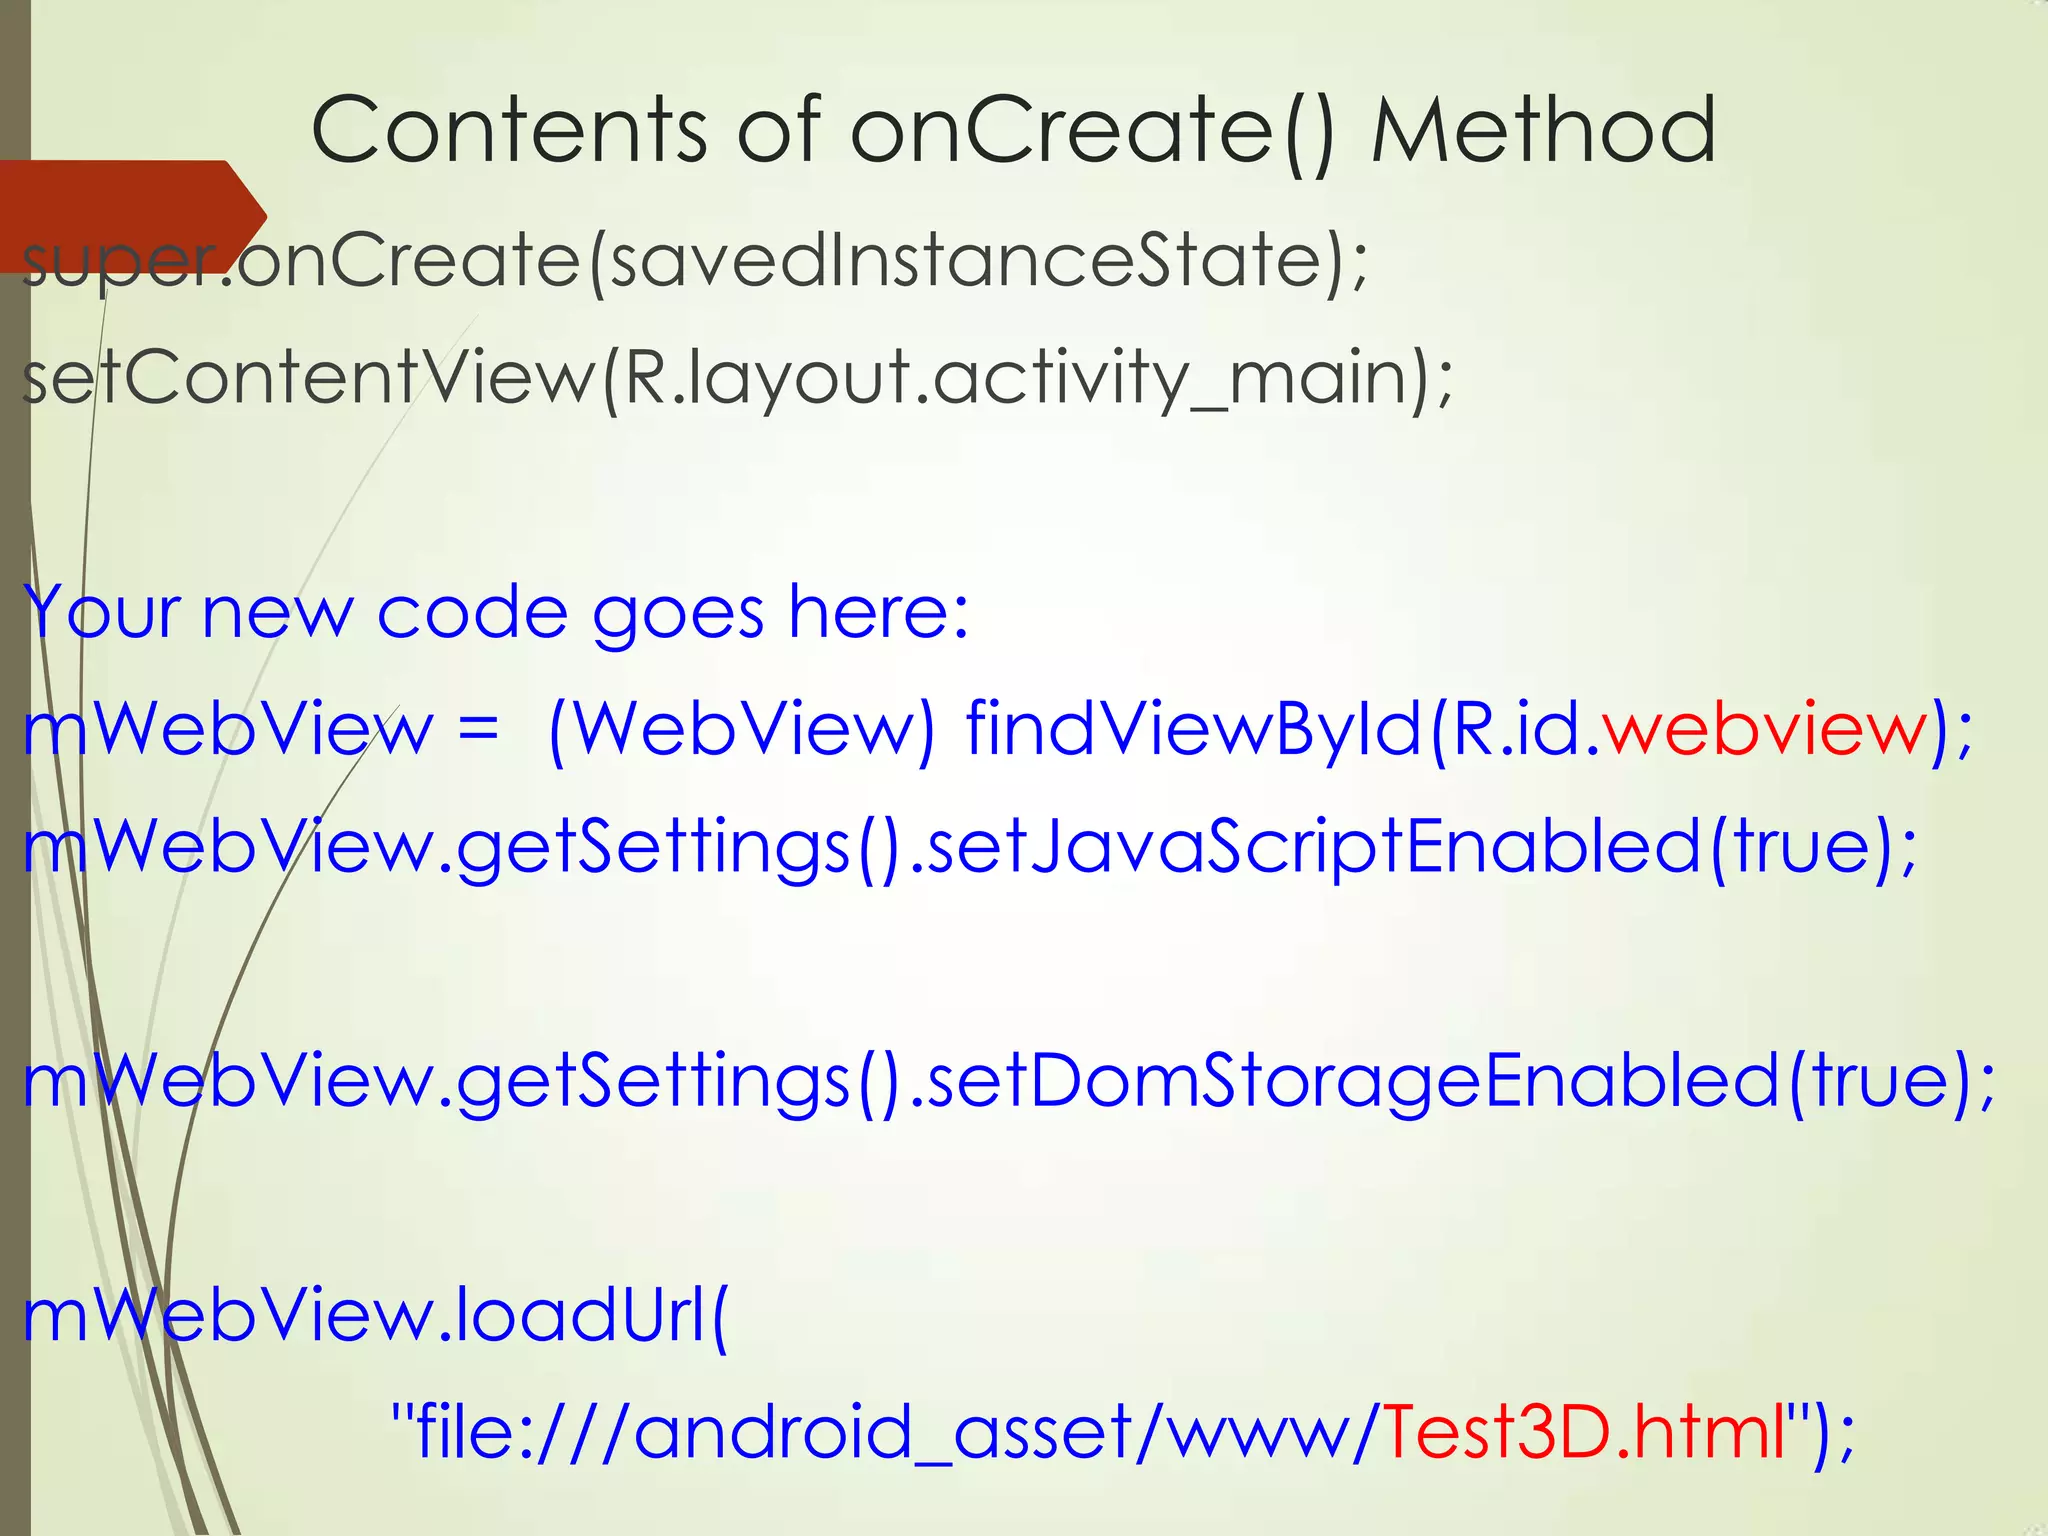


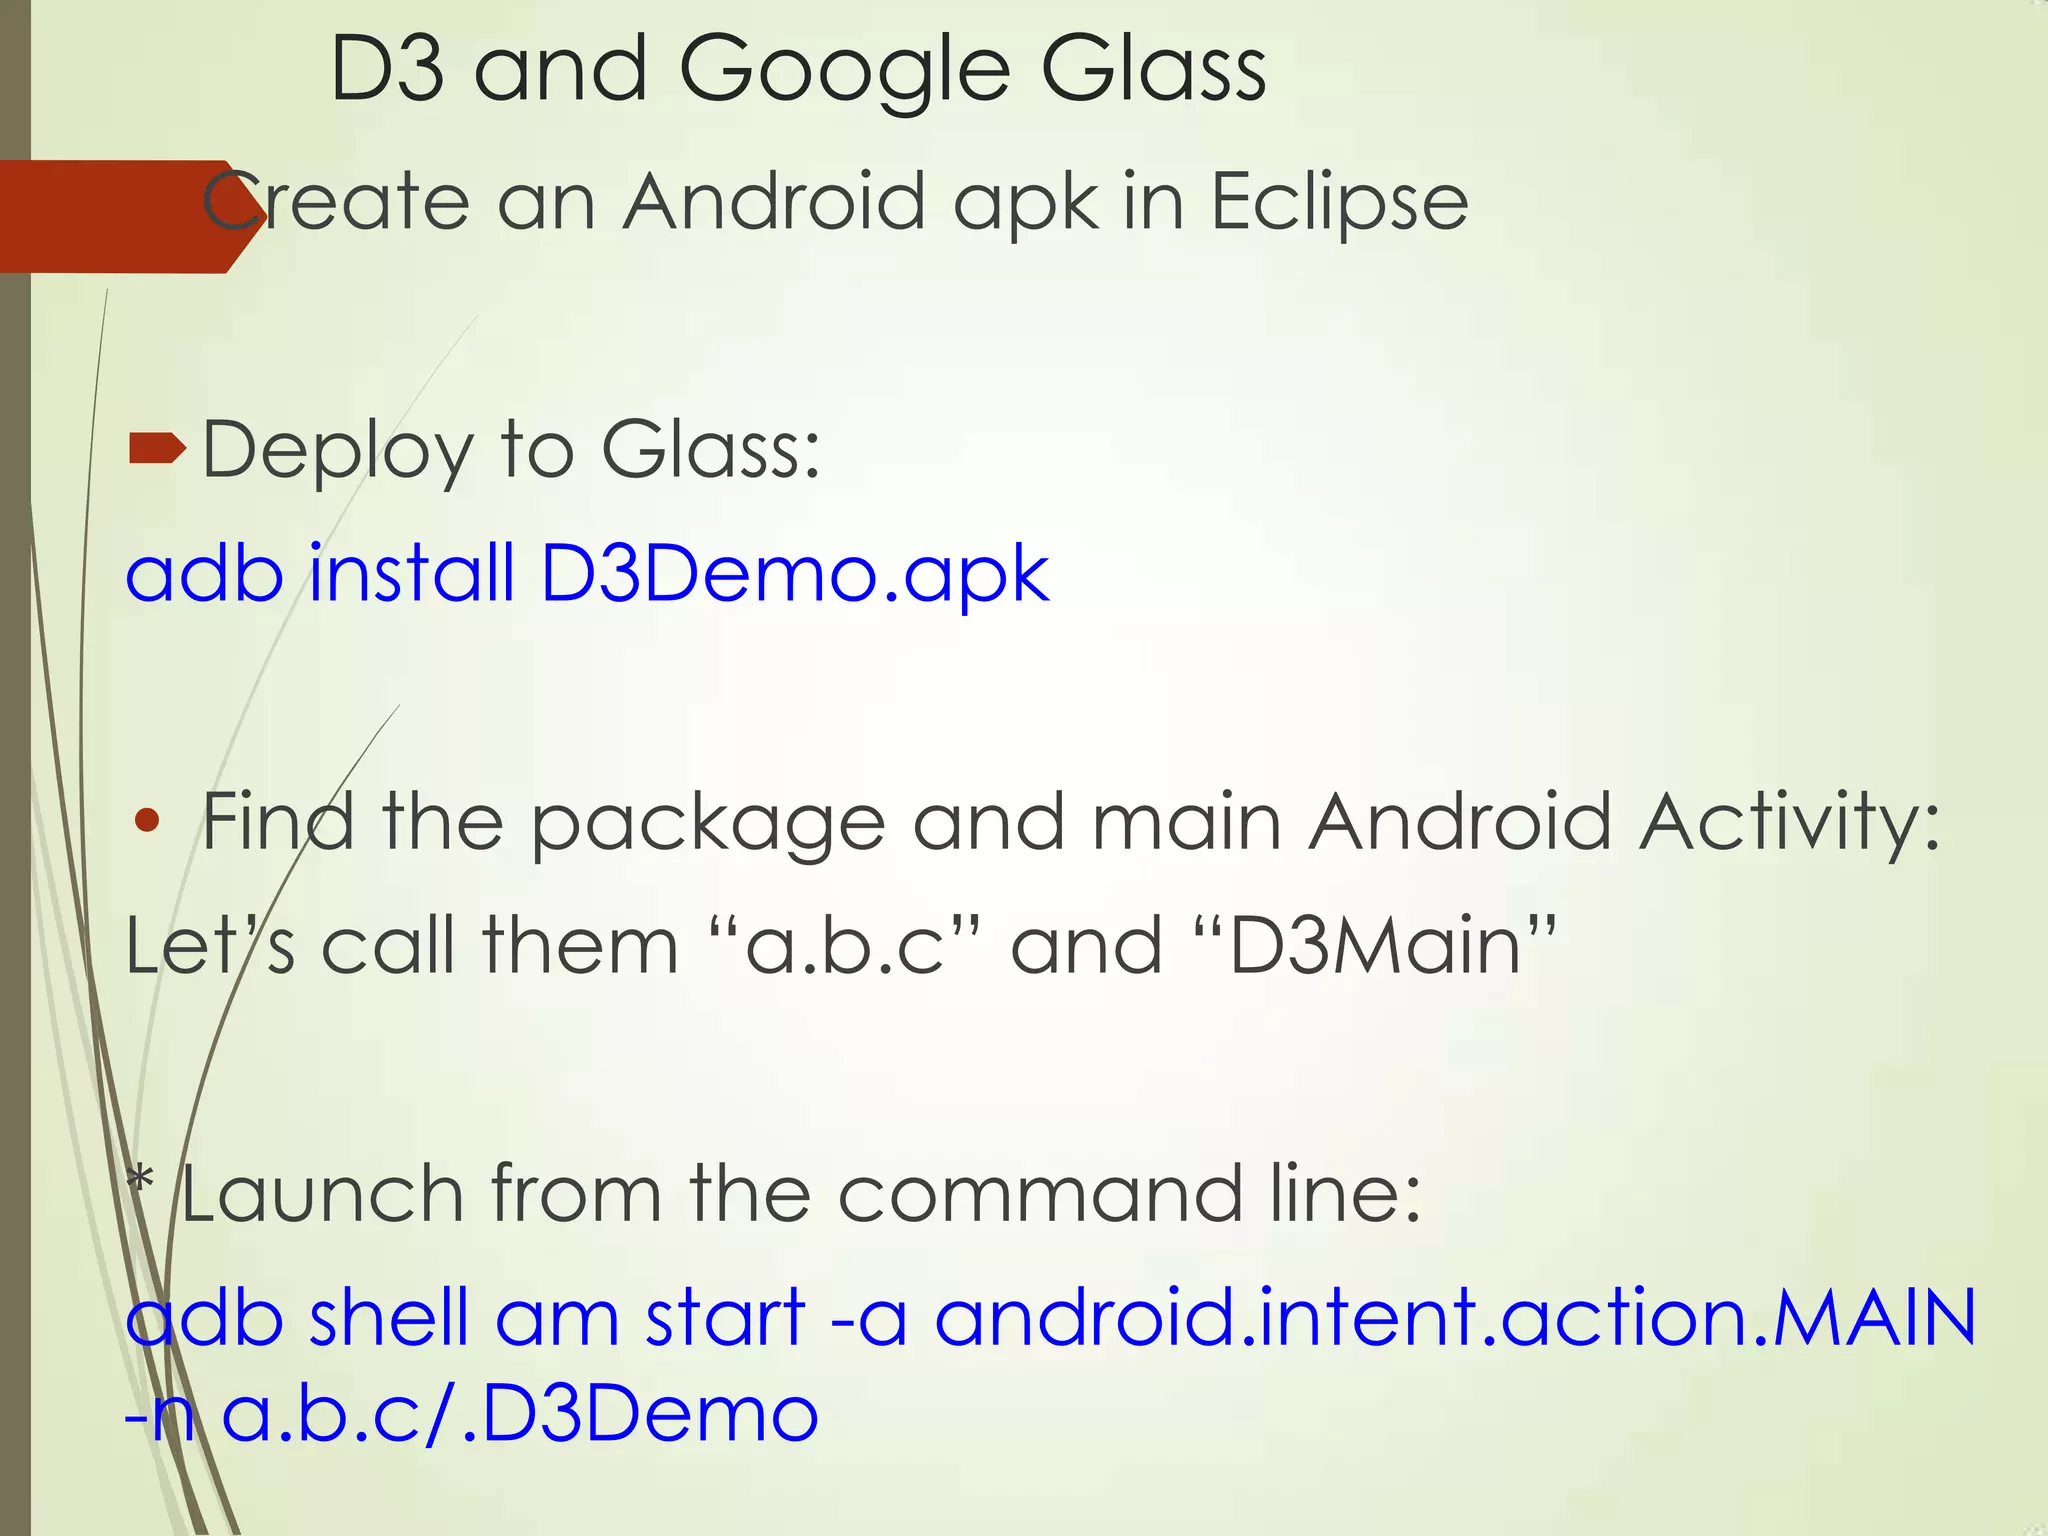


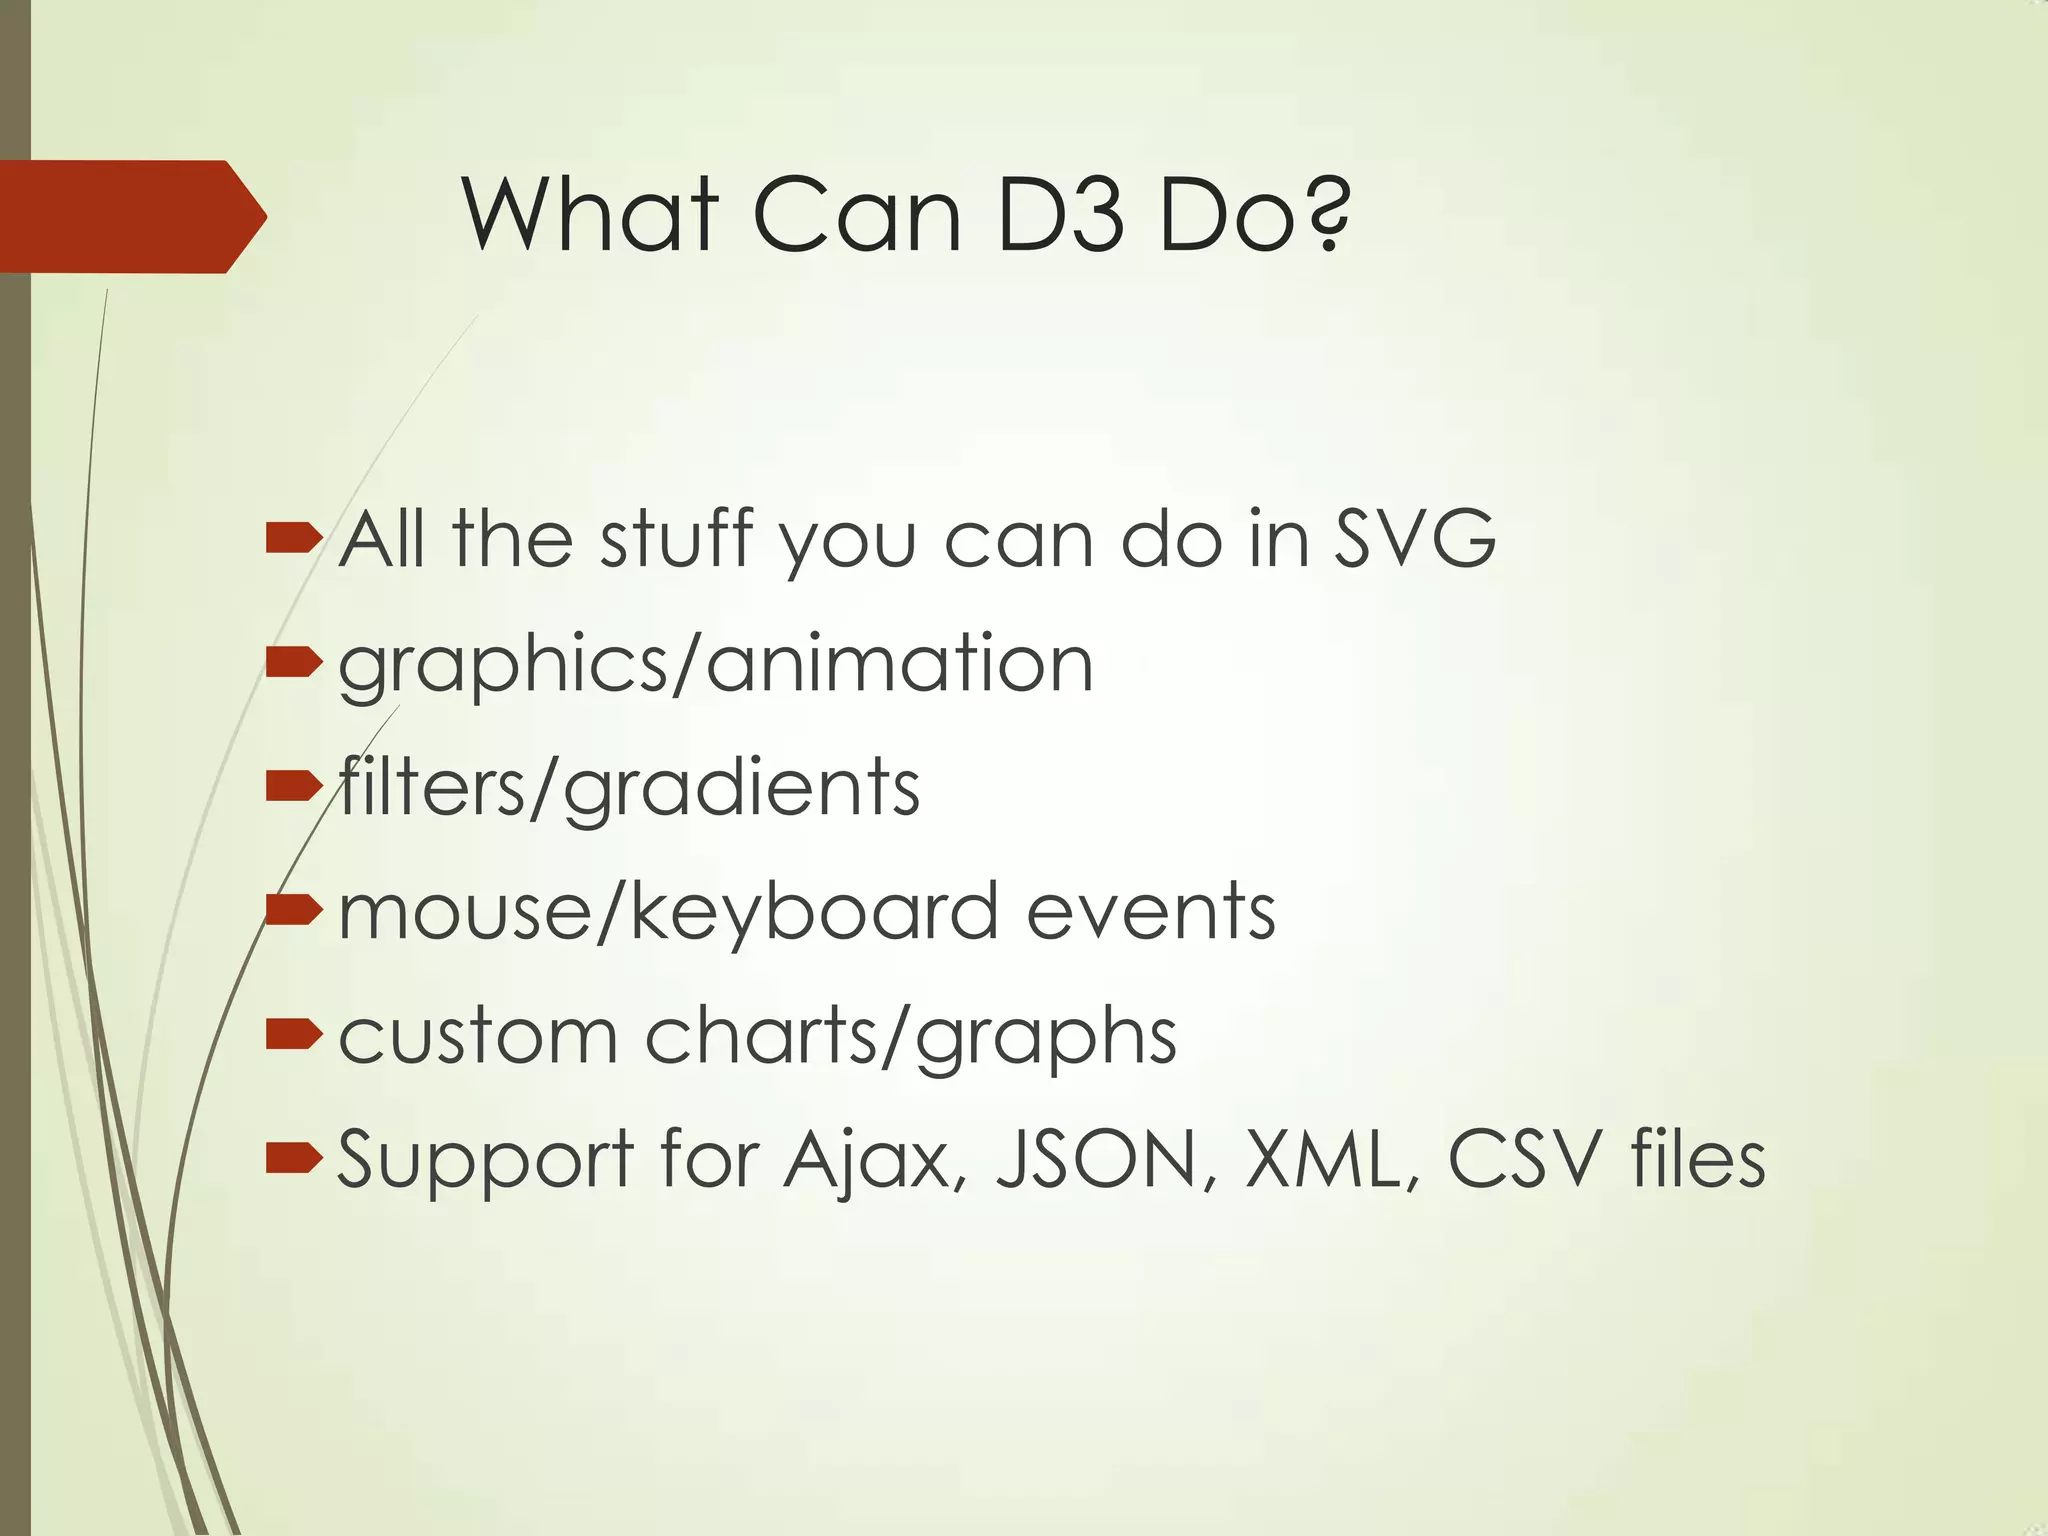
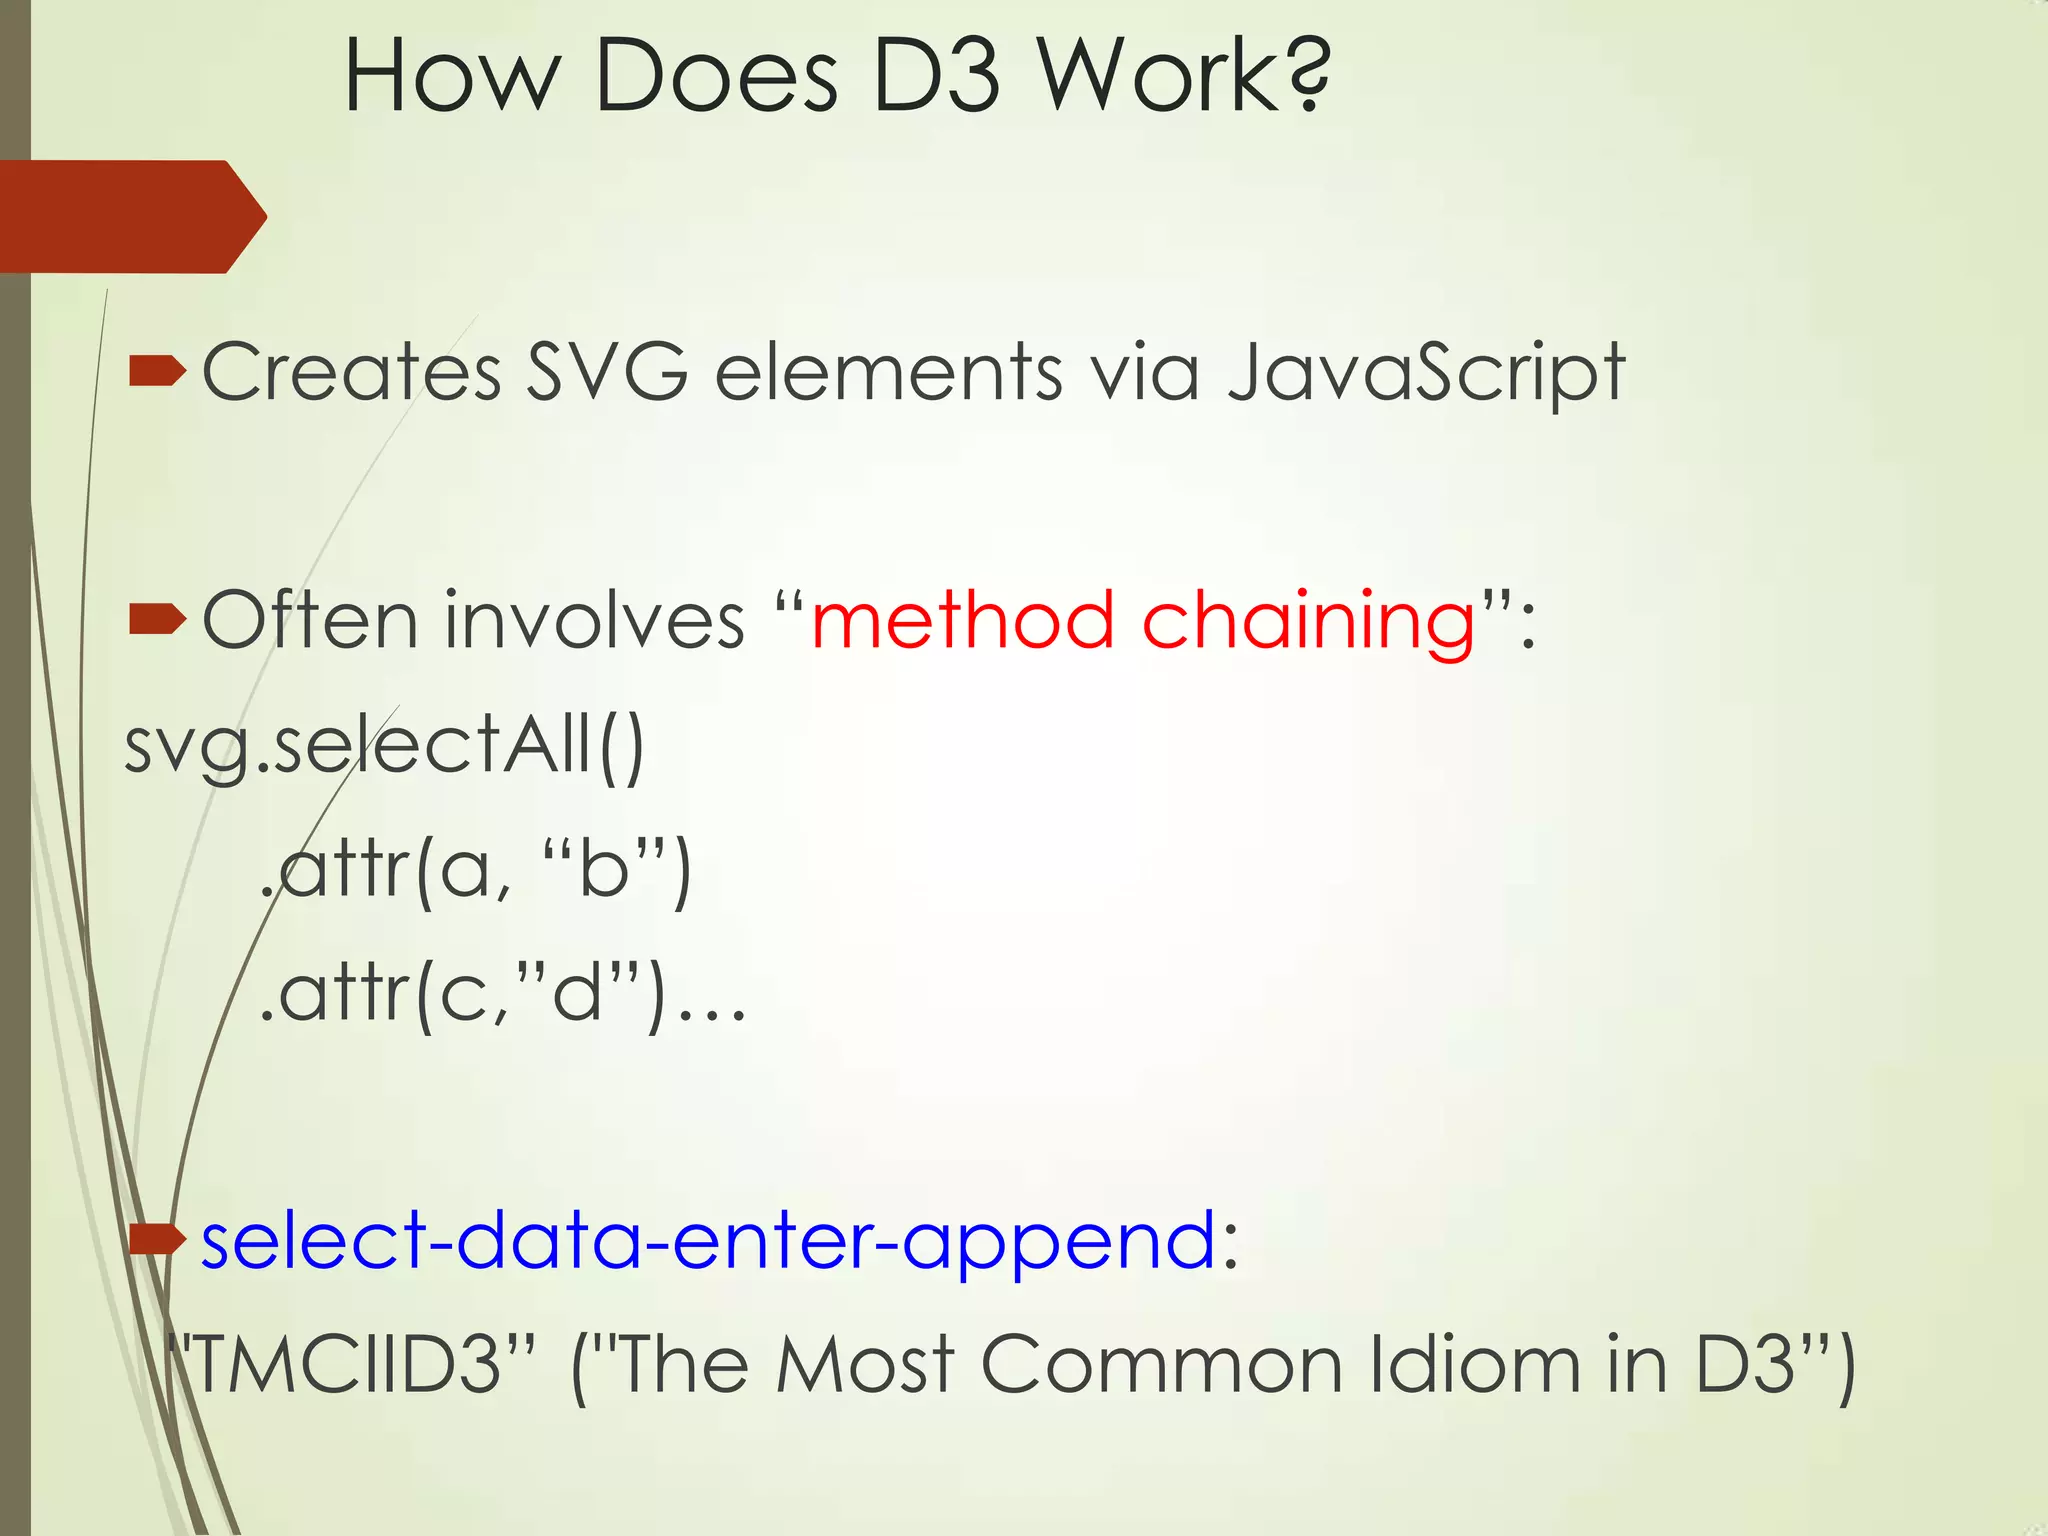
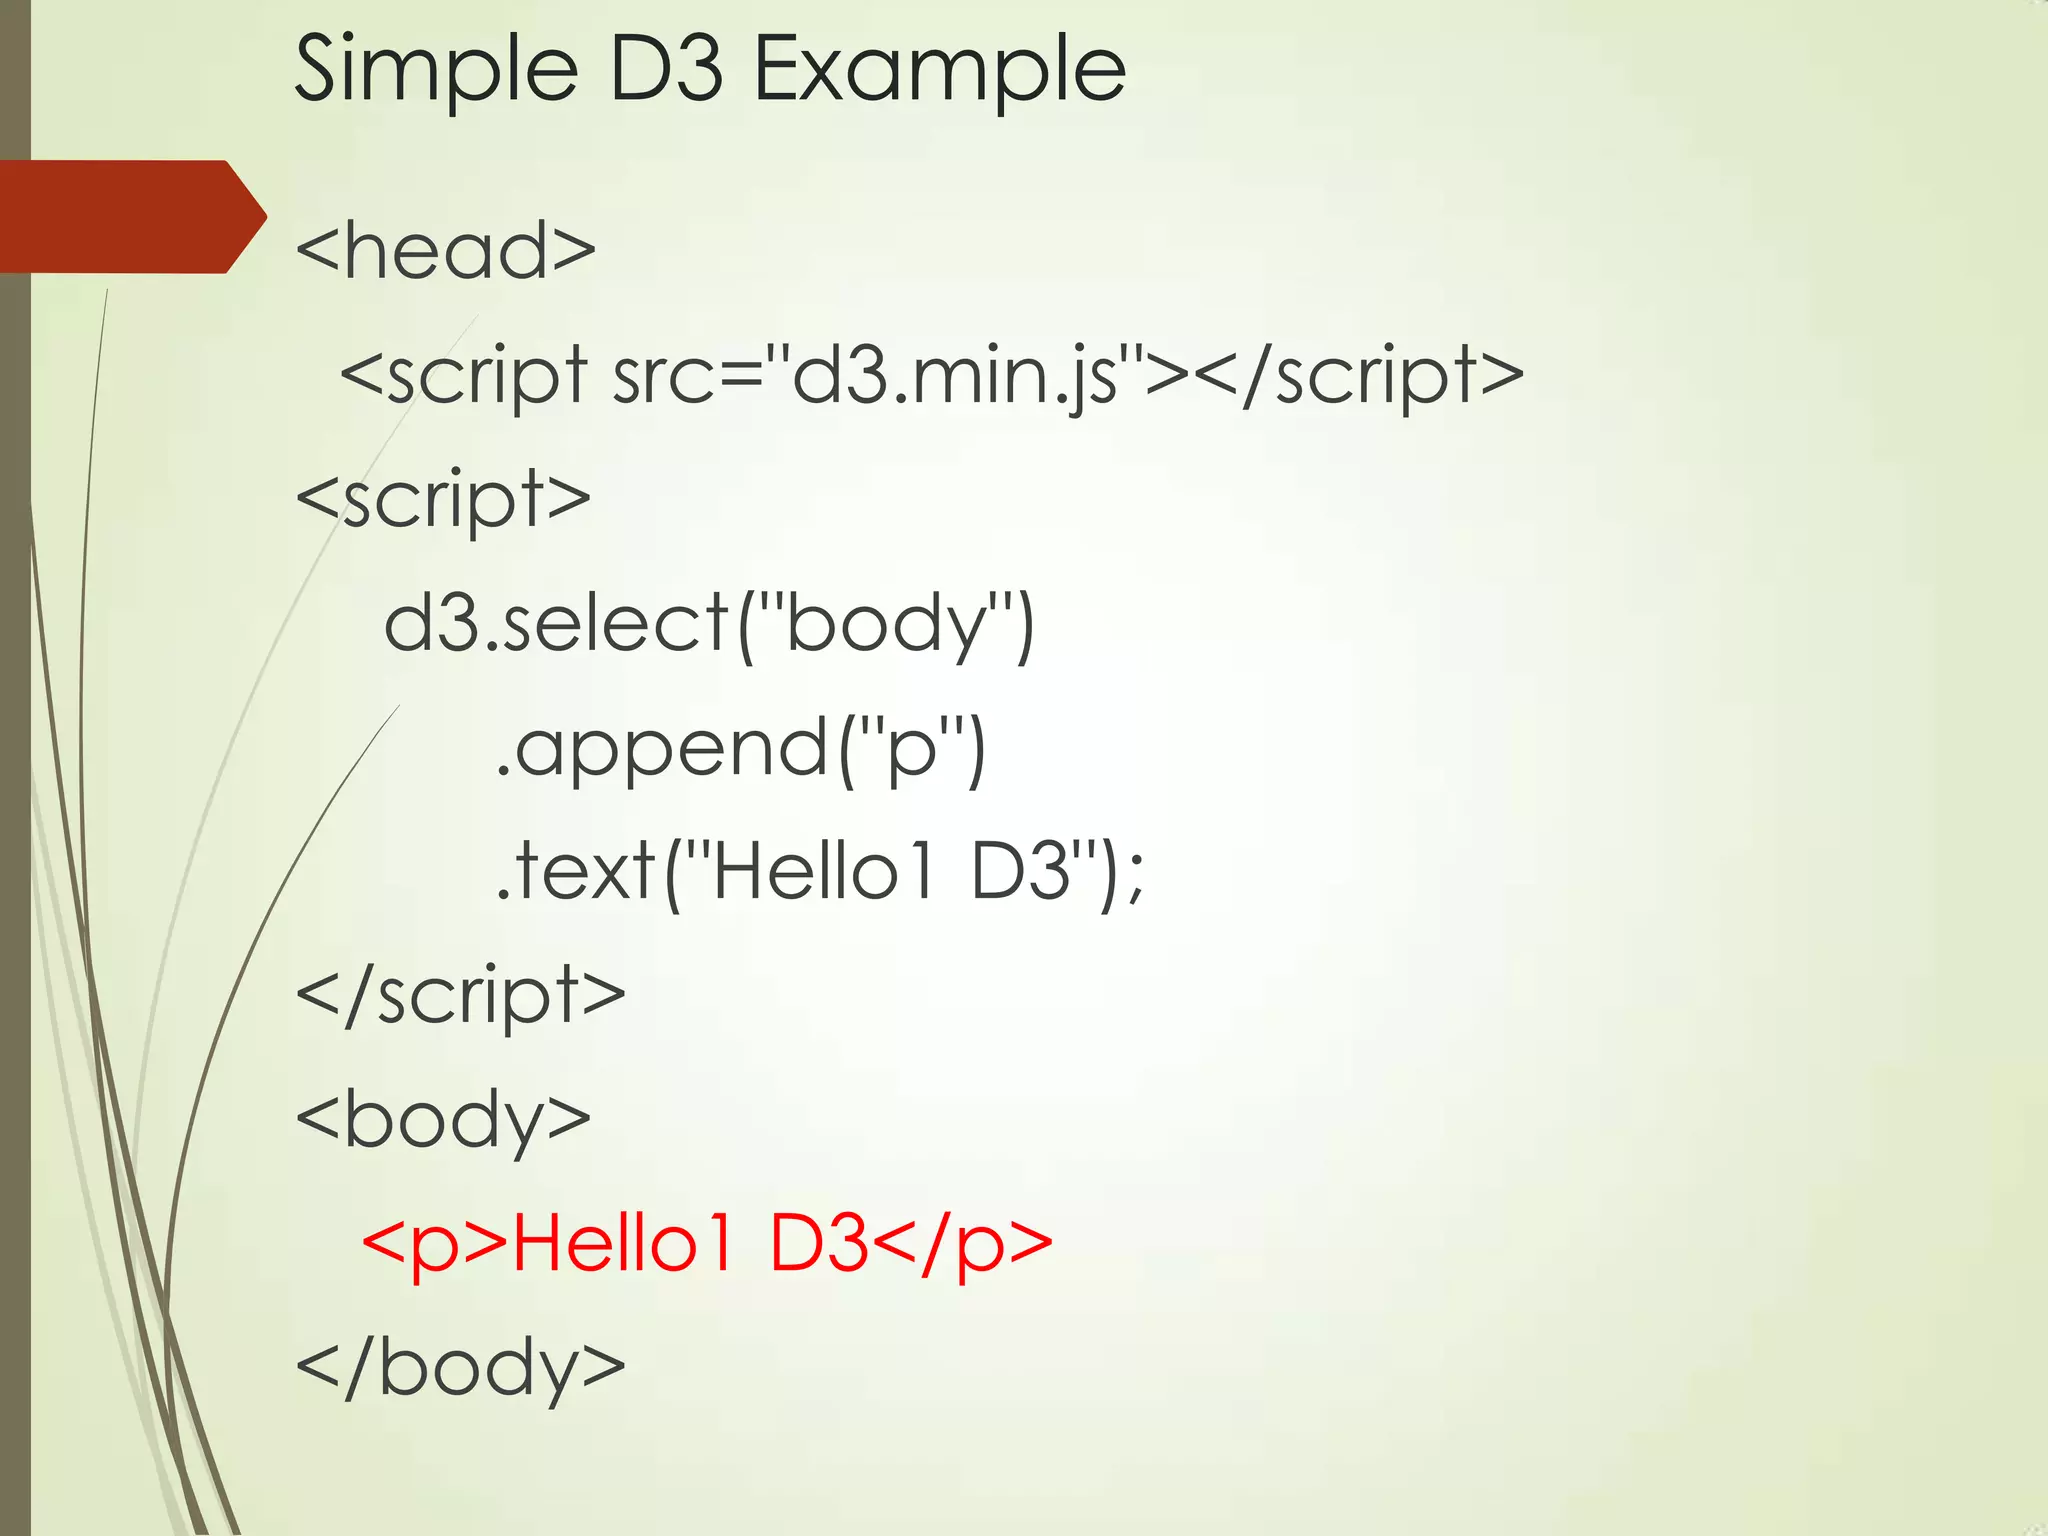
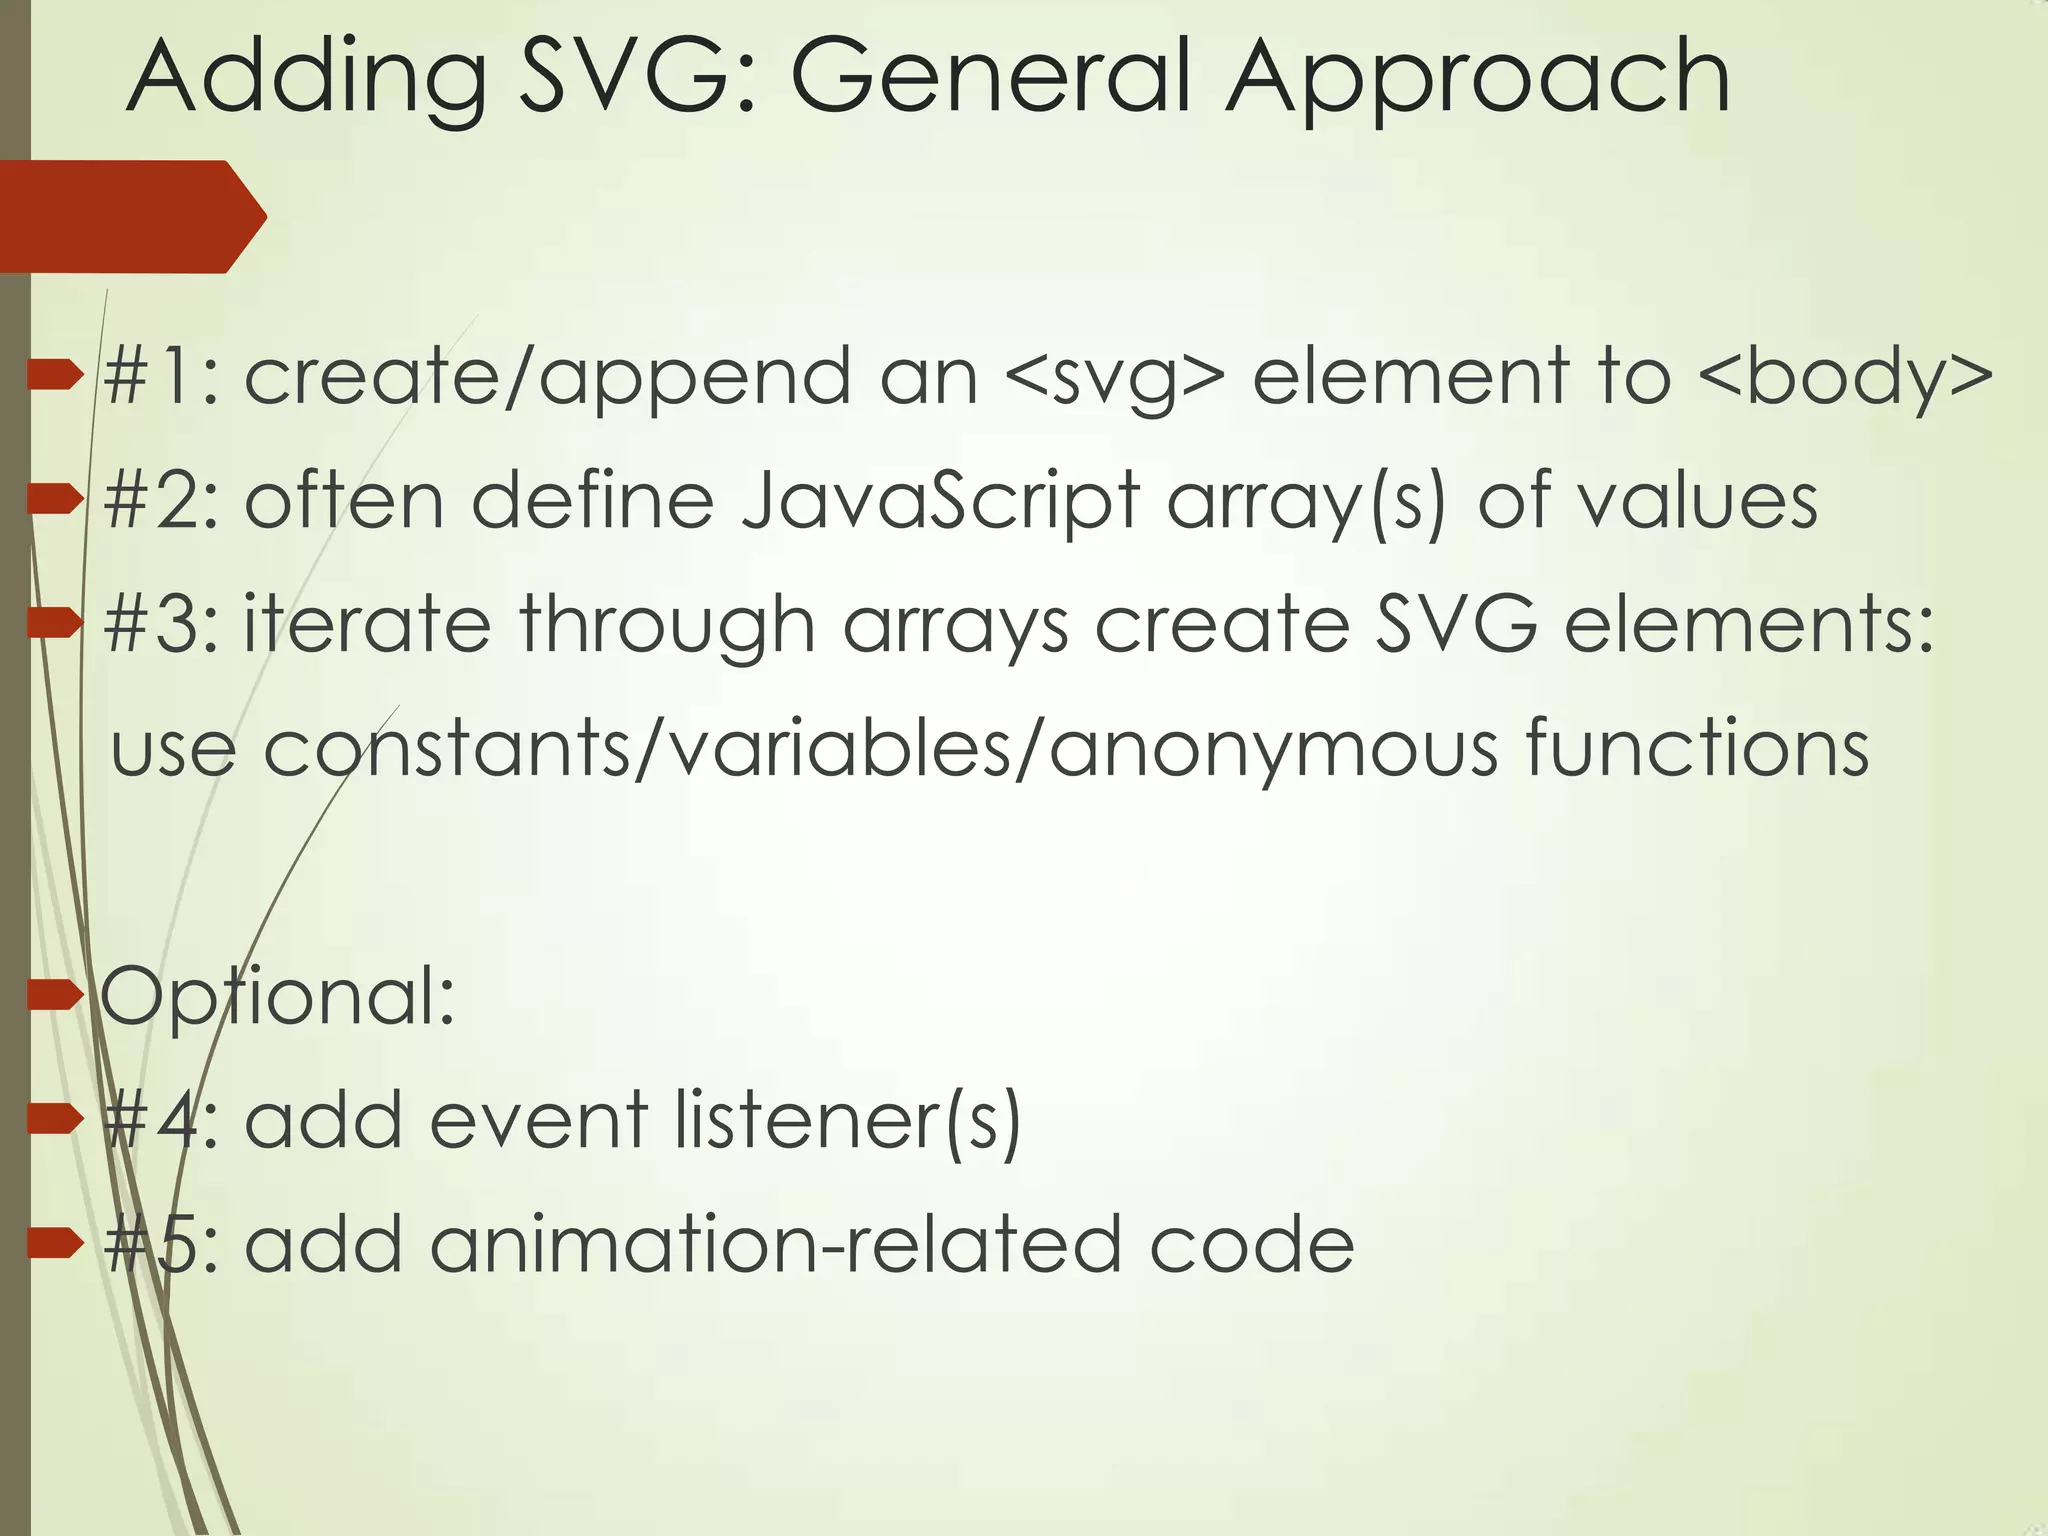
This document provides an overview of a presentation on using D3 for data visualization on desktops, smartphones, and Google Glass. It discusses how D3 works, examples of basic charts like scatter plots and bar charts using D3, and how to incorporate features like mouse interactions, animations, filters and gradients. It also covers using D3 with technologies like Android, PhoneGap, and Google Glass to create mobile visualizations.


![Vibe Coding vs. Spec-Driven Development [Free Meetup]](https://cdn.slidesharecdn.com/ss_thumbnails/vibecodingvsspecdrivendevelopment-251209105622-43f455e7-thumbnail.jpg?width=640&height=640&fit=bounds)


