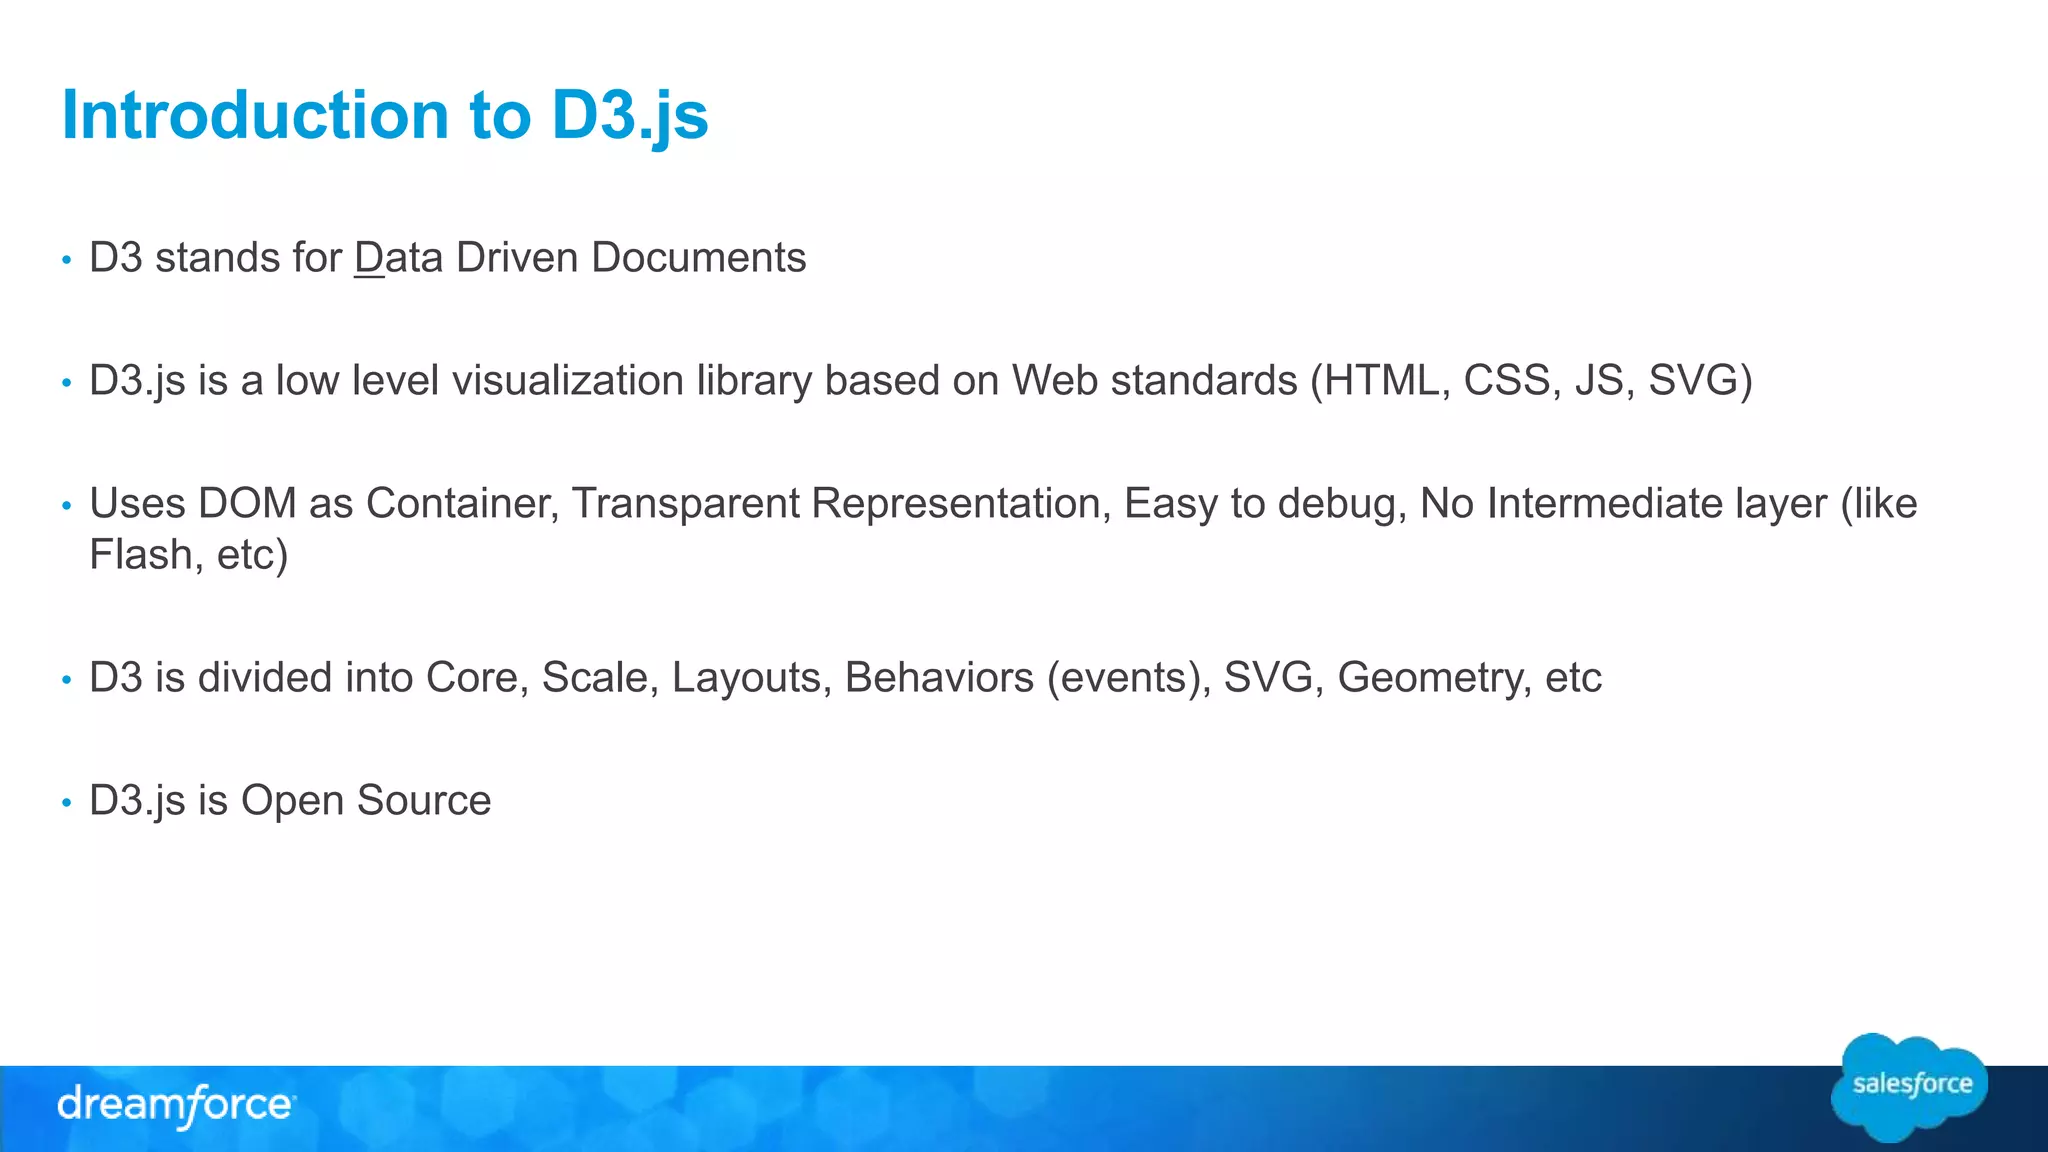
The document introduces d3.js, a low-level visualization library focused on data-driven documents, highlighting its structure and usage for data binding, selections, and basic SVG shapes. It compares d3.js to other frameworks, emphasizing its strength in unique visualizations but also the steep learning curve involved. Additionally, it discusses the Salesforce Analytics API for accessing report data and notes that d3.js does not provide built-in charting options like some other libraries.
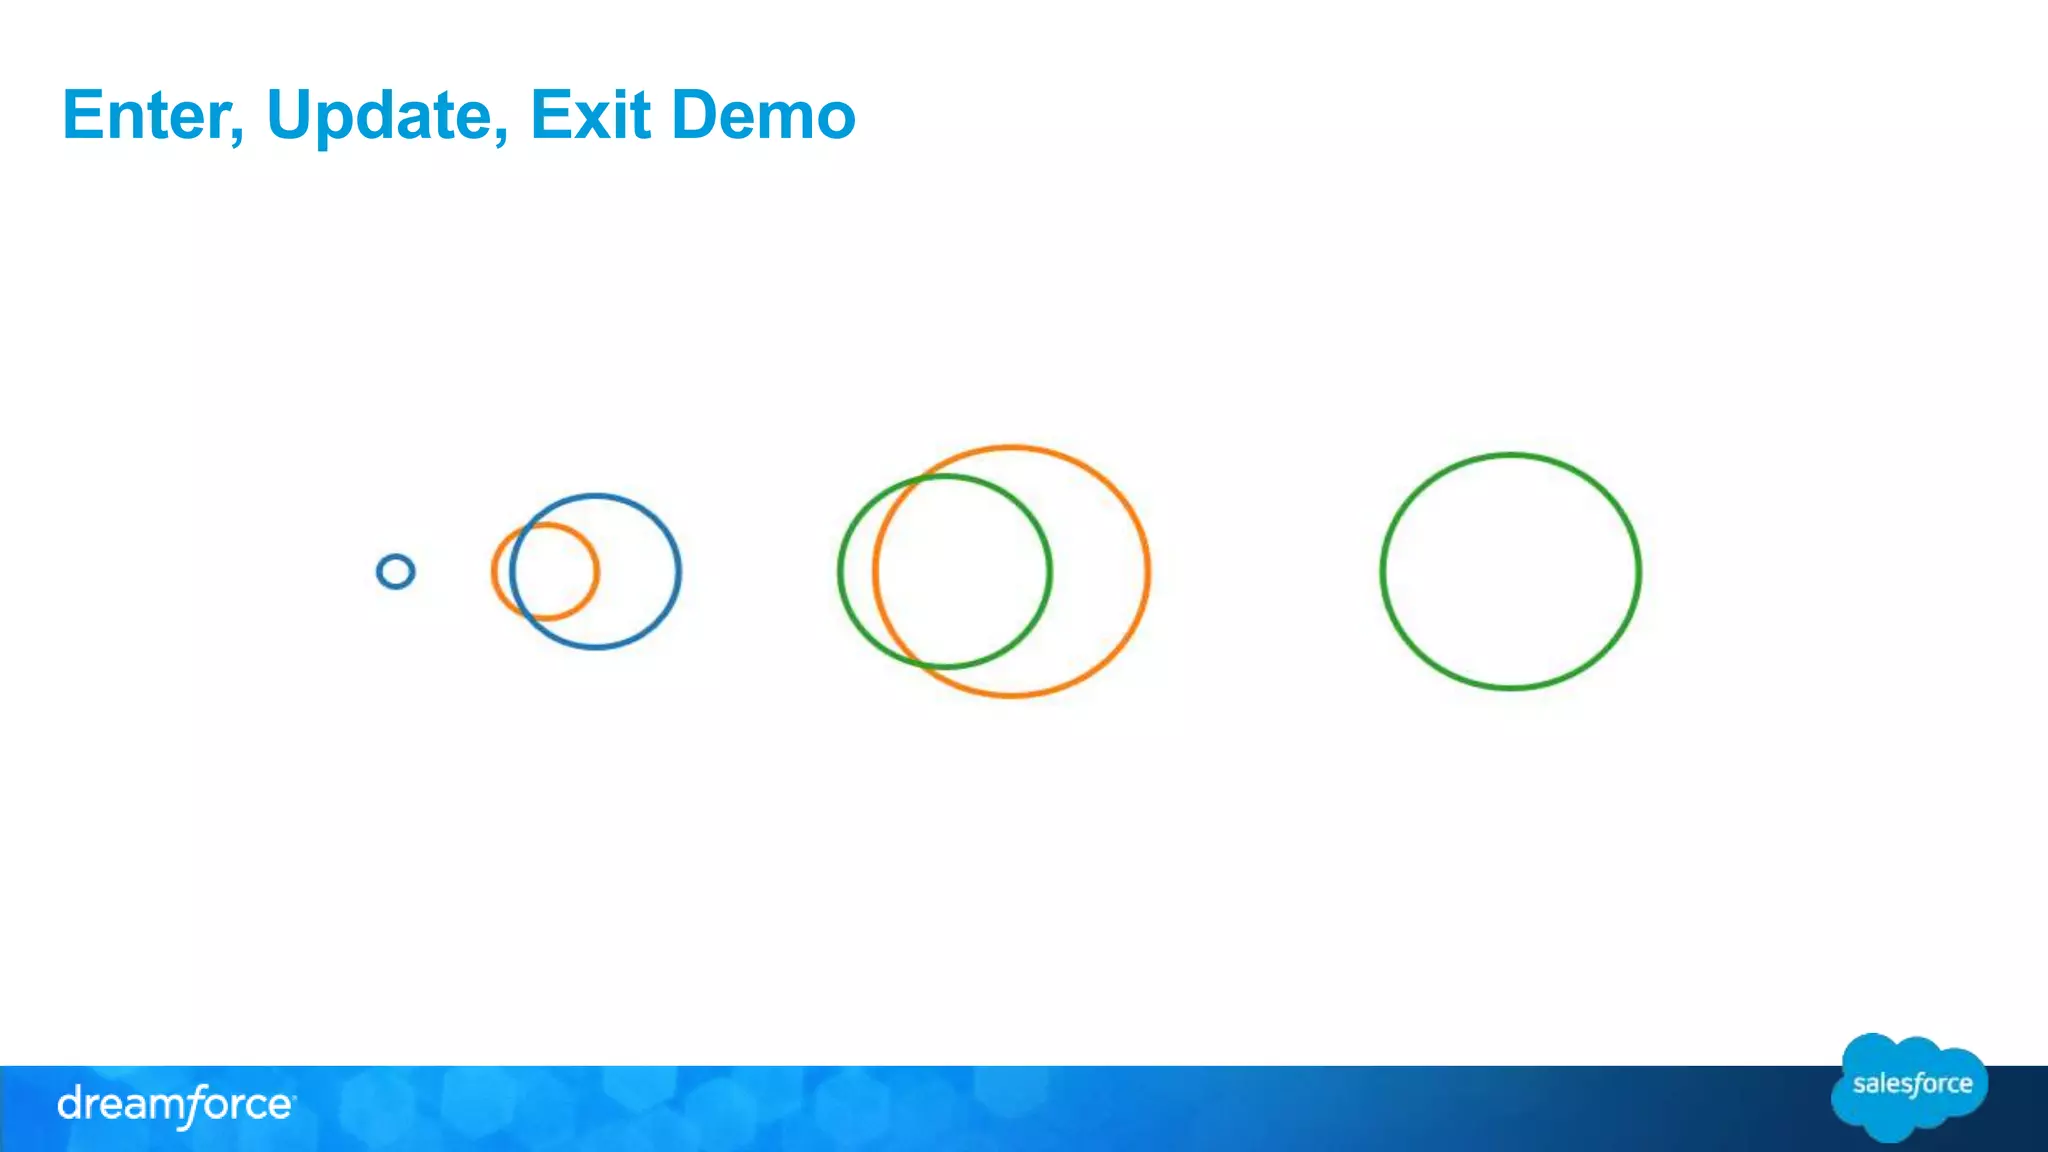
![Data Joins - Enter, Update, Exit
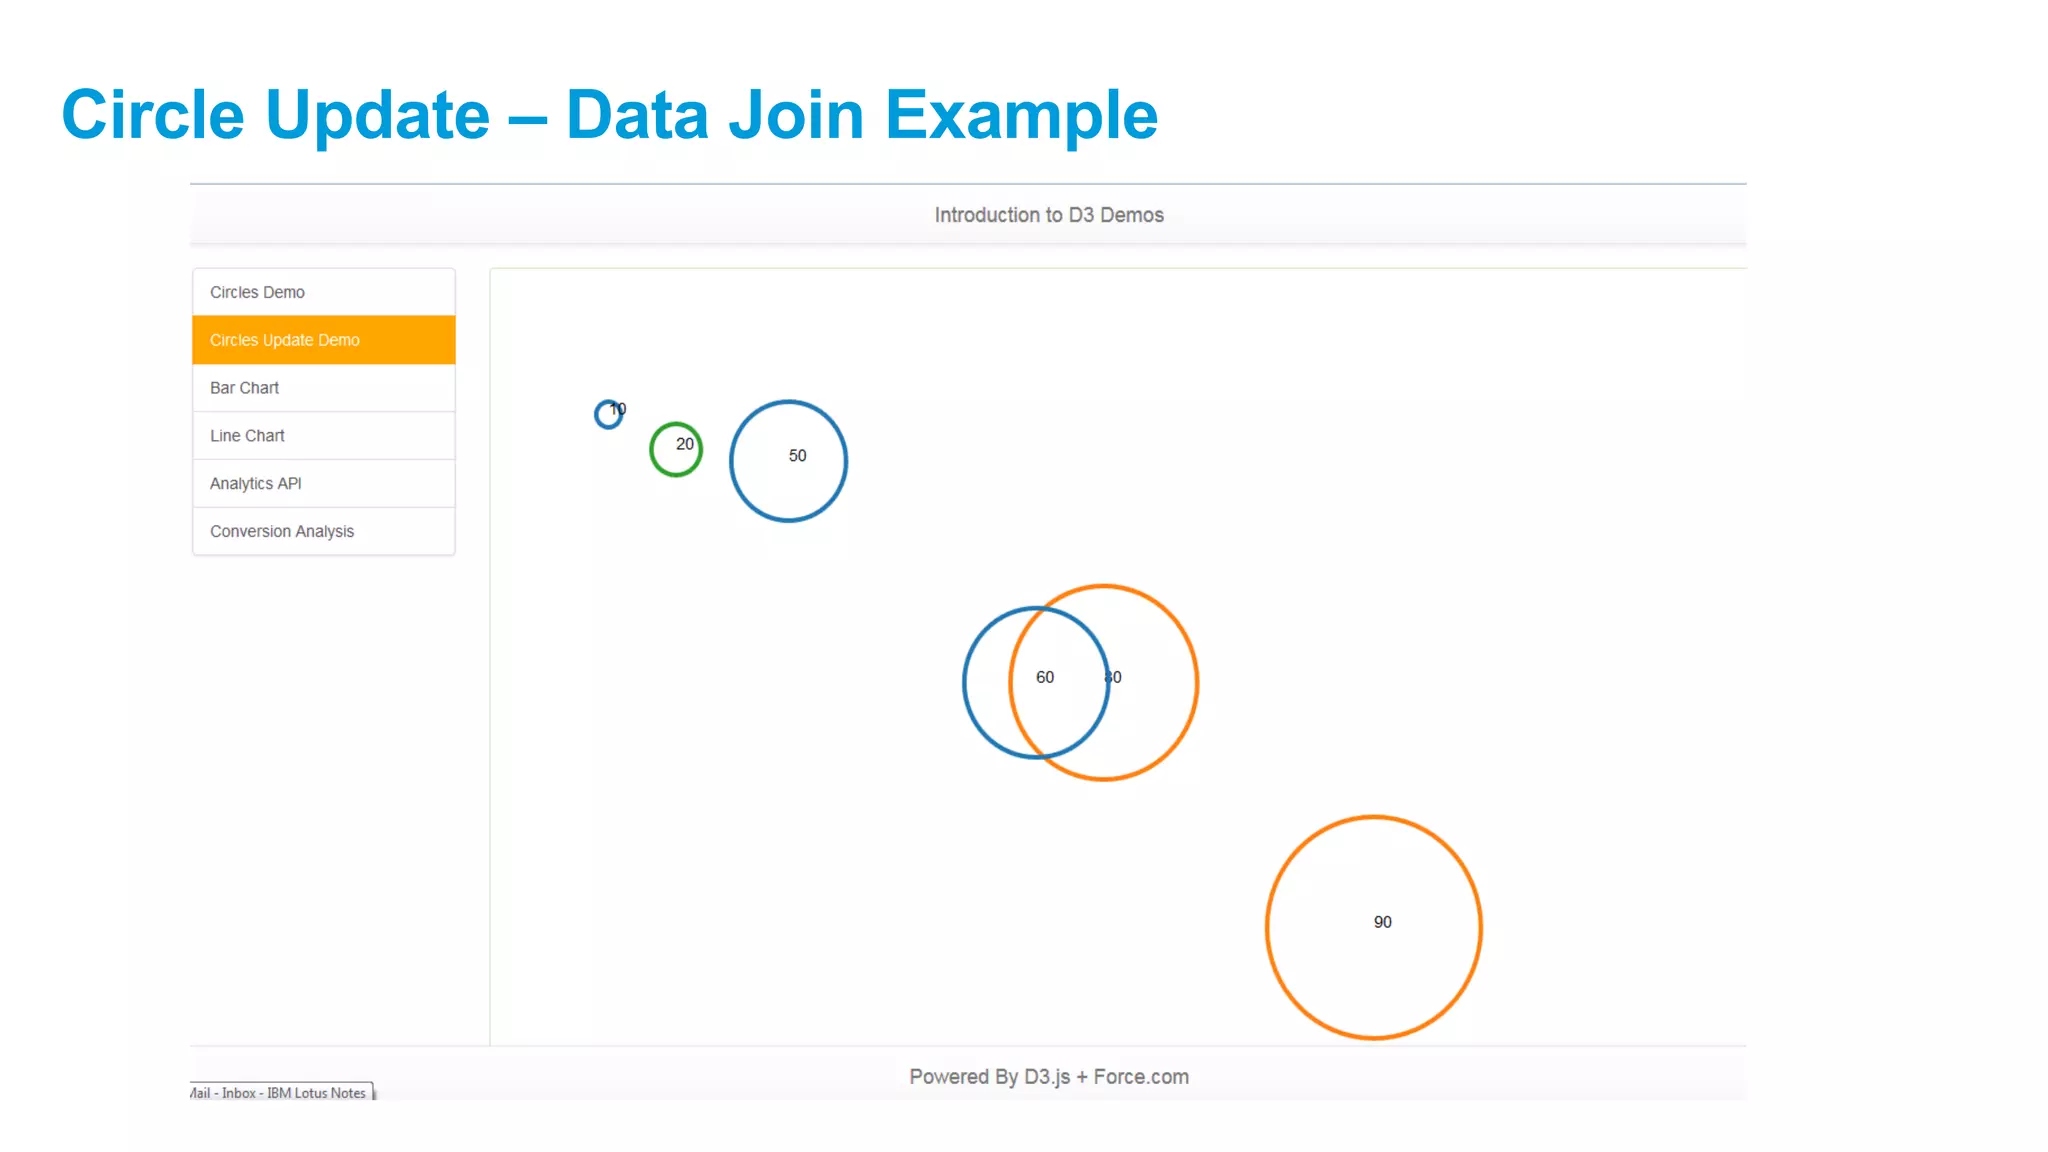
Enter – [1, 2, 3, 4, 5]
Update – [1, 3, 5, 7]
Exit – (since there is no data in scope for this elements)
Circle.exit().remove(); (this line will trigger remove element , continued from last example)
1 2 543
1 3 5 7
2 4](https://image.slidesharecdn.com/introductiontod3-public-copy-141222194816-conversion-gate01/75/Dreamforce-2014-Introduction-to-d3-js-8-2048.jpg)