The document provides an overview of scalable vector graphics (SVG) and the D3.js JavaScript library for data visualization. It details various SVG elements, attributes, and basic coding examples, alongside D3.js integration for creating interactive charts and data-driven visual presentations. Additionally, it discusses using D3.js with Drupal, including module features and custom implementations for data visualization within web applications.
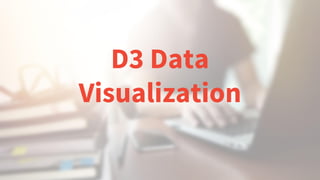


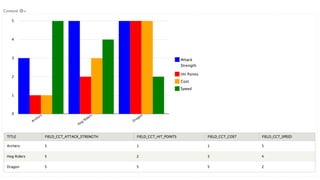
![…
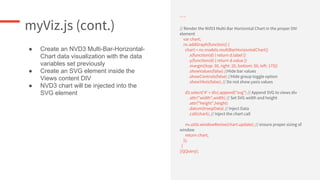
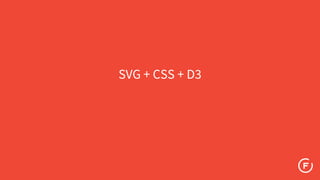
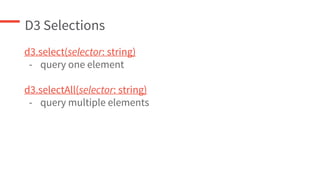
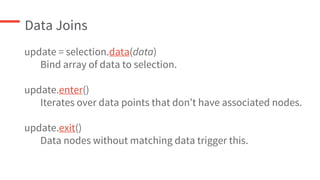
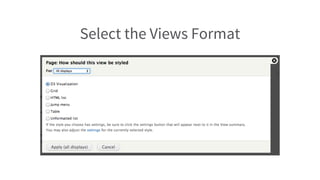
var dataset = [ 5, 10, 15, 20, 25 ];
var circles = svg.selectAll("circle")
.data(dataset)
.enter()
.append("circle")
.attr("r", function(d) {
return d;
})
.attr("cx", function(d, i) {
// i is the current data node index
return (i * 50) + 25;
})
.attr("cy", h/2)
.attr("fill","red");](https://image.slidesharecdn.com/d3datavisualization-150718042215-lva1-app6891/85/D3-data-visualization-32-320.jpg)


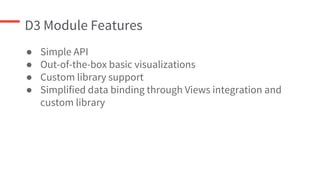
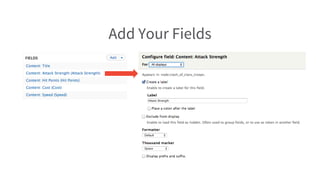
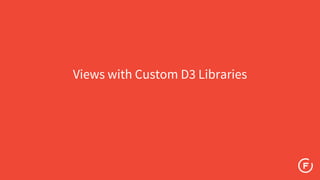
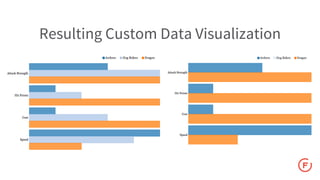
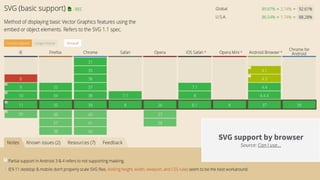
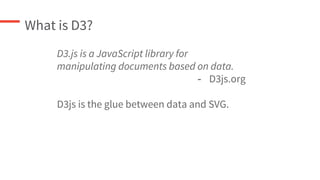
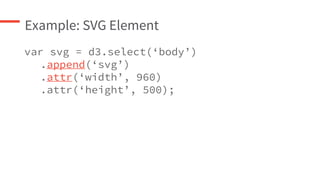
![d3.myViz.libraries.info
name = My Vis
description = My Vis custom D3 display
files[js][] = myvis.js
files[js][] = nv.d3.min.js
files[css][] = myvis.css
version = 0.1
dependencies[] = d3.extend
dependencies[] = d3.tooltip
views[version] = 3.0
views[fields][rows][__data_type] = 2dnnv
views[fields][rows][x_label][label] = X label
views[fields][rows][x_label][type] = string
views[fields][rows][x_label][description] = The label that
appears on the X axis.
views[fields][rows][value] = { __repeated: TRUE, __cardinality: 0,
label: Numeric value, type: integer, description: The numeric
value that will be used to plot each dot (circle) on the line }
views[fields][legend][__cardinality] = 0
views[fields][legend][__data_type] = 1dn
views[fields][legend][label] = Line label
views[fields][legend][description] = The meaning of each
different line.
views[fields][legend][type] = string
views[settings] = views-settings.php
● Same as out the box D3 module
custom library info file with some
exceptions](https://image.slidesharecdn.com/d3datavisualization-150718042215-lva1-app6891/85/D3-data-visualization-47-320.jpg)
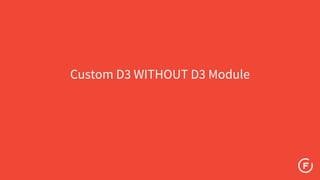
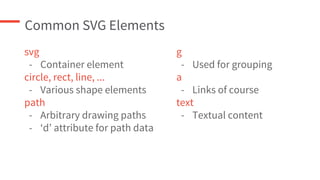
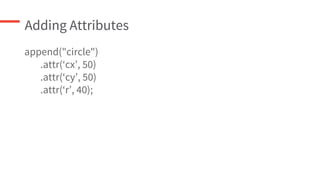
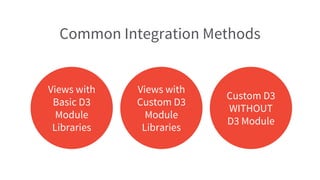
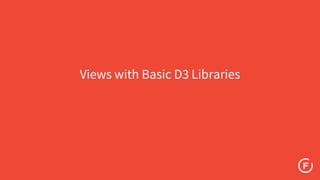
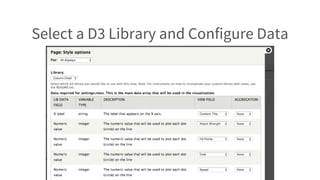
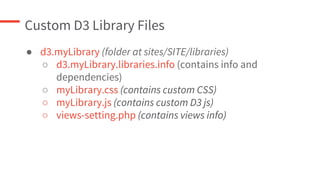
![myViz.js (cont.)
…
var troopData = [];
// Force rows array into data structure noted above
for (var i in rows) {
var row = rows[i];
var items = [];
for (var j in row) {
var item = row[j];
items.push({
"label" : key[j],
"value" : item
});
}
troopData.push({
"key" : yLabels[i],
"values" : items
});
}
...
● Rearrange data structure to match the
following structure:
"key": "Dragon",
"color": "#E80CC8",
"values": [
{
"label" : "Cost" ,
"value" : 5
},
{
"label" : "Strength" ,
"value" : 5
}
]](https://image.slidesharecdn.com/d3datavisualization-150718042215-lva1-app6891/85/D3-data-visualization-49-320.jpg)