Download as ODP, PPTX


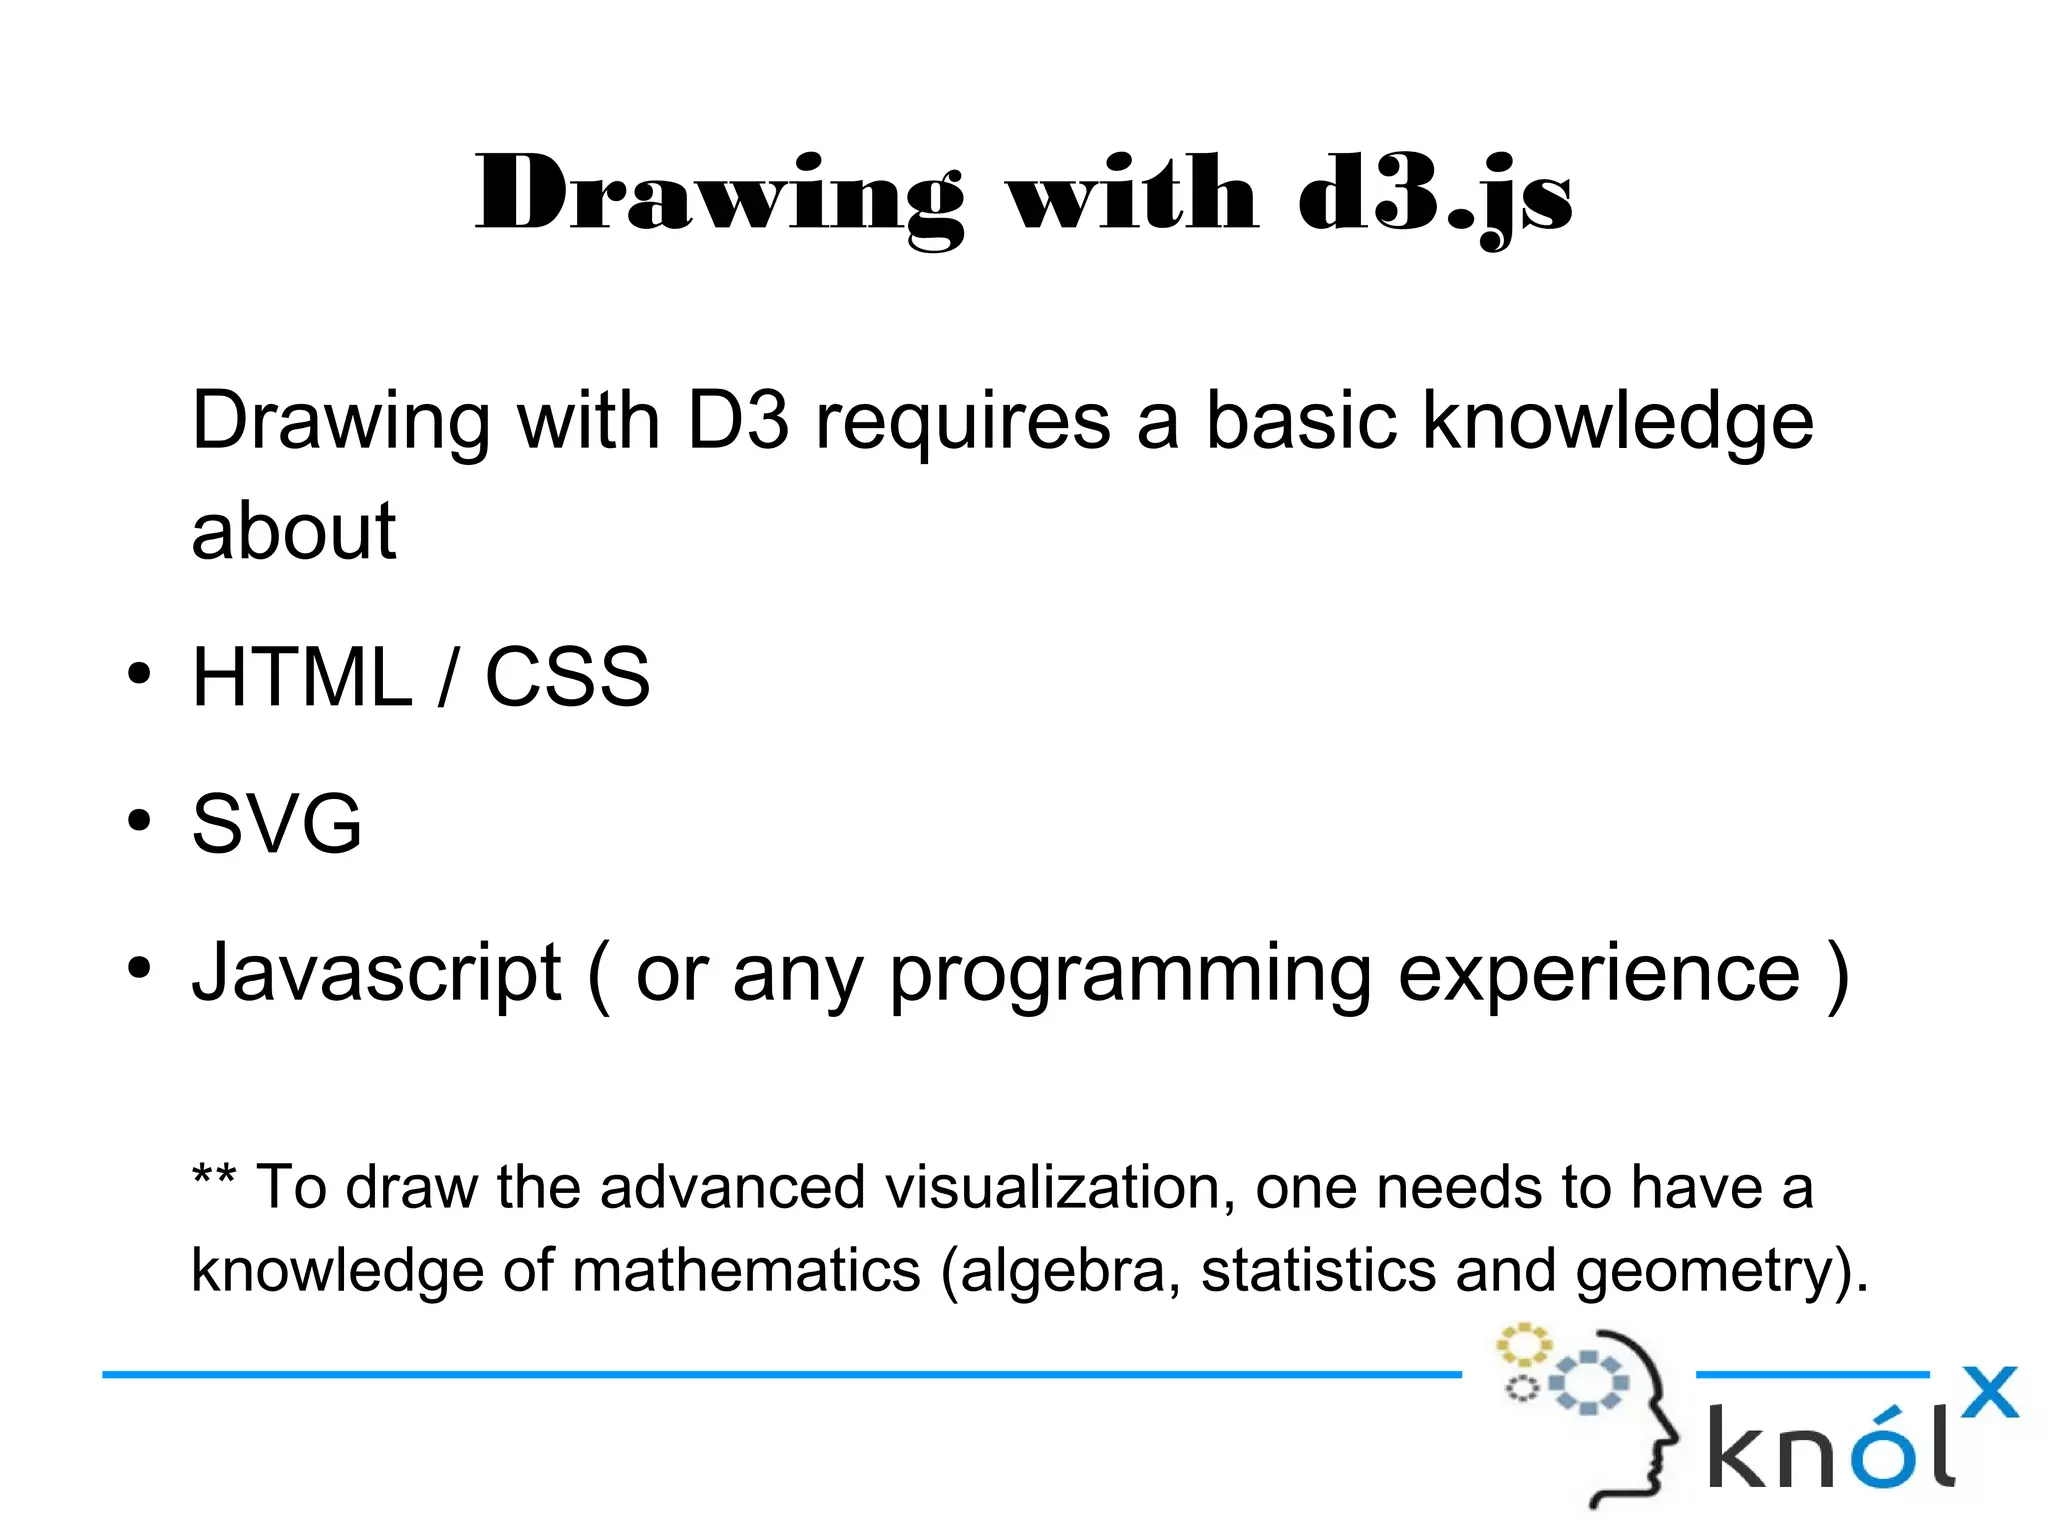
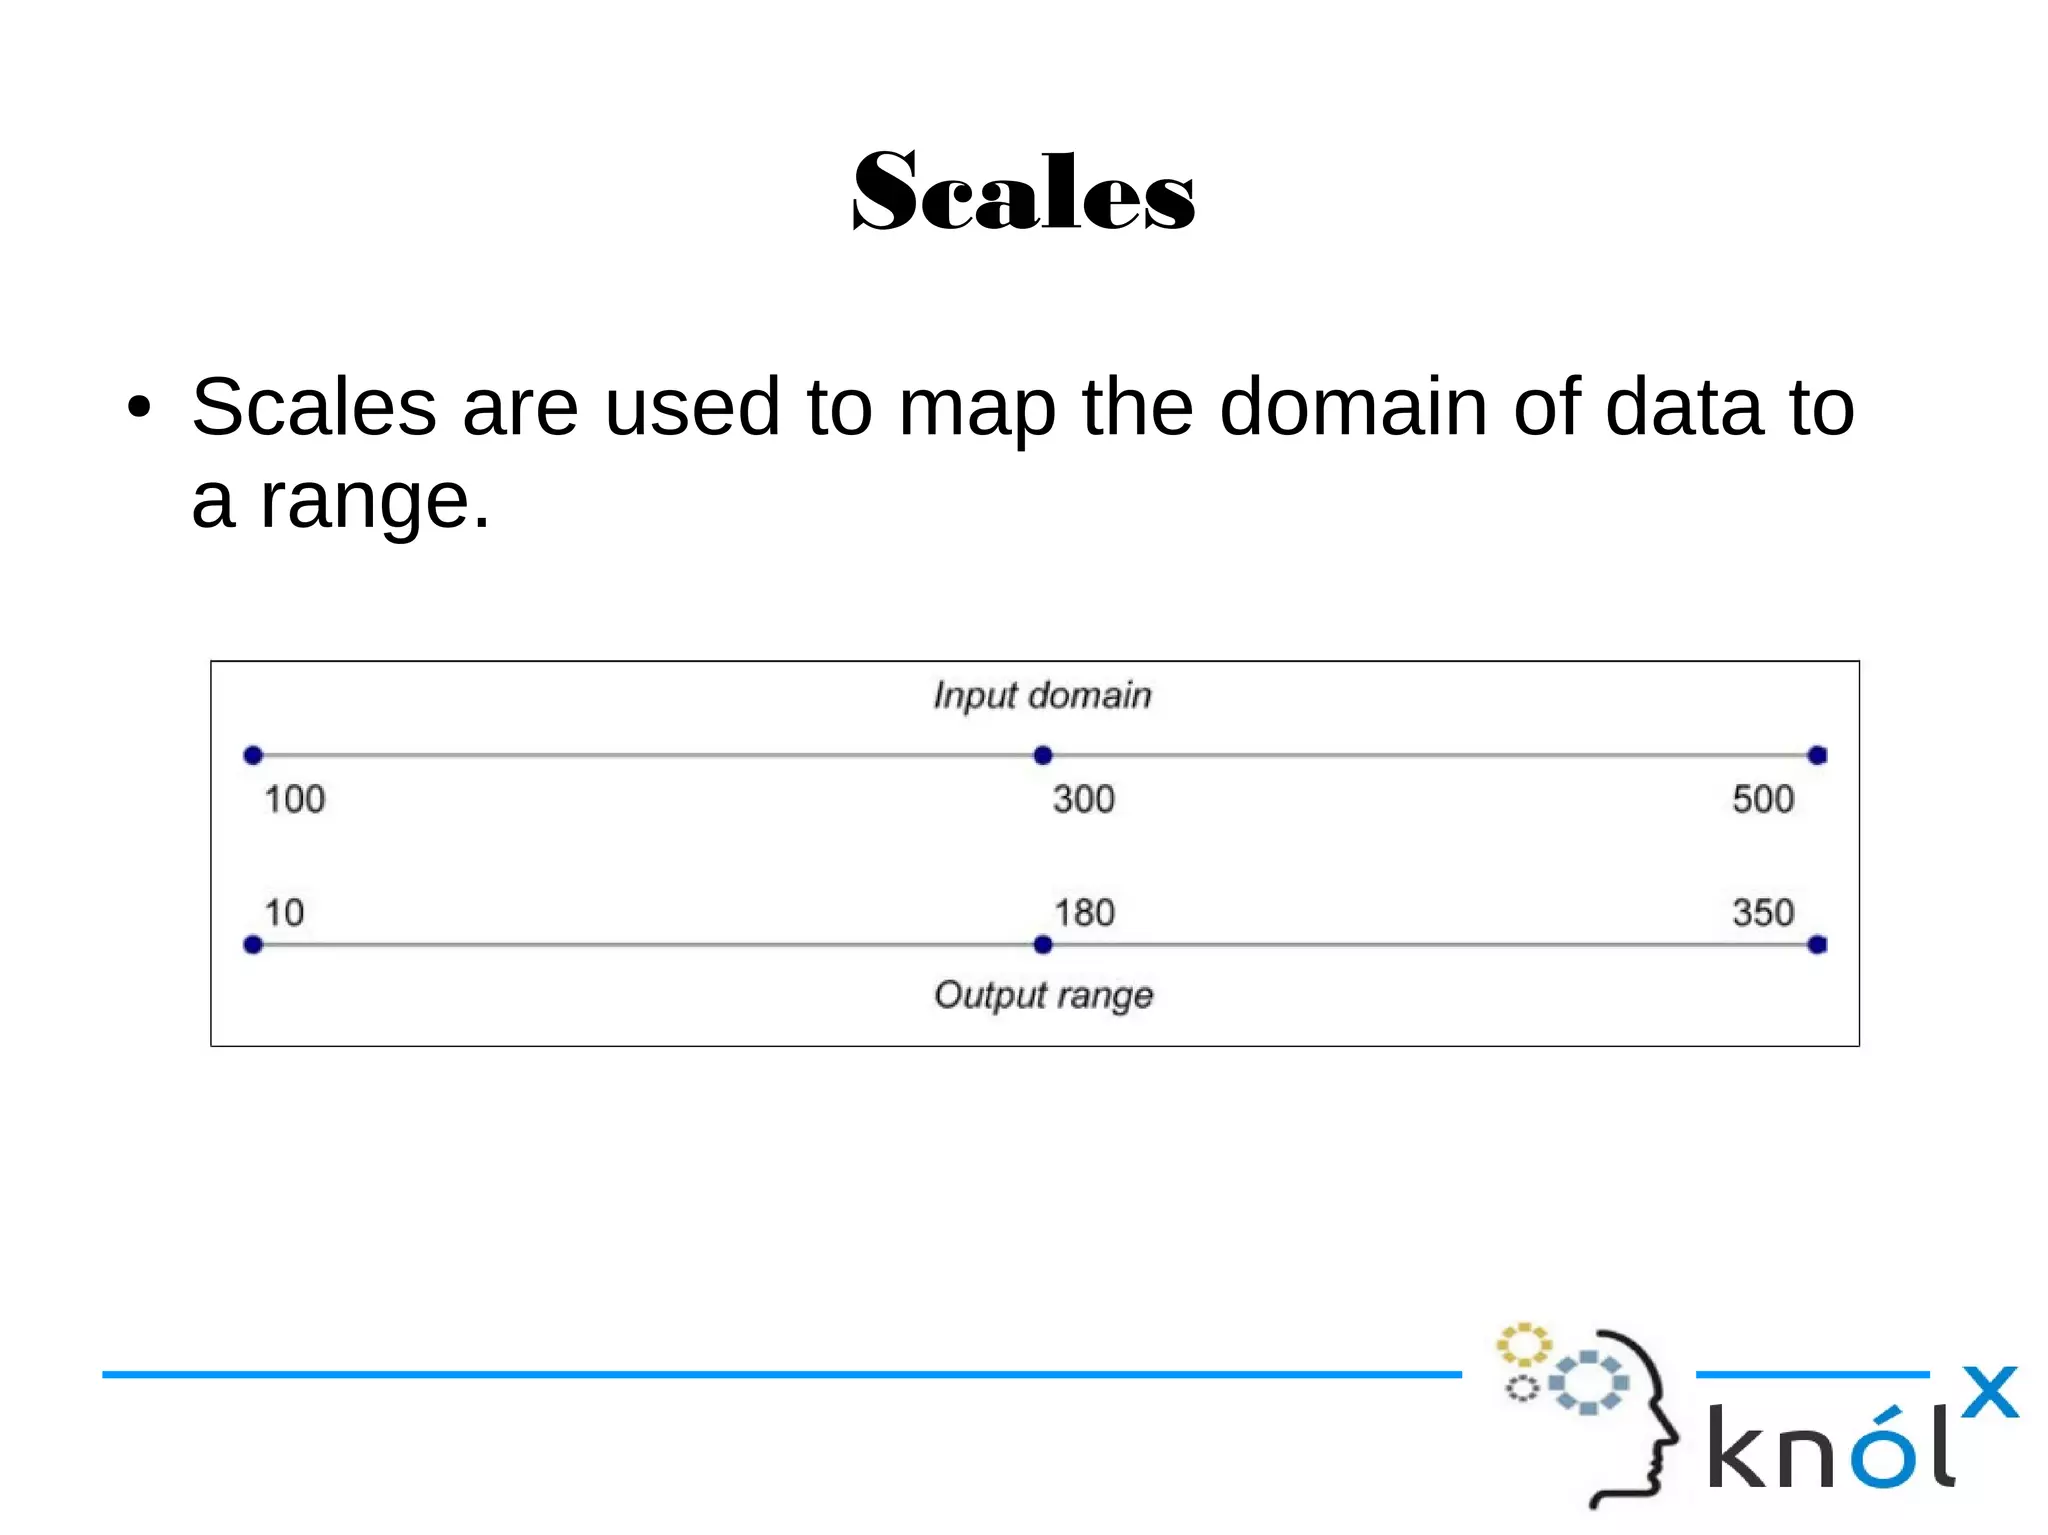
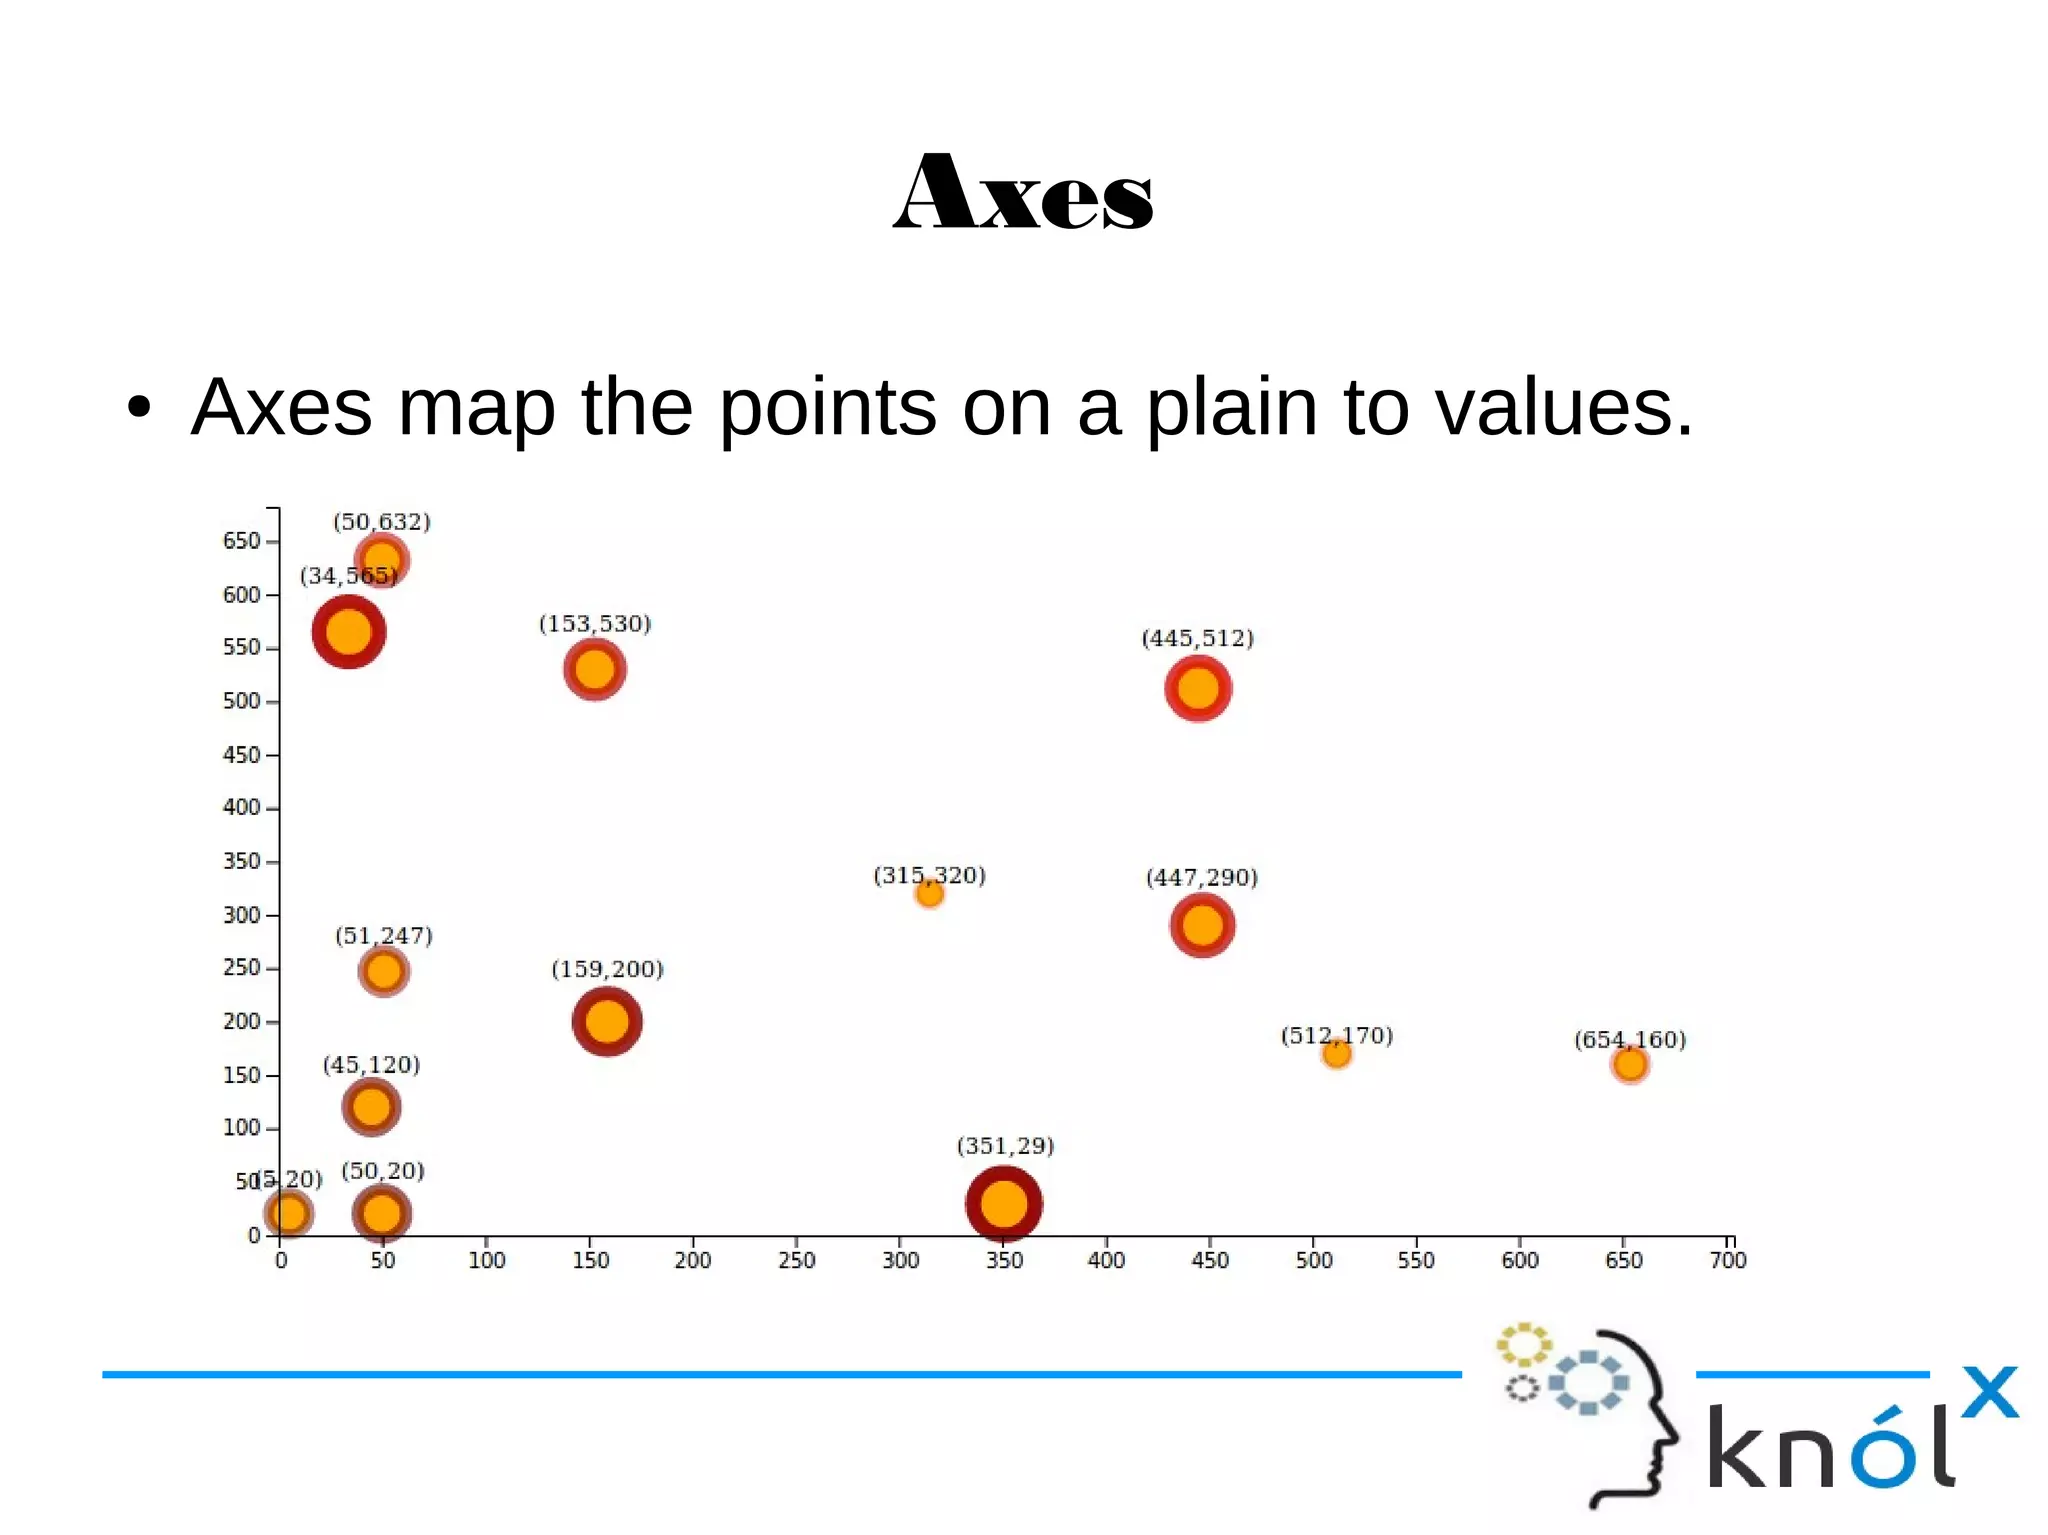


The document introduces d3.js, a JavaScript library for drawing charts and visualizing data, emphasizing its capability to handle large datasets and develop real-time dashboards. It notes that d3.js does not provide pre-defined charts and requires knowledge of HTML, CSS, and JavaScript, along with basic mathematics for advanced visualizations. The agenda covers the overview, significance, drawing techniques, scales, and axes in d3.js.