The document discusses the significance of data visualization in understanding data's relevance through visual contexts, emphasizing the importance of engaging and interactive designs. It compares tools like D3 and jQuery for data binding and visual representation, highlighting the strengths of each, particularly D3's ability to handle SVG graphics. Finally, it provides resources, examples, and best practices for working with D3.js in web applications.

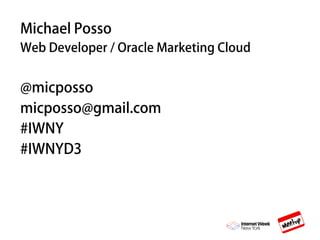


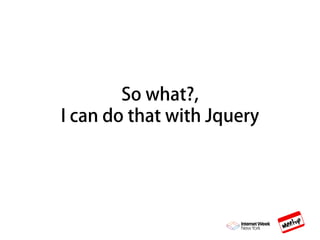
![D3 Application Document Structure
<!DOCTYPE HTML>
<html>
<style>
<body>
[CONTENT]
<script src="d3.js"></script>
<script src="myscripts.js"></script>
</body>
</html>](https://image.slidesharecdn.com/datavisualizationwithd3-may19-160520172416/85/Data-visualization-with-d3-may19-19-320.jpg)
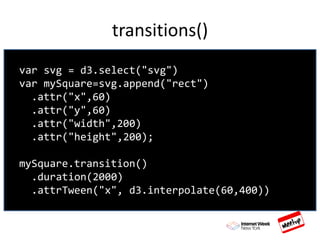
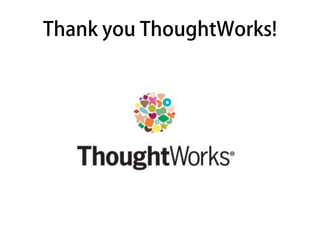
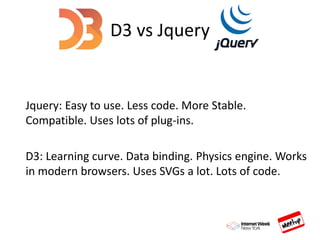
![DATA()
d3.selectAll('p')
.data([0, 1, 2, 3, 4, 5]);](https://image.slidesharecdn.com/datavisualizationwithd3-may19-160520172416/85/Data-visualization-with-d3-may19-23-320.jpg)
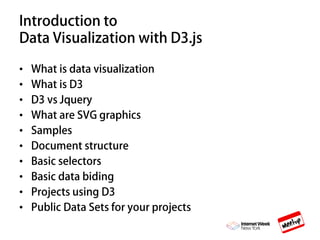
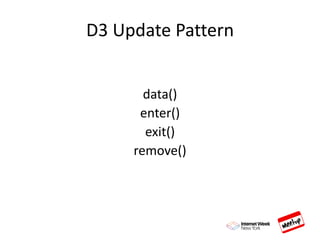
![ENTER()
d3.selectAll('p')
.data([0, 1, 2, 3, 4, 5])
.enter();](https://image.slidesharecdn.com/datavisualizationwithd3-may19-160520172416/85/Data-visualization-with-d3-may19-24-320.jpg)


![제 23회 보아즈(BOAZ) 빅데이터 컨퍼런스 - [MBOAX] : ABSA를 활용한 소비자 반응 분석 기반 운영 효율화 대시보드 설계](https://cdn.slidesharecdn.com/ss_thumbnails/3-1boaz23rdconferencemboax-260203102709-9d519923-thumbnail.jpg?width=640&height=640&fit=bounds)


