Download to read offline
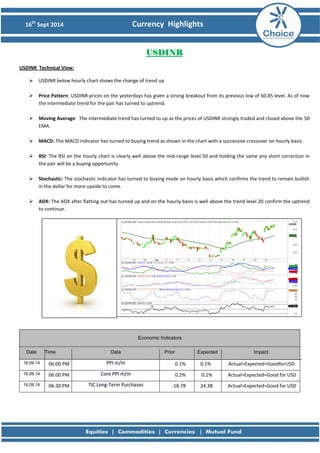
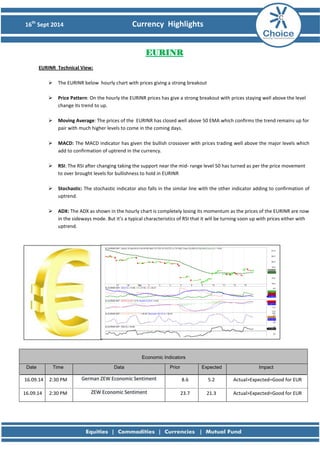
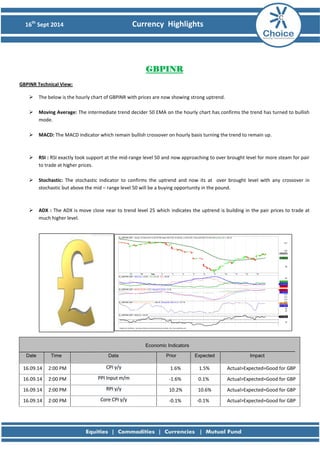
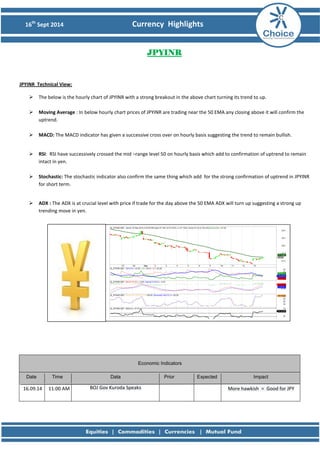


The document provides a technical analysis and overview of currency movements for the USDINR, EURINR, GBPINR, JPYINR for September 16th, 2014. It analyzes trends and indicators including prices breaking above or below levels, movements of the 50 EMA, MACD giving bullish or bearish crossovers, RSI and stochastic indicators moving above or below mid-range levels, and ADX moving above or below trend levels. It also lists upcoming economic indicators and forecasts their potential impact on currencies.


