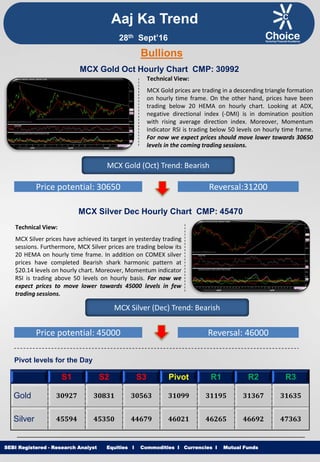
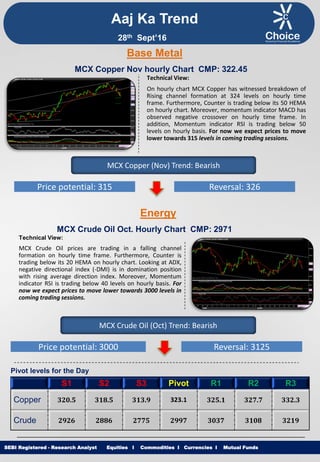
Equities I Commodities I Currencies I Mutual Funds
Aaj Ka Trend
Technical View:
MCX Gold prices are trading in a descending triangle formation
on hourly time frame. On the other hand, prices have been
trading below 20 HEMA on hourly chart. Looking at ADX,
negative directional index (-DMI) is in domination position
with rising average direction index. Moreover, Momentum
Indicator RSI is trading below 50 levels on hourly time frame.
For now we expect prices should move lower towards 30650
levels in the coming trading sessions.
SEBI Registered - Research Analyst Equities I Commodities I Currencies I Mutual Funds
Bullions
MCX Gold Oct Hourly Chart CMP: 30992
MCX Gold (Oct) Trend: Bearish
Price potential: 30650 Reversal:31200
MCX Silver Dec Hourly Chart CMP: 45470
Technical View:
MCX Silver prices have achieved its target in yesterday trading
sessions. Furthermore, MCX Silver prices are trading below its
20 HEMA on hourly time frame. In addition on COMEX silver
prices have completed Bearish shark harmonic pattern at
$20.14 levels on hourly chart. Moreover, Momentum indicator
RSI is trading above 50 levels on hourly basis. For now we
expect prices to move lower towards 45000 levels in few
trading sessions.
MCX Silver (Dec) Trend: Bearish
Price potential: 45000 Reversal: 46000
Pivot levels for the Day
S1 S2 S3 Pivot R1 R2 R3
Gold 30927 30831 30563 31099 31195 31367 31635
Silver 45594 45350 44679 46021 46265 46692 47363
28th Sept’16
Equities I Commodities I Currencies I Mutual Funds
Technical View:
On hourly chart MCX Copper has witnessed breakdown of
Rising channel formation at 324 levels on hourly time
frame. Furthermore, Counter is trading below its 50 HEMA
on hourly chart. Moreover, momentum indicator MACD has
observed negative crossover on hourly time frame. In
addition, Momentum indicator RSI is trading below 50
levels on hourly basis. For now we expect prices to move
lower towards 315 levels in coming trading sessions.
SEBI Registered - Research Analyst Equities I Commodities I Currencies I Mutual Funds
MCX Copper Nov hourly Chart CMP: 322.45
MCX Copper (Nov) Trend: Bearish
Price potential: 315 Reversal: 326
MCX Crude Oil Oct. Hourly Chart CMP: 2971
Technical View:
MCX Crude Oil prices are trading in a falling channel
formation on hourly time frame. Furthermore, Counter is
trading below its 20 HEMA on hourly chart. Looking at ADX,
negative directional index (-DMI) is in domination position
with rising average direction index. Moreover, Momentum
indicator RSI is trading below 40 levels on hourly basis. For
now we expect prices to move lower towards 3000 levels in
coming trading sessions.
MCX Crude Oil (Oct) Trend: Bearish
Price potential: 3000 Reversal: 3125
Pivot levels for the Day
S1 S2 S3 Pivot R1 R2 R3
Copper 320.5 318.5 313.9 323.1 325.1 327.7 332.3
Crude 2926 2886 2775 2997 3037 3108 3219
Base Metal
Energy
Aaj Ka Trend
28th Sept’16
Equities I Commodities I Currencies I Mutual FundsSEBI Registered - Research Analyst Equities I Commodities I Currencies I Mutual Funds
Other Base Metals & Energy
S1 S2 S3 Pivot R1 R2 R3 Trend
Copper 320.5 318.5 313.9 323.1 325.1 327.7 332.3
Aluminum 108.3 107.4 105.5 109.3 110.2 111.2 113.1
Lead 128.8 127.1 124.5 129.8 131.4 132.4 135.1
Nickel 684.0 667.9 634.6 701.2 717.3 734.5 767.8
Zinc 151.6 149.3 145.3 153.4 155.6 157.4 161.5
Natural Gas 202.5 201.5 199.0 204.0 205.0 206.5 209.0
Fundamental News:
 Gold prices edged lower during Europe's session on Tuesday, as market sentiment improved amid the view that
U.S. presidential candidate Hillary Clinton did better than her rival Donald Trump in a closely-watched television
debate.
 Gold prices were lower during North America's session on Tuesday, extending overnight losses as markets
declared Democrat Hillary Clinton as the winner of her first U.S. presidential debate with Republican Donald
Trump.
 Crude oil futures fell on Tuesday as optimism faded for an output-limiting deal from an oil producer meeting in
Algeria that has so far failed to yield any agreement to curb one of the worst supply gluts in history.
 Oil extended losses Tuesday as hopes of an output curb accord in Algiers this week faded.
 Oil prices plunged nearly 3% during North American hours on Tuesday, extending overnight losses, after both
Saudi Arabia and Iran played down expectations for a deal to freeze or cut oil production at the closely watched
informal OPEC meeting on Wednesday.
 Saudi Arabia and Iran on Tuesday dashed hopes that OPEC oil producers could clinch an output-limiting deal in
Algeria this week as sources said the group and non-member Russia were still trying to bridge differences
between the kingdom and Tehran.
 U.S. natural gas futures wobbled below the highest level since January 2015 on Tuesday, as prices continued to
draw support from forecasts showing unusually warm temperatures across most parts of the continental U.S. in
the days ahead.
 The dollar pushed higher against the other major currencies on Tuesday, after data showing that U.S. consumer
confidence unexpectedly jumped in September to more than a nine-year high boosted optimism over the
strength of the economy.
Aaj Ka Trend
28th Sept’16
Equities I Commodities I Currencies I Mutual FundsSEBI Registered - Research Analyst Equities I Commodities I Currencies I Mutual Funds
International Market
Commodity Closing Price
Gold 1328.50
Silver 19.12
Crude Oil 44.63
Brent Crude Oil 46.60
Natural Gas 3.03
COMEX/NYMEX/ICE ( Precious Metals & Energy) Currency & Commodity Index
Currency (Spot) Current Price
USD / INR 66.46
Dollar Index 95.49
EUR / USD 1.12
CRB Index* 183.10
Closing as on 27.09.16 *Closing as on 27.09.16
LME (Base Metals) ( $ per tones)
Commodity Closing Price
Copper 4762
Aluminum 1634
Zinc 2293
Lead 1955
Nickel 10643
SHFE (Base Metals) (Yuan per tones)
Commodity Closing Price
Copper 37270
Aluminum 12380
Zinc 17350
Lead 13450
Closing as on 27.09.16 Closing as on 27.09.16
LME INVENTORY DATA
Aaj Ka Trend
21-Sept-16 22-Sept-16 23-Sept-16 26-Sept-16 27-Sept-16
Aluminium -6600 -8150 -6700 -10701 -10175
Copper -150 -1750 10825 7252 7350
Lead 2200 -200 -25 250 250
Nickel -1002 120 -1686 -854 -504
Zinc -250 -300 -1200 -648 -525
28th Sept’16
Equities I Commodities I Currencies I Mutual Funds
This is solely for information of clients of Choice Broking and does not construe to be an investment advice. It is also not intended as an offer or solicitation
for the purchase and sale of any financial instruments. Any action taken by you on the basis of the information contained herein is your responsibility alone
and Choice Broking its subsidiaries or its employees or associates will not be liable in any manner for the consequences of such action taken by you. We
have exercised due diligence in checking the correctness and authenticity of the information contained in this recommendation, but Choice Broking or any of
its subsidiaries or associates or employees shall not be in any way responsible for any loss or damage that may arise to any person from any inadvertent
error in the information contained in this recommendation or any action taken on basis of this information. Technical analysis studies market psychology,
price patterns and volume levels. It is used to forecast future price and market movements. Technical analysis is complementary to fundamental analysis
and news sources. The recommendations issued herewith might be contrary to recommendations issued by Choice Broking in the company research
undertaken as the recommendations stated in this report is derived purely from technical analysis. Choice Broking has based this document on information
obtained from sources it believes to be reliable but which it has not independently verified; Choice Broking makes no guarantee, representation or warranty
and accepts no responsibility or liability as to its accuracy or completeness. The opinions contained within the report are based upon publicly available
information at the time of publication and are subject to change without notice. The information and any disclosures provided herein are in summary form
and have been prepared for informational purposes. The recommendations and suggested price levels are intended purely for trading purposes. The
recommendations are valid for the day of the report however trading trends and volumes might vary substantially on an intraday basis and the
recommendations may be subject to change. The information and any disclosures provided herein may be considered confidential. Any use, distribution,
modification, copying, forwarding or disclosure by any person is strictly prohibited. The information and any disclosures provided herein do not constitute a
solicitation or offer to purchase or sell any security or other financial product or instrument. The current performance may be unaudited. Past performance
does not guarantee future returns. There can be no assurance that investments will achieve any targeted rates of return, and there is no guarantee against
the loss of your entire investment.
POTENTIAL CONFLICT OF INTEREST DISCLOSURE (as on date of report) Disclosure of interest statement – • Analyst interest of the stock
/Instrument(s): - No. • Firm interest of the stock / Instrument (s): - No.
Disclaimer
Contact Us
Amit Pathania
Research Associate
amit.pathania@choiceindia.com
Rohan Patil
Research Associate
rohan.patil@choiceindia.com
www.choicebroking.incustomercare@choiceindia.com
SEBI Registered - Research Analyst Equities I Commodities I Currencies I Mutual Funds
Aaj Ka Trend
28th Sept’16
Neeraj Yadav
Research Advisor
neeraj.yadav@choiceindia.com
Anish Vyas
Senior Research Associate
anish.vyas@choiceindia.com
Amit Pathania
Digitally signed by Amit Pathania
DN: cn=Amit Pathania, o=Choice Equity Broking
Pvt. ltd, ou=Research Department,
email=amit.pathania@choiceindia.com, c=IN
Date: 2016.09.28 08:35:19 +05'30'

Aaj ka trend 28.09.16

  • 1.
    Equities I CommoditiesI Currencies I Mutual Funds Aaj Ka Trend Technical View: MCX Gold prices are trading in a descending triangle formation on hourly time frame. On the other hand, prices have been trading below 20 HEMA on hourly chart. Looking at ADX, negative directional index (-DMI) is in domination position with rising average direction index. Moreover, Momentum Indicator RSI is trading below 50 levels on hourly time frame. For now we expect prices should move lower towards 30650 levels in the coming trading sessions. SEBI Registered - Research Analyst Equities I Commodities I Currencies I Mutual Funds Bullions MCX Gold Oct Hourly Chart CMP: 30992 MCX Gold (Oct) Trend: Bearish Price potential: 30650 Reversal:31200 MCX Silver Dec Hourly Chart CMP: 45470 Technical View: MCX Silver prices have achieved its target in yesterday trading sessions. Furthermore, MCX Silver prices are trading below its 20 HEMA on hourly time frame. In addition on COMEX silver prices have completed Bearish shark harmonic pattern at $20.14 levels on hourly chart. Moreover, Momentum indicator RSI is trading above 50 levels on hourly basis. For now we expect prices to move lower towards 45000 levels in few trading sessions. MCX Silver (Dec) Trend: Bearish Price potential: 45000 Reversal: 46000 Pivot levels for the Day S1 S2 S3 Pivot R1 R2 R3 Gold 30927 30831 30563 31099 31195 31367 31635 Silver 45594 45350 44679 46021 46265 46692 47363 28th Sept’16
  • 2.
    Equities I CommoditiesI Currencies I Mutual Funds Technical View: On hourly chart MCX Copper has witnessed breakdown of Rising channel formation at 324 levels on hourly time frame. Furthermore, Counter is trading below its 50 HEMA on hourly chart. Moreover, momentum indicator MACD has observed negative crossover on hourly time frame. In addition, Momentum indicator RSI is trading below 50 levels on hourly basis. For now we expect prices to move lower towards 315 levels in coming trading sessions. SEBI Registered - Research Analyst Equities I Commodities I Currencies I Mutual Funds MCX Copper Nov hourly Chart CMP: 322.45 MCX Copper (Nov) Trend: Bearish Price potential: 315 Reversal: 326 MCX Crude Oil Oct. Hourly Chart CMP: 2971 Technical View: MCX Crude Oil prices are trading in a falling channel formation on hourly time frame. Furthermore, Counter is trading below its 20 HEMA on hourly chart. Looking at ADX, negative directional index (-DMI) is in domination position with rising average direction index. Moreover, Momentum indicator RSI is trading below 40 levels on hourly basis. For now we expect prices to move lower towards 3000 levels in coming trading sessions. MCX Crude Oil (Oct) Trend: Bearish Price potential: 3000 Reversal: 3125 Pivot levels for the Day S1 S2 S3 Pivot R1 R2 R3 Copper 320.5 318.5 313.9 323.1 325.1 327.7 332.3 Crude 2926 2886 2775 2997 3037 3108 3219 Base Metal Energy Aaj Ka Trend 28th Sept’16
  • 3.
    Equities I CommoditiesI Currencies I Mutual FundsSEBI Registered - Research Analyst Equities I Commodities I Currencies I Mutual Funds Other Base Metals & Energy S1 S2 S3 Pivot R1 R2 R3 Trend Copper 320.5 318.5 313.9 323.1 325.1 327.7 332.3 Aluminum 108.3 107.4 105.5 109.3 110.2 111.2 113.1 Lead 128.8 127.1 124.5 129.8 131.4 132.4 135.1 Nickel 684.0 667.9 634.6 701.2 717.3 734.5 767.8 Zinc 151.6 149.3 145.3 153.4 155.6 157.4 161.5 Natural Gas 202.5 201.5 199.0 204.0 205.0 206.5 209.0 Fundamental News:  Gold prices edged lower during Europe's session on Tuesday, as market sentiment improved amid the view that U.S. presidential candidate Hillary Clinton did better than her rival Donald Trump in a closely-watched television debate.  Gold prices were lower during North America's session on Tuesday, extending overnight losses as markets declared Democrat Hillary Clinton as the winner of her first U.S. presidential debate with Republican Donald Trump.  Crude oil futures fell on Tuesday as optimism faded for an output-limiting deal from an oil producer meeting in Algeria that has so far failed to yield any agreement to curb one of the worst supply gluts in history.  Oil extended losses Tuesday as hopes of an output curb accord in Algiers this week faded.  Oil prices plunged nearly 3% during North American hours on Tuesday, extending overnight losses, after both Saudi Arabia and Iran played down expectations for a deal to freeze or cut oil production at the closely watched informal OPEC meeting on Wednesday.  Saudi Arabia and Iran on Tuesday dashed hopes that OPEC oil producers could clinch an output-limiting deal in Algeria this week as sources said the group and non-member Russia were still trying to bridge differences between the kingdom and Tehran.  U.S. natural gas futures wobbled below the highest level since January 2015 on Tuesday, as prices continued to draw support from forecasts showing unusually warm temperatures across most parts of the continental U.S. in the days ahead.  The dollar pushed higher against the other major currencies on Tuesday, after data showing that U.S. consumer confidence unexpectedly jumped in September to more than a nine-year high boosted optimism over the strength of the economy. Aaj Ka Trend 28th Sept’16
  • 4.
    Equities I CommoditiesI Currencies I Mutual FundsSEBI Registered - Research Analyst Equities I Commodities I Currencies I Mutual Funds International Market Commodity Closing Price Gold 1328.50 Silver 19.12 Crude Oil 44.63 Brent Crude Oil 46.60 Natural Gas 3.03 COMEX/NYMEX/ICE ( Precious Metals & Energy) Currency & Commodity Index Currency (Spot) Current Price USD / INR 66.46 Dollar Index 95.49 EUR / USD 1.12 CRB Index* 183.10 Closing as on 27.09.16 *Closing as on 27.09.16 LME (Base Metals) ( $ per tones) Commodity Closing Price Copper 4762 Aluminum 1634 Zinc 2293 Lead 1955 Nickel 10643 SHFE (Base Metals) (Yuan per tones) Commodity Closing Price Copper 37270 Aluminum 12380 Zinc 17350 Lead 13450 Closing as on 27.09.16 Closing as on 27.09.16 LME INVENTORY DATA Aaj Ka Trend 21-Sept-16 22-Sept-16 23-Sept-16 26-Sept-16 27-Sept-16 Aluminium -6600 -8150 -6700 -10701 -10175 Copper -150 -1750 10825 7252 7350 Lead 2200 -200 -25 250 250 Nickel -1002 120 -1686 -854 -504 Zinc -250 -300 -1200 -648 -525 28th Sept’16
  • 5.
    Equities I CommoditiesI Currencies I Mutual Funds This is solely for information of clients of Choice Broking and does not construe to be an investment advice. It is also not intended as an offer or solicitation for the purchase and sale of any financial instruments. Any action taken by you on the basis of the information contained herein is your responsibility alone and Choice Broking its subsidiaries or its employees or associates will not be liable in any manner for the consequences of such action taken by you. We have exercised due diligence in checking the correctness and authenticity of the information contained in this recommendation, but Choice Broking or any of its subsidiaries or associates or employees shall not be in any way responsible for any loss or damage that may arise to any person from any inadvertent error in the information contained in this recommendation or any action taken on basis of this information. Technical analysis studies market psychology, price patterns and volume levels. It is used to forecast future price and market movements. Technical analysis is complementary to fundamental analysis and news sources. The recommendations issued herewith might be contrary to recommendations issued by Choice Broking in the company research undertaken as the recommendations stated in this report is derived purely from technical analysis. Choice Broking has based this document on information obtained from sources it believes to be reliable but which it has not independently verified; Choice Broking makes no guarantee, representation or warranty and accepts no responsibility or liability as to its accuracy or completeness. The opinions contained within the report are based upon publicly available information at the time of publication and are subject to change without notice. The information and any disclosures provided herein are in summary form and have been prepared for informational purposes. The recommendations and suggested price levels are intended purely for trading purposes. The recommendations are valid for the day of the report however trading trends and volumes might vary substantially on an intraday basis and the recommendations may be subject to change. The information and any disclosures provided herein may be considered confidential. Any use, distribution, modification, copying, forwarding or disclosure by any person is strictly prohibited. The information and any disclosures provided herein do not constitute a solicitation or offer to purchase or sell any security or other financial product or instrument. The current performance may be unaudited. Past performance does not guarantee future returns. There can be no assurance that investments will achieve any targeted rates of return, and there is no guarantee against the loss of your entire investment. POTENTIAL CONFLICT OF INTEREST DISCLOSURE (as on date of report) Disclosure of interest statement – • Analyst interest of the stock /Instrument(s): - No. • Firm interest of the stock / Instrument (s): - No. Disclaimer Contact Us Amit Pathania Research Associate amit.pathania@choiceindia.com Rohan Patil Research Associate rohan.patil@choiceindia.com www.choicebroking.incustomercare@choiceindia.com SEBI Registered - Research Analyst Equities I Commodities I Currencies I Mutual Funds Aaj Ka Trend 28th Sept’16 Neeraj Yadav Research Advisor neeraj.yadav@choiceindia.com Anish Vyas Senior Research Associate anish.vyas@choiceindia.com Amit Pathania Digitally signed by Amit Pathania DN: cn=Amit Pathania, o=Choice Equity Broking Pvt. ltd, ou=Research Department, email=amit.pathania@choiceindia.com, c=IN Date: 2016.09.28 08:35:19 +05'30'