Currency Highlights
21st
Oct’2016
HighLights:
IndianRupee depreciated to end at 66.85 in Thursday’s trade
US Philly Fed Manufacturing Index plunged to 9.7-mark in October
Euro Zone Current Account at surplus of 29.7 billion Euros in Au-
gust
US Unemployment Claims rose to 260,000 for w/e on 14th Oct’16
Indian Rupee came under pressure and depreciated around 20 paise
to end at 66.81 against the US dollar on Thursday. The currency depre-
ciated on account of dollar demand from banks and importers.
However, sharp fall in the currency was cushioned due to upbeat do-
mestic market sentiments. Moreover, inflow of foreign funds prevent-
ed sharp fall in the currency. On the domestic front, India’s new mon-
etary policy committee was concerned about economic growth, and
saw the downturn in retail inflation and slack in the economy as an
opportunity to cut the key policy rate, according to the minutes of its
first meeting released on Tuesday which restricted sharp fall in the
currency.
Indian Rupee moved in the range of 66.7000 to 66.8237 in yesterday’s trade. The Reserve Bank of India (RBI) fixed reference
rate for the dollar was seen at 66.7411 and Euro stood at 73.1482 as on 20th
Oct’16.
US Dollar Index gained around 0.4 percent in Thursday’s trading session due to rise in risk aversion in global markets which led
to increase in demand for the low yielding currency. However, sharp upside in the currency was capped as a result of unfa-
vourable economic data from the country.
US Philly Fed Manufacturing Index plunged by 3.1 points to 9.7-mark in October as against a rise of 12.8-level in September.
Unemployment Claims rose by 13,000 to 260,000 for the week ending on 14th
Oct’16 from a rise of 247,000 in prior week. Ex-
isting Home Sales surged to 5.47 million in September with respect to 5.30 million in August.
Euro against dollar fell around 0.4 percent on Thursday on account of strength in the dollar index along with weak global mar-
ket sentiments. However, sharp downside in the currency was cushioned as a result of favourable economic data from the re-
gion.
German Producer Price Index (PPI) decline by 0.2 percent in September as against a fall of 0.1 percent in August. Euro Zone
Current Account was at a surplus of 29.7 billion Euros in August from a surplus of 27.7 billion Euros a month ago. European
Central Bank Minimum Bid Rate unchanged at nil percent in yesterday’s meeting.
The Sterling Pound declined around 0.3 percent in Thursday’s trade as a result of strength in the dollar index. Further, weak
global market sentiments kept the currency under pressure.
The Japanese Yen against dollar depreciated around 0.5 percent in Thursday’s trading session due to rise in risk appetite in
global market sentiments in early part of the trade which led to decline in demand for the low yielding currency.
SEBI Certified – Research Analyst Equities I Commodities I Currencies I Mutual Funds
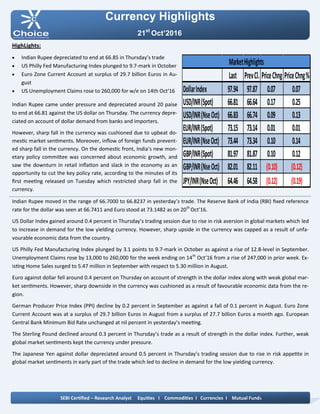
Last PrevCl. PriceChng PriceChng%
DollarIndex 97.94 97.87 0.07 0.07
USD/INR(Spot) 66.81 66.64 0.17 0.25
USD/INR(NseOct) 66.83 66.74 0.09 0.13
EUR/INR(Spot) 73.15 73.14 0.01 0.01
EUR/INR(NseOct) 73.44 73.34 0.10 0.14
GBP/INR(Spot) 81.97 81.87 0.10 0.12
GBP/INR(NseOct) 82.01 82.11 (0.10) (0.12)
JPY/INR(NseOct) 64.46 64.58 (0.12) (0.19)
MarketHighlights
2.
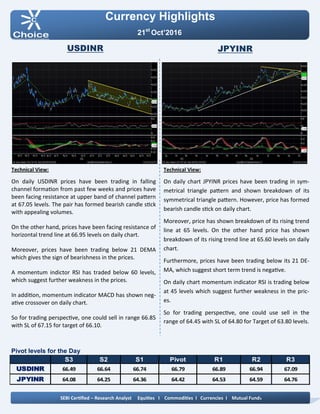
Technical View:
On dailychart JPYINR prices have been trading in sym-
metrical triangle pattern and shown breakdown of its
symmetrical triangle pattern. However, price has formed
bearish candle stick on daily chart.
Moreover, price has shown breakdown of its rising trend
line at 65 levels. On the other hand price has shown
breakdown of its rising trend line at 65.60 levels on daily
chart.
Furthermore, prices have been trading below its 21 DE-
MA, which suggest short term trend is negative.
On daily chart momentum indicator RSI is trading below
at 45 levels which suggest further weakness in the pric-
es.
So for trading perspective, one could use sell in the
range of 64.45 with SL of 64.80 for Target of 63.80 levels.
Pivot levels for the Day
Technical View:
On daily USDINR prices have been trading in falling
channel formation from past few weeks and prices have
been facing resistance at upper band of channel pattern
at 67.05 levels. The pair has formed bearish candle stick
with appealing volumes.
On the other hand, prices have been facing resistance of
horizontal trend line at 66.95 levels on daily chart.
Moreover, prices have been trading below 21 DEMA
which gives the sign of bearishness in the prices.
A momentum indictor RSI has traded below 60 levels,
which suggest further weakness in the prices.
In addition, momentum indicator MACD has shown neg-
ative crossover on daily chart.
So for trading perspective, one could sell in range 66.85
with SL of 67.15 for target of 66.10.
Currency Highlights
21st
Oct’2016
USDINR JPYINR
SEBI Certified – Research Analyst Equities I Commodities I Currencies I Mutual Funds
S3 S2 S1 Pivot R1 R2 R3
USDINR 66.49 66.64 66.74 66.79 66.89 66.94 67.09
JPYINR 64.08 64.25 64.36 64.42 64.53 64.59 64.76
3.
Pivot levels forthe Day
Currency Highlights
21st
Oct’2016
GBPINR EURINR
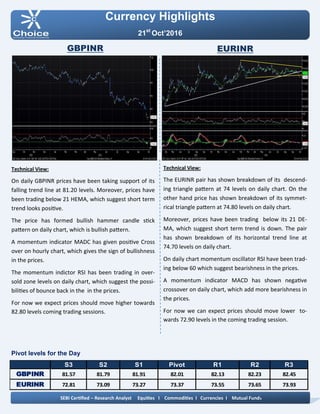
Technical View:
The EURINR pair has shown breakdown of its descend-
ing triangle pattern at 74 levels on daily chart. On the
other hand price has shown breakdown of its symmet-
rical triangle pattern at 74.80 levels on daily chart.
Moreover, prices have been trading below its 21 DE-
MA, which suggest short term trend is down. The pair
has shown breakdown of its horizontal trend line at
74.70 levels on daily chart.
On daily chart momentum oscillator RSI have been trad-
ing below 60 which suggest bearishness in the prices.
A momentum indicator MACD has shown negative
crossover on daily chart, which add more bearishness in
the prices.
For now we can expect prices should move lower to-
wards 72.90 levels in the coming trading session.
Technical View:
On daily GBPINR prices have been taking support of its
falling trend line at 81.20 levels. Moreover, prices have
been trading below 21 HEMA, which suggest short term
trend looks positive.
The price has formed bullish hammer candle stick
pattern on daily chart, which is bullish pattern.
A momentum indicator MADC has given positive Cross
over on hourly chart, which gives the sign of bullishness
in the prices.
The momentum indictor RSI has been trading in over-
sold zone levels on daily chart, which suggest the possi-
bilities of bounce back in the in the prices.
For now we expect prices should move higher towards
82.80 levels coming trading sessions.
SEBI Certified – Research Analyst Equities I Commodities I Currencies I Mutual Funds
S3 S2 S1 Pivot R1 R2 R3
GBPINR 81.57 81.79 81.91 82.01 82.13 82.23 82.45
EURINR 72.81 73.09 73.27 73.37 73.55 73.65 73.93
4.
Currency Highlights
SEBI Certified– Research Analyst Equities I Commodities I Currencies I Mutual Funds
21st
Oct’2016
Economic Indicators
Date Time Data Prior Expected Impact
21.10.16 Tentative BOJ Gov Kuroda Speaks More hawkish than expected
= Good for currency;
21.10.16 6:00 PM Core CPI m/m 0.0% 0.2% More hawkish than expected
= Good for currency; CAD
21.10.16 6:00 PM Core Retail Sales m/m -0.1% 0.4% More hawkish than expected
= Good for currency; CAD
21.10.16 7:30 PM Consumer Confidence -8 -8 Actual > Forecast = Good
for currency; EURINR
21.10.16 7:45 PM FOMC Member Tarullo
Speaks
More hawkish than expected
= Good for currency;
5.
Currency Highlights
21st
Oct’2016
SEBI Certified– Research Analyst Equities I Commodities I Currencies I Mutual Funds
Amit Pathania
Digitally signed by Amit Pathania
DN: cn=Amit Pathania, o=Choice Equity Broking Pvt. ltd,
ou=Research Department, email=amit.pathania@choiceindia.com,
c=IN
Date: 2016.10.21 09:01:24 +05'30'