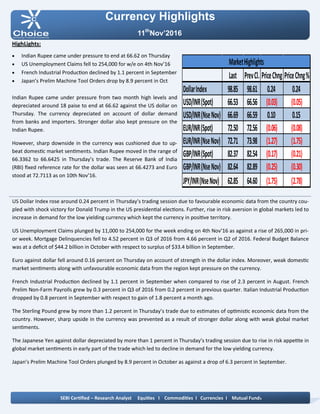
Currency Highlights
11th
Nov’2016
HighLights:
 Indian Rupee came under pressure to end at 66.62 on Thursday
 US Unemployment Claims fell to 254,000 for w/e on 4th Nov’16
 French Industrial Production declined by 1.1 percent in September
 Japan’s Prelim Machine Tool Orders drop by 8.9 percent in Oct
Indian Rupee came under pressure from two month high levels and
depreciated around 18 paise to end at 66.62 against the US dollar on
Thursday. The currency depreciated on account of dollar demand
from banks and importers. Stronger dollar also kept pressure on the
Indian Rupee.
However, sharp downside in the currency was cushioned due to up-
beat domestic market sentiments. Indian Rupee moved in the range of
66.3362 to 66.6425 in Thursday’s trade. The Reserve Bank of India
(RBI) fixed reference rate for the dollar was seen at 66.4273 and Euro
stood at 72.7113 as on 10th Nov’16.
US Dollar Index rose around 0.24 percent in Thursday’s trading session due to favourable economic data from the country cou-
pled with shock victory for Donald Trump in the US presidential elections. Further, rise in risk aversion in global markets led to
increase in demand for the low yielding currency which kept the currency in positive territory.
US Unemployment Claims plunged by 11,000 to 254,000 for the week ending on 4th Nov’16 as against a rise of 265,000 in pri-
or week. Mortgage Delinquencies fell to 4.52 percent in Q3 of 2016 from 4.66 percent in Q2 of 2016. Federal Budget Balance
was at a deficit of $44.2 billion in October with respect to surplus of $33.4 billion in September.
Euro against dollar fell around 0.16 percent on Thursday on account of strength in the dollar index. Moreover, weak domestic
market sentiments along with unfavourable economic data from the region kept pressure on the currency.
French Industrial Production declined by 1.1 percent in September when compared to rise of 2.3 percent in August. French
Prelim Non-Farm Payrolls grew by 0.3 percent in Q3 of 2016 from 0.2 percent in previous quarter. Italian Industrial Production
dropped by 0.8 percent in September with respect to gain of 1.8 percent a month ago.
The Sterling Pound grew by more than 1.2 percent in Thursday’s trade due to estimates of optimistic economic data from the
country. However, sharp upside in the currency was prevented as a result of stronger dollar along with weak global market
sentiments.
The Japanese Yen against dollar depreciated by more than 1 percent in Thursday’s trading session due to rise in risk appetite in
global market sentiments in early part of the trade which led to decline in demand for the low yielding currency.
Japan’s Prelim Machine Tool Orders plunged by 8.9 percent in October as against a drop of 6.3 percent in September.
SEBI Certified – Research Analyst Equities I Commodities I Currencies I Mutual Funds
Last PrevCl. PriceChng PriceChng%
DollarIndex 98.85 98.61 0.24 0.24
USD/INR(Spot) 66.53 66.56 (0.03) (0.05)
USD/INR(NseNov) 66.69 66.59 0.10 0.15
EUR/INR(Spot) 72.50 72.56 (0.06) (0.08)
EUR/INR(NseNov) 72.71 73.98 (1.27) (1.75)
GBP/INR(Spot) 82.37 82.54 (0.17) (0.21)
GBP/INR(NseNov) 82.64 82.89 (0.25) (0.30)
JPY/INR(NseNov) 62.85 64.60 (1.75) (2.78)
MarketHighlights
Technical View:
On daily chart JPYINR prices have been trading in sym-
metrical triangle pattern and price has taken support of
its lower band at 64.10 levels.
Moreover, price has taken support of its horizontal
trend line at 64.50 levels on daily chart.
Furthermore, prices have been trading above its 50 DE-
MA, which suggest short term trend is positive.
On daily chart momentum indicator RSI is trading above
55 levels which suggest further bullishness can be seen
in the prices.
In addition, momentum indicator MACD has shown posi-
tive crossover on daily chart.
So for trading perspective, one could use buy in the
range of 62.60 with SL of 62.20 for target of 63.40 levels.
Pivot levels for the Day
Technical View:
The pair has been trading in falling channel pattern from
past few months and prices have been facing resistance
of its upper band at 67.30 levels on daily chart. On daily
USDINR prices have been facing resistance of its falling
trend line at 67.30 levels.
On the other hand, prices have been facing resistance of
falling trend line at 67.20 levels on daily chart.
Moreover, prices have been trading below 21 HEMA
which gives the sign of bearishness in the prices.
A momentum indictor RSI has traded below 60 levels,
which suggest further weakness in the prices.
In addition, momentum indicator MACD has shown neg-
ative crossover on daily chart.
So for trading perspective, one could sell in range 66.75
with SL of 67 for target of 66.10.
Currency Highlights
11th
Nov’2016
USDINR JPYINR
SEBI Certified – Research Analyst Equities I Commodities I Currencies I Mutual Funds
S3 S2 S1 Pivot R1 R2 R3
USDINR 66.12 66.37 66.53 66.62 66.78 66.87 67.12
JPYINR 61.56 62.31 62.57 63.06 63.32 63.81 64.56
Pivot levels for the Day
Currency Highlights
11th
Nov’2016
GBPINR EURINR
Technical View:
The EURINR pair has been trading in falling channel
pattern and prices have been taking support of its lower
band of channel pattern at 73.20 levels on daily chart.
On the other hand price has taken support of its hori-
zontal trend line at 73.80 levels on daily chart.
Moreover, prices have been trading above its 25 DE-
MA, which suggest short term trend is up.
On daily chart momentum oscillator RSI have been trad-
ing above 50 which suggest bullishness in the prices.
A momentum indicator MACD has shown positive cross-
over on daily chart, which add more bullishness in the
prices.
For now we can expect prices should move higher to-
wards 73.40 levels in the coming trading session.
Technical View:
The pair has been trading in falling channel pattern
form pas few months and price has given breakout of
its channel pattern at 83 levels on daily chart. Moreo-
ver, prices have been trading below 25 DEMA, which
suggest short term trend looks positive.
The price has formed bullish hammer candle stick
pattern on daily chart, which is bullish pattern.
A momentum indicator MADC has given positive Cross
over on hourly chart, which gives the sign of bullishness
in the prices.
The momentum indictor RSI has been trading above
50levels on daily chart, which suggest the possibilities
of bounce back in the in the prices.
For now we expect prices should move higher towards
83.40 levels coming trading sessions.
SEBI Certified – Research Analyst Equities I Commodities I Currencies I Mutual Funds
S3 S2 S1 Pivot R1 R2 R3
GBPINR 81.86 82.27 82.45 82.68 82.86 83.09 83.50
EURINR 71.32 72.13 72.42 72.94 73.23 73.75 74.56
Currency Highlights
SEBI Certified – Research Analyst Equities I Commodities I Currencies I Mutual Funds
11th
Nov’2016
Economic Indicators
Date Time Data Prior Expected Impact
11.11.16 05:20 AM PPI y/y -3.2% -2.6% Actual > Forecast = Good
for currency; JPYINR
11.11.16 12:30 PM German Final CPI m/m 0.2% 0.2% Actual > Forecast = Good
for currency; EURINR
11.11.16 11th-16th M2 Money Supply y/y 11.5% 11.4% Actual > Forecast = Good
for currency; CNY
11.11.16 11th-16th New Loans 1220B 675B Actual > Forecast = Good
for currency; CNY
11.11.16 07:00 PM Prelim UoM Consumer Senti-
ment
87.2 87.4 Actual < Forecast = Good
for currency; USDINR
Currency Highlights
11th
Nov’2016
SEBI Certified – Research Analyst Equities I Commodities I Currencies I Mutual Funds
Anish Vyas
Digitally signed by Anish Vyas
DN: cn=Anish Vyas, o=Choice Merchandise
Broking Pvt. Ltd, ou=Sr. Research Associate,
email=anish.vyas@choiceindia.com, c=IN
Date: 2016.11.11 09:01:54 +05'30'

Currency high lights 11.11.16

  • 1.
    Currency Highlights 11th Nov’2016 HighLights:  IndianRupee came under pressure to end at 66.62 on Thursday  US Unemployment Claims fell to 254,000 for w/e on 4th Nov’16  French Industrial Production declined by 1.1 percent in September  Japan’s Prelim Machine Tool Orders drop by 8.9 percent in Oct Indian Rupee came under pressure from two month high levels and depreciated around 18 paise to end at 66.62 against the US dollar on Thursday. The currency depreciated on account of dollar demand from banks and importers. Stronger dollar also kept pressure on the Indian Rupee. However, sharp downside in the currency was cushioned due to up- beat domestic market sentiments. Indian Rupee moved in the range of 66.3362 to 66.6425 in Thursday’s trade. The Reserve Bank of India (RBI) fixed reference rate for the dollar was seen at 66.4273 and Euro stood at 72.7113 as on 10th Nov’16. US Dollar Index rose around 0.24 percent in Thursday’s trading session due to favourable economic data from the country cou- pled with shock victory for Donald Trump in the US presidential elections. Further, rise in risk aversion in global markets led to increase in demand for the low yielding currency which kept the currency in positive territory. US Unemployment Claims plunged by 11,000 to 254,000 for the week ending on 4th Nov’16 as against a rise of 265,000 in pri- or week. Mortgage Delinquencies fell to 4.52 percent in Q3 of 2016 from 4.66 percent in Q2 of 2016. Federal Budget Balance was at a deficit of $44.2 billion in October with respect to surplus of $33.4 billion in September. Euro against dollar fell around 0.16 percent on Thursday on account of strength in the dollar index. Moreover, weak domestic market sentiments along with unfavourable economic data from the region kept pressure on the currency. French Industrial Production declined by 1.1 percent in September when compared to rise of 2.3 percent in August. French Prelim Non-Farm Payrolls grew by 0.3 percent in Q3 of 2016 from 0.2 percent in previous quarter. Italian Industrial Production dropped by 0.8 percent in September with respect to gain of 1.8 percent a month ago. The Sterling Pound grew by more than 1.2 percent in Thursday’s trade due to estimates of optimistic economic data from the country. However, sharp upside in the currency was prevented as a result of stronger dollar along with weak global market sentiments. The Japanese Yen against dollar depreciated by more than 1 percent in Thursday’s trading session due to rise in risk appetite in global market sentiments in early part of the trade which led to decline in demand for the low yielding currency. Japan’s Prelim Machine Tool Orders plunged by 8.9 percent in October as against a drop of 6.3 percent in September. SEBI Certified – Research Analyst Equities I Commodities I Currencies I Mutual Funds Last PrevCl. PriceChng PriceChng% DollarIndex 98.85 98.61 0.24 0.24 USD/INR(Spot) 66.53 66.56 (0.03) (0.05) USD/INR(NseNov) 66.69 66.59 0.10 0.15 EUR/INR(Spot) 72.50 72.56 (0.06) (0.08) EUR/INR(NseNov) 72.71 73.98 (1.27) (1.75) GBP/INR(Spot) 82.37 82.54 (0.17) (0.21) GBP/INR(NseNov) 82.64 82.89 (0.25) (0.30) JPY/INR(NseNov) 62.85 64.60 (1.75) (2.78) MarketHighlights
  • 2.
    Technical View: On dailychart JPYINR prices have been trading in sym- metrical triangle pattern and price has taken support of its lower band at 64.10 levels. Moreover, price has taken support of its horizontal trend line at 64.50 levels on daily chart. Furthermore, prices have been trading above its 50 DE- MA, which suggest short term trend is positive. On daily chart momentum indicator RSI is trading above 55 levels which suggest further bullishness can be seen in the prices. In addition, momentum indicator MACD has shown posi- tive crossover on daily chart. So for trading perspective, one could use buy in the range of 62.60 with SL of 62.20 for target of 63.40 levels. Pivot levels for the Day Technical View: The pair has been trading in falling channel pattern from past few months and prices have been facing resistance of its upper band at 67.30 levels on daily chart. On daily USDINR prices have been facing resistance of its falling trend line at 67.30 levels. On the other hand, prices have been facing resistance of falling trend line at 67.20 levels on daily chart. Moreover, prices have been trading below 21 HEMA which gives the sign of bearishness in the prices. A momentum indictor RSI has traded below 60 levels, which suggest further weakness in the prices. In addition, momentum indicator MACD has shown neg- ative crossover on daily chart. So for trading perspective, one could sell in range 66.75 with SL of 67 for target of 66.10. Currency Highlights 11th Nov’2016 USDINR JPYINR SEBI Certified – Research Analyst Equities I Commodities I Currencies I Mutual Funds S3 S2 S1 Pivot R1 R2 R3 USDINR 66.12 66.37 66.53 66.62 66.78 66.87 67.12 JPYINR 61.56 62.31 62.57 63.06 63.32 63.81 64.56
  • 3.
    Pivot levels forthe Day Currency Highlights 11th Nov’2016 GBPINR EURINR Technical View: The EURINR pair has been trading in falling channel pattern and prices have been taking support of its lower band of channel pattern at 73.20 levels on daily chart. On the other hand price has taken support of its hori- zontal trend line at 73.80 levels on daily chart. Moreover, prices have been trading above its 25 DE- MA, which suggest short term trend is up. On daily chart momentum oscillator RSI have been trad- ing above 50 which suggest bullishness in the prices. A momentum indicator MACD has shown positive cross- over on daily chart, which add more bullishness in the prices. For now we can expect prices should move higher to- wards 73.40 levels in the coming trading session. Technical View: The pair has been trading in falling channel pattern form pas few months and price has given breakout of its channel pattern at 83 levels on daily chart. Moreo- ver, prices have been trading below 25 DEMA, which suggest short term trend looks positive. The price has formed bullish hammer candle stick pattern on daily chart, which is bullish pattern. A momentum indicator MADC has given positive Cross over on hourly chart, which gives the sign of bullishness in the prices. The momentum indictor RSI has been trading above 50levels on daily chart, which suggest the possibilities of bounce back in the in the prices. For now we expect prices should move higher towards 83.40 levels coming trading sessions. SEBI Certified – Research Analyst Equities I Commodities I Currencies I Mutual Funds S3 S2 S1 Pivot R1 R2 R3 GBPINR 81.86 82.27 82.45 82.68 82.86 83.09 83.50 EURINR 71.32 72.13 72.42 72.94 73.23 73.75 74.56
  • 4.
    Currency Highlights SEBI Certified– Research Analyst Equities I Commodities I Currencies I Mutual Funds 11th Nov’2016 Economic Indicators Date Time Data Prior Expected Impact 11.11.16 05:20 AM PPI y/y -3.2% -2.6% Actual > Forecast = Good for currency; JPYINR 11.11.16 12:30 PM German Final CPI m/m 0.2% 0.2% Actual > Forecast = Good for currency; EURINR 11.11.16 11th-16th M2 Money Supply y/y 11.5% 11.4% Actual > Forecast = Good for currency; CNY 11.11.16 11th-16th New Loans 1220B 675B Actual > Forecast = Good for currency; CNY 11.11.16 07:00 PM Prelim UoM Consumer Senti- ment 87.2 87.4 Actual < Forecast = Good for currency; USDINR
  • 5.
    Currency Highlights 11th Nov’2016 SEBI Certified– Research Analyst Equities I Commodities I Currencies I Mutual Funds Anish Vyas Digitally signed by Anish Vyas DN: cn=Anish Vyas, o=Choice Merchandise Broking Pvt. Ltd, ou=Sr. Research Associate, email=anish.vyas@choiceindia.com, c=IN Date: 2016.11.11 09:01:54 +05'30'