This document provides an overview of key concepts in project structure and management, including:
1) It defines a project and explains their unique, non-routine nature requiring organization and resources to complete within a time limit.
2) It outlines the typical stages in a project's lifecycle from conception to implementation and completion.
3) It discusses important characteristics of projects including objectives, uniqueness, complexity, and risk/uncertainty.
4) It categorizes different types of projects based on factors like location, technology, size and scope.


![12
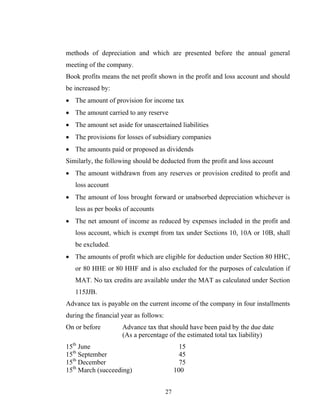
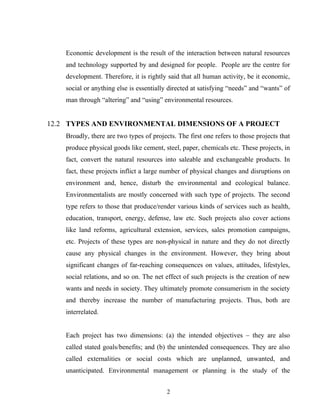
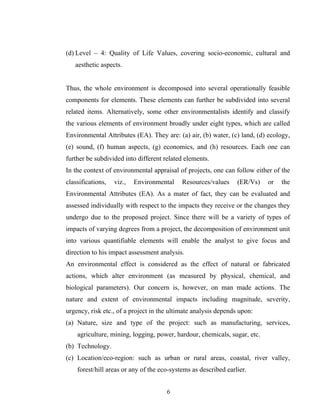
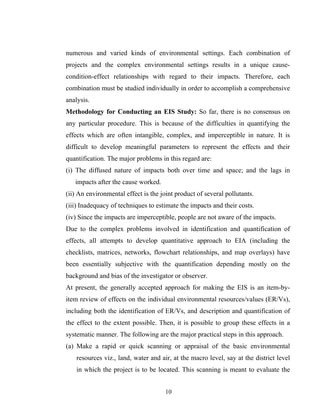
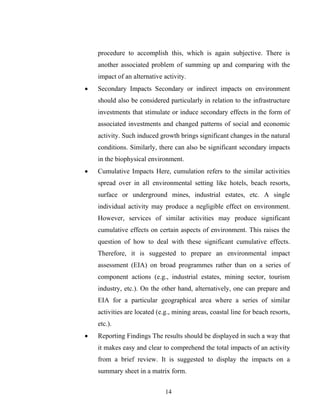
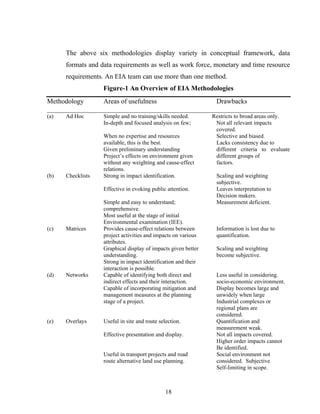
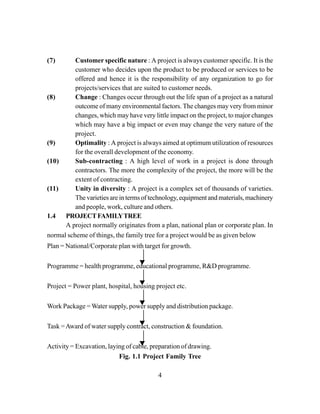
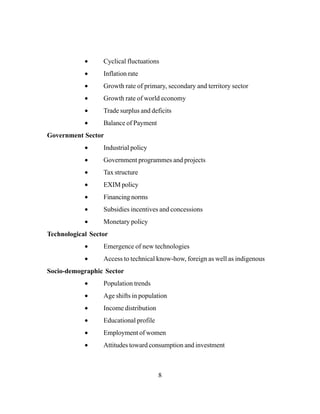
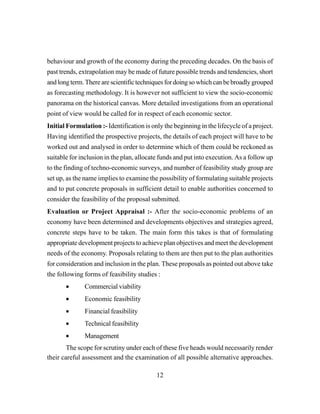
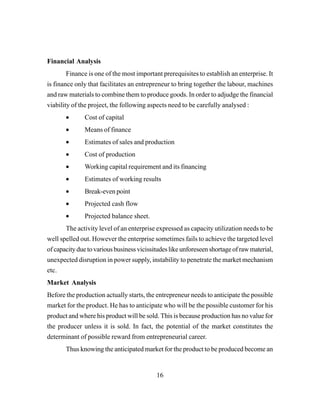
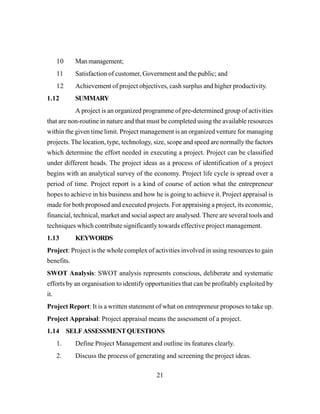
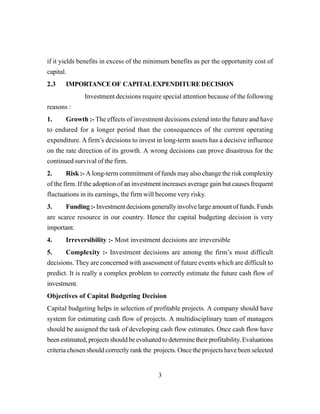
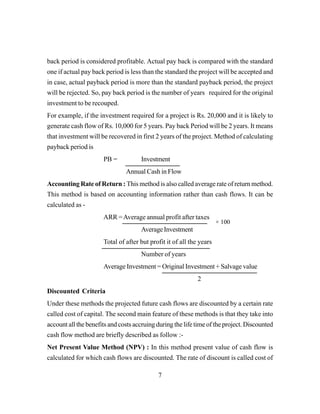
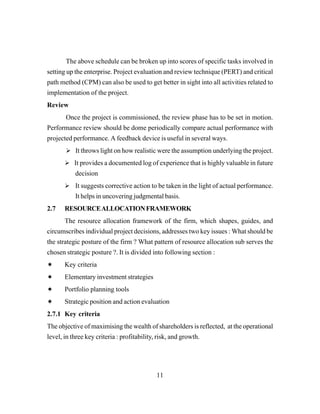
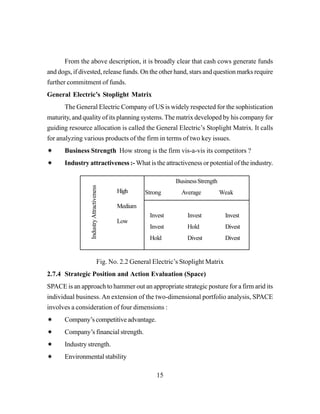
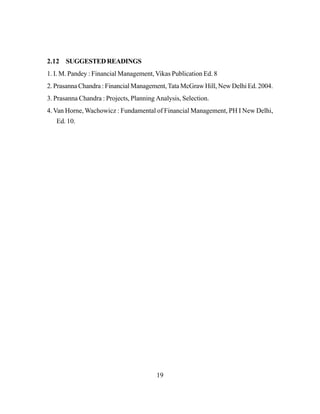
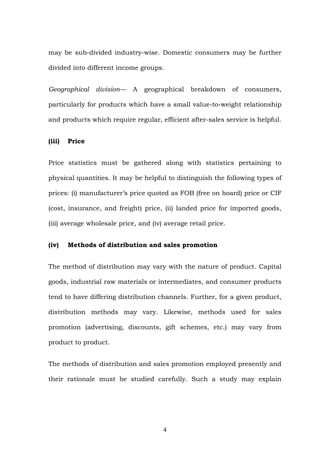
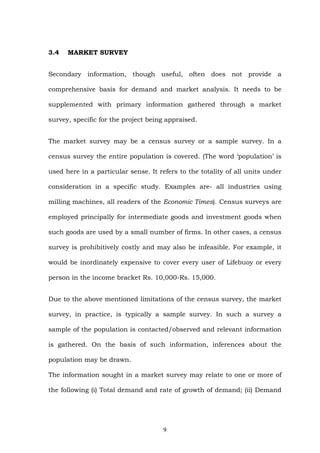
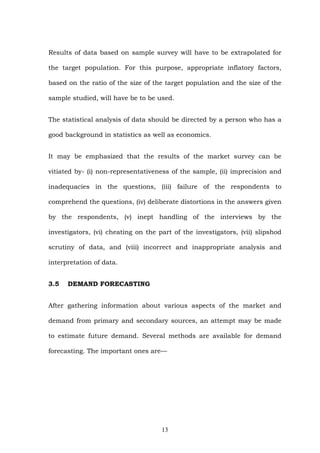
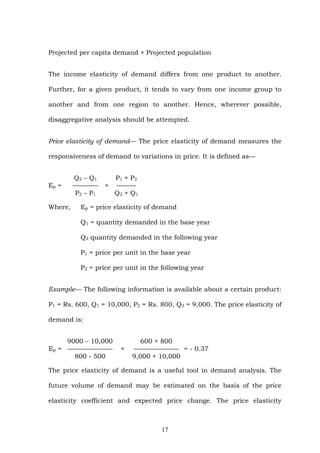
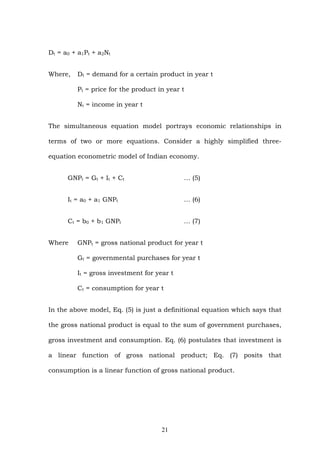
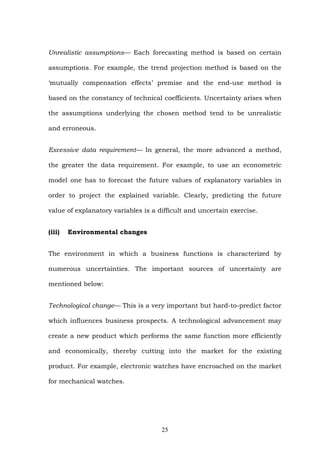
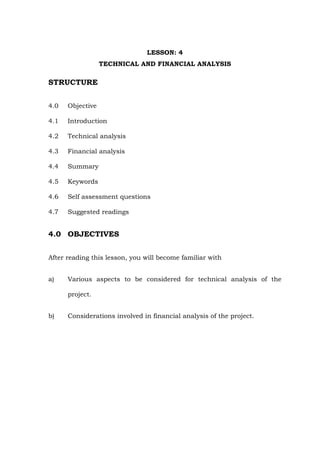
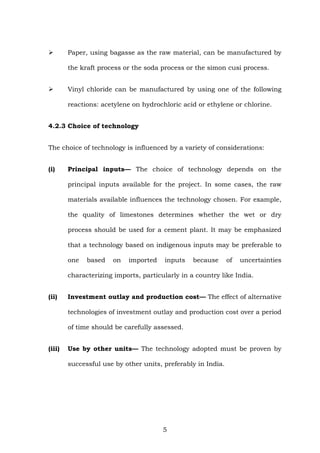
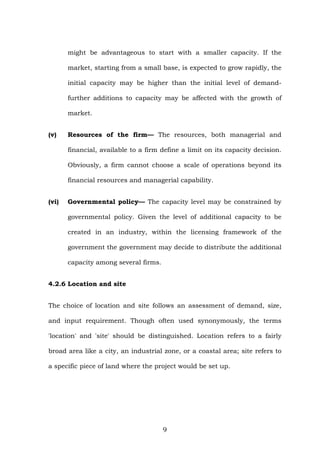
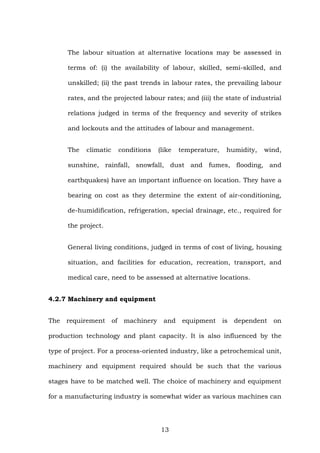
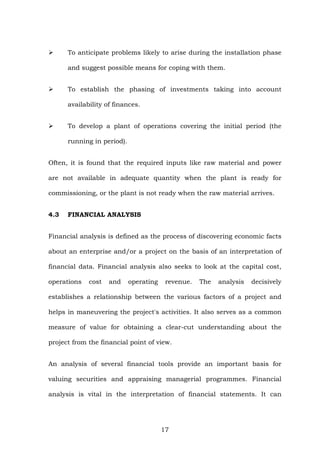
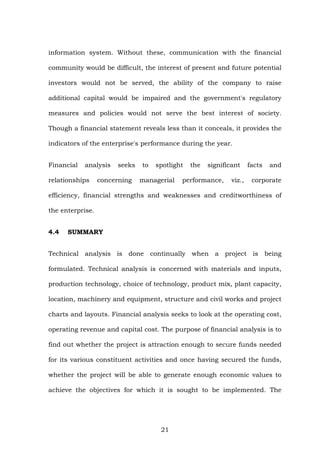
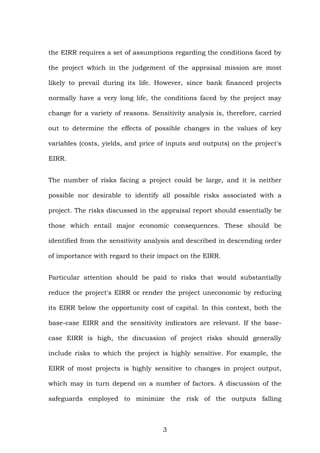
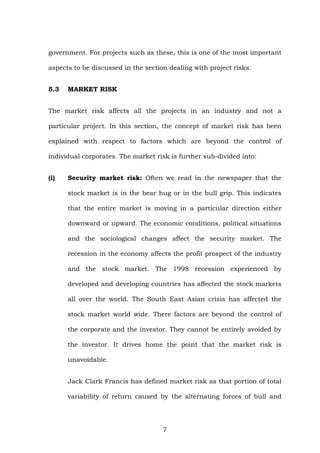
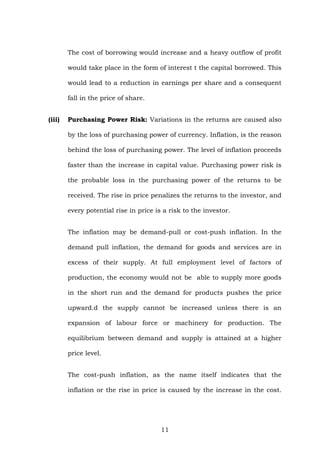
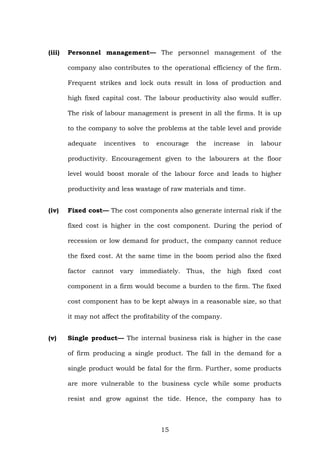
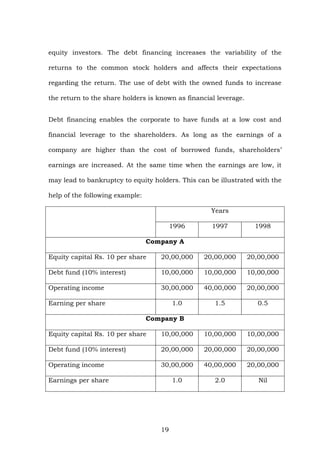
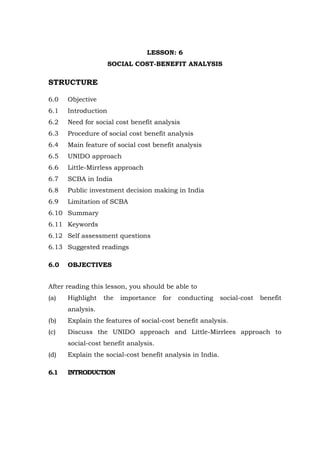
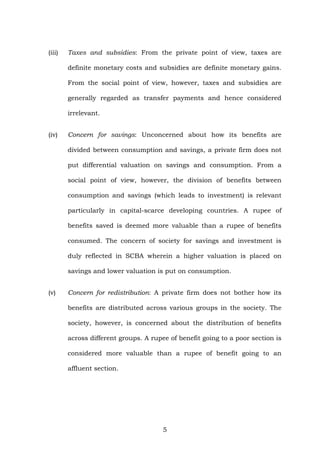
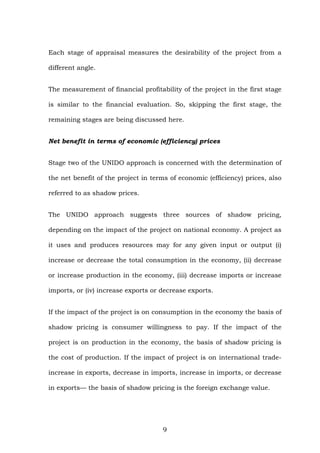
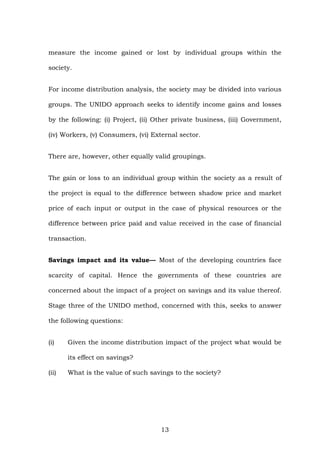
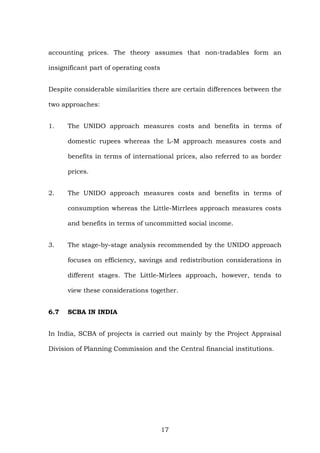
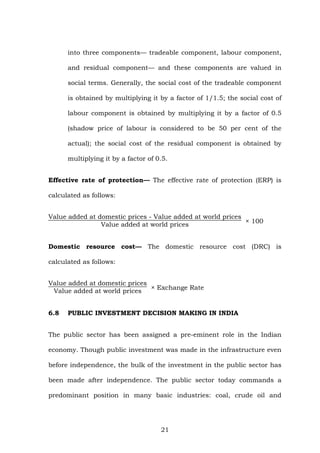
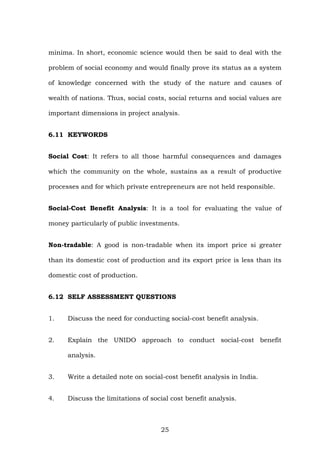
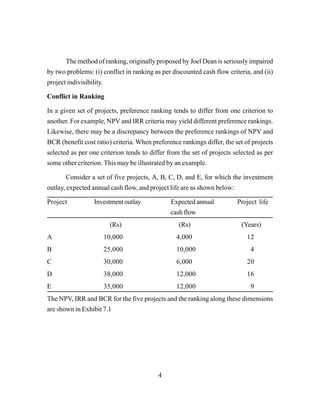
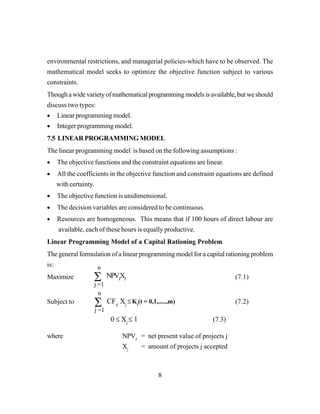
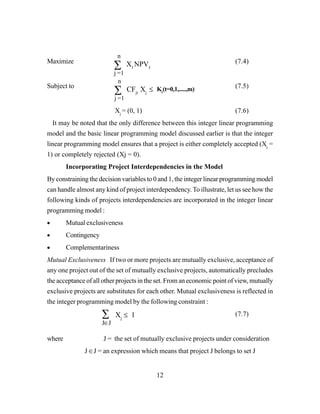
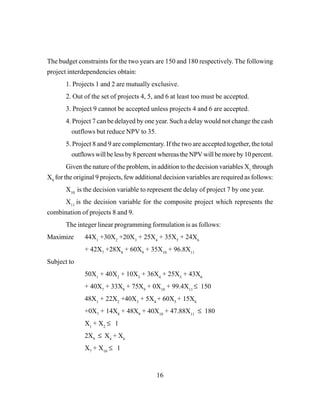
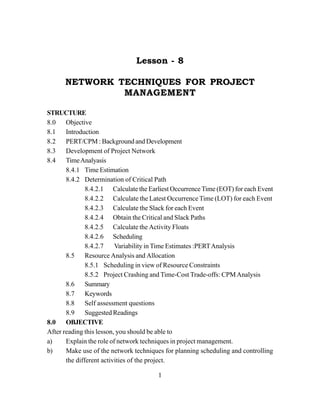
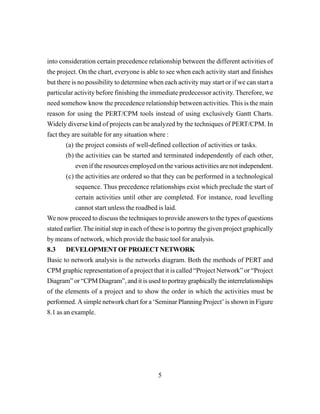
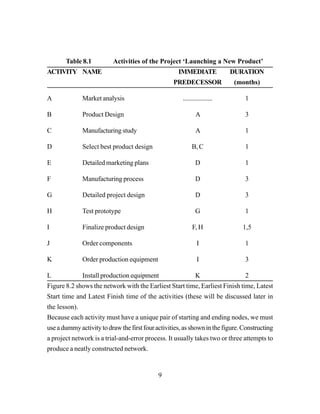
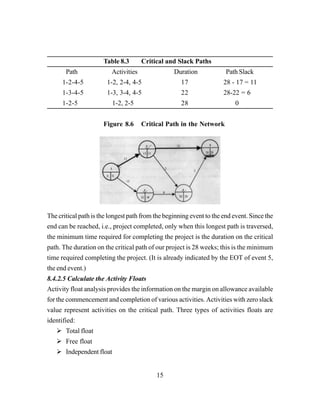
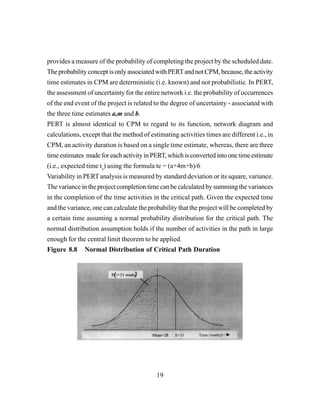
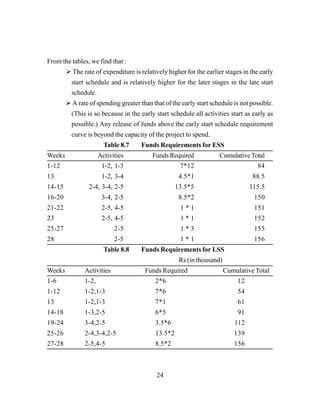
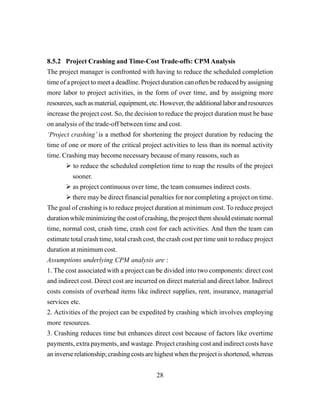
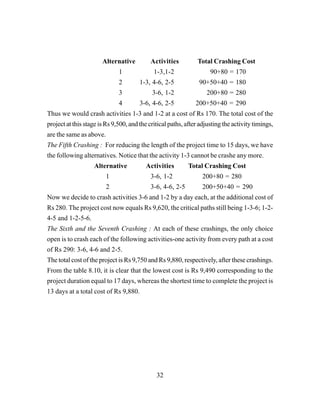
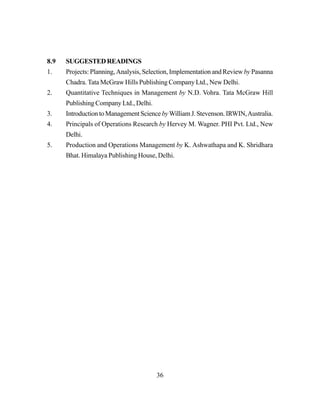
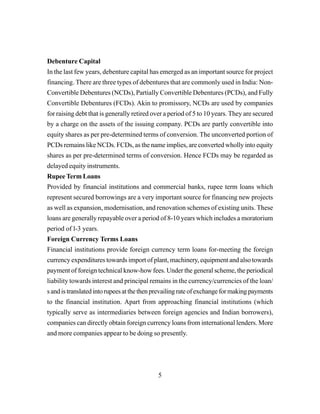
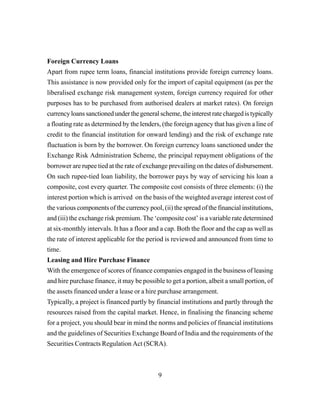
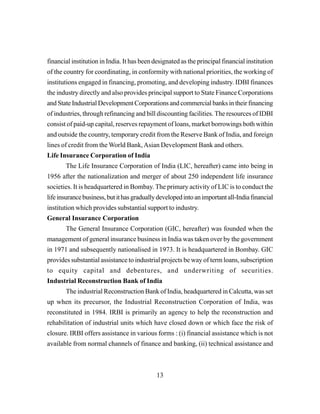
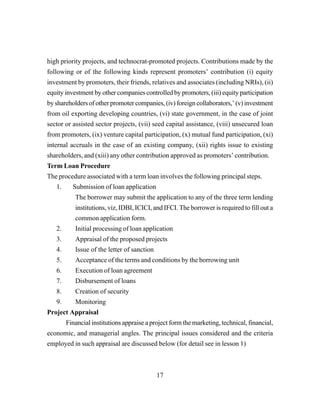
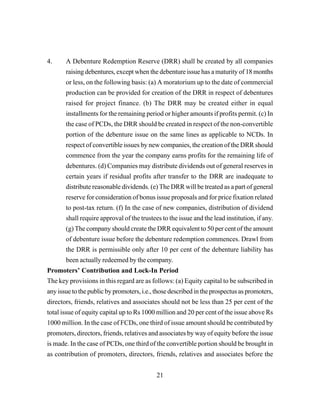
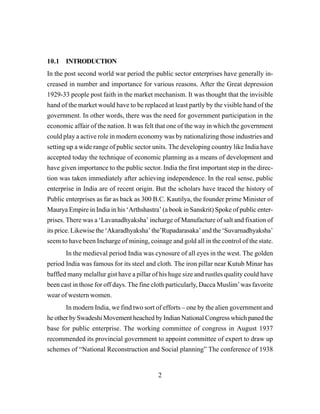
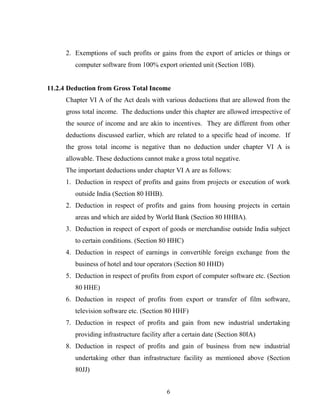
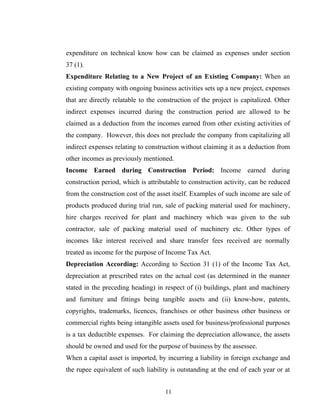
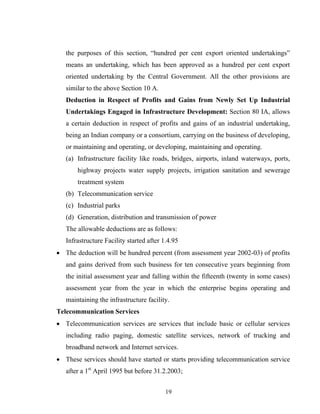
terms, the EOT of an event is the duration of the longest path (from the beginning event
whoseEOTissetat0)leadingtothatevent.TheEOTsofvariouseventsinourillustrative
project are shown in Figure 8.4. It may be noted that in Figure 8.4 a circle represents an
event. The upper half of the circle denotes the event number, the left quarter in the
lower half denotes the EOT, and the right quarter in the lower half denotes the Latest
Occurrence Time, (LOT) a term described the later.
The EOT of the end event obviously represents the minimum time required for
completing the project.To obtain the EOTof various events we start from the beginning
event and move forward towards the end event. This computational procedure is referred
to as the forward pass. In this computation we assume that each activity starts
immediately on the occurrence of the event preceding it. Hence the starting and finishing
time for various activities obtained from this computation are the Earliest Starting
Time (EST) and the Earliest Finishing Time (EFT).
The general formula for EOT is :
EOT (i) = Max [Eot(k) + d(k-i)]
where EOT (i) = earliest occurrence time of event i
EOT (k)=earliest occurrence time of event k (k precedes i and there may be
several k’s)
d (k-i) = duration of activity (k-i)
The maximisation shown is done considering all activities (k-i) leading to event node i
have been completed.
The formulae for EST and EFT are :
EST (i-j) = EOT (i)
EFT (i-j) = EST (i-j)+d(i-j)
where EST (i-j) = earliest starting time for activity (i-j)
EOT (i) = earliest occurrence time of event (i)
EFT (i-j) = earliest finishing time for activity (i-j)
d(i-j) = duration of activity (i-j)](https://image.slidesharecdn.com/economicsofprojectevaluationforreferencecpmmodule2-200331091020/85/Economics-of-project-evaluation-for-reference-cpm-module2-173-320.jpg)
![13
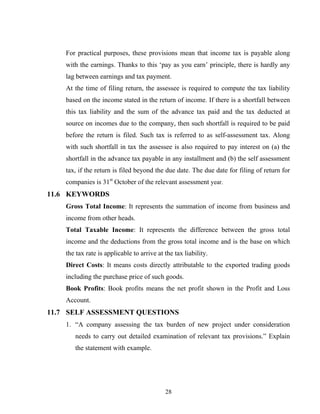
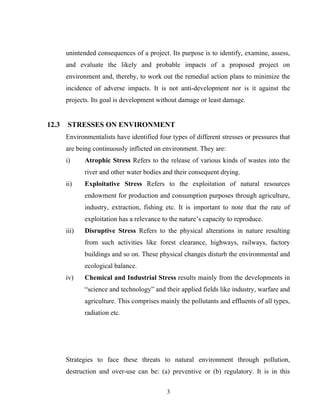
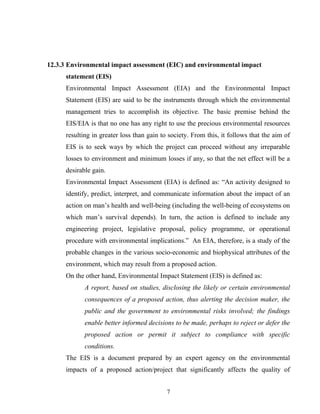
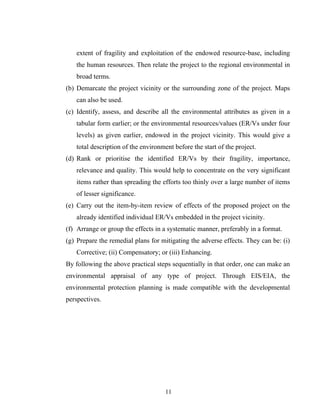
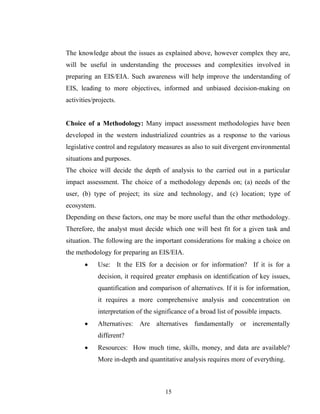
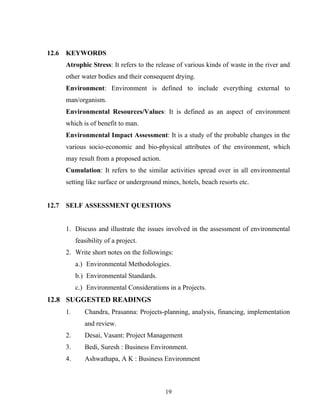
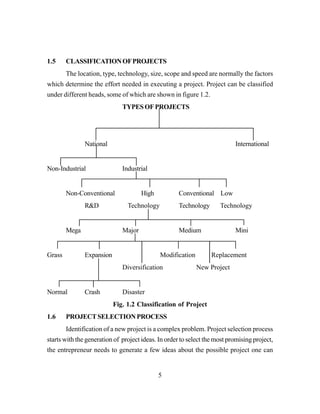
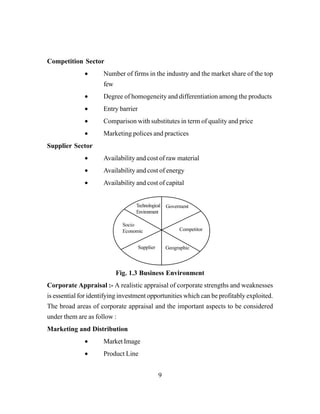
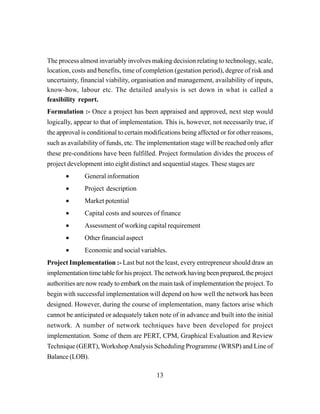
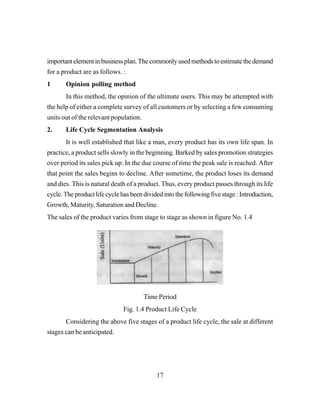
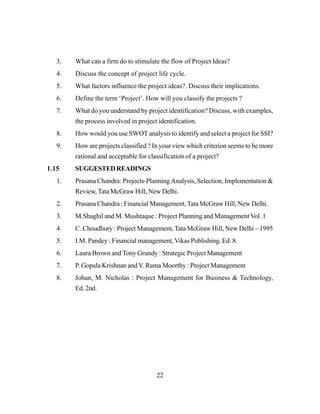
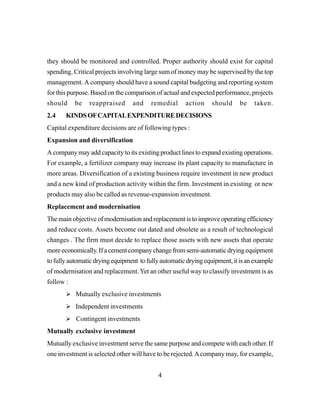
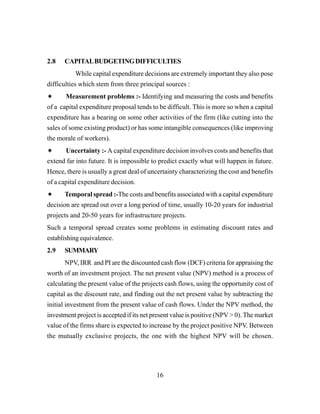
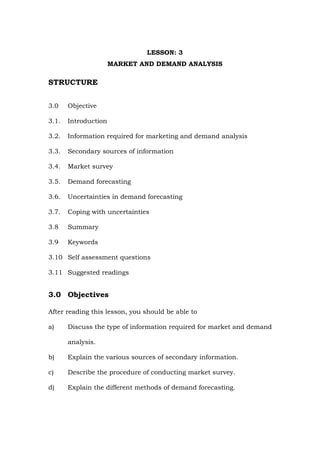
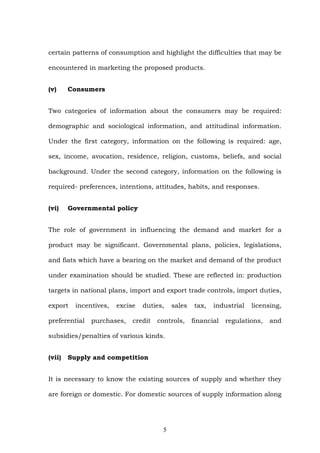
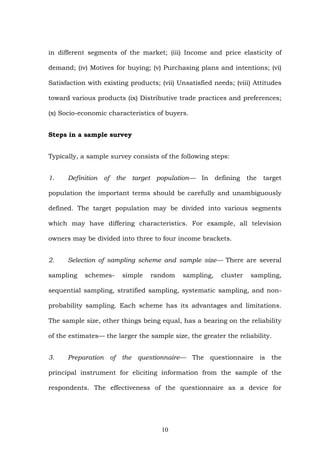
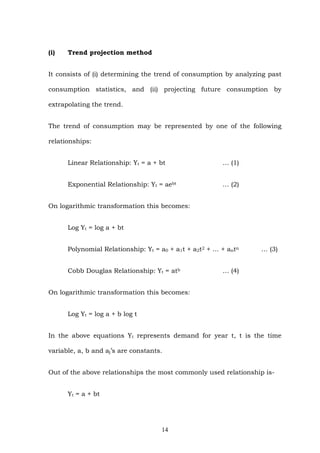
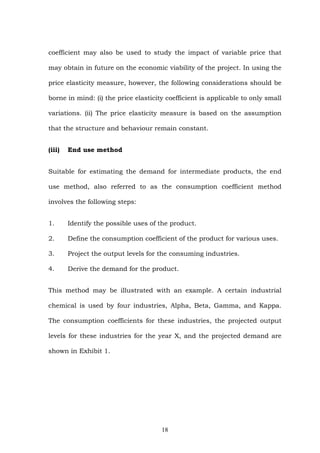
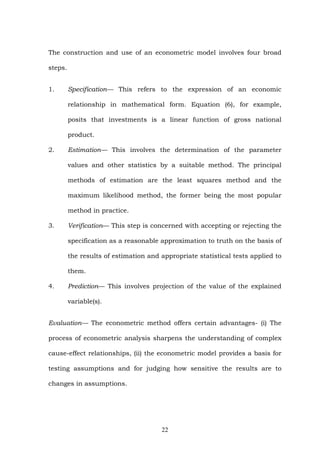
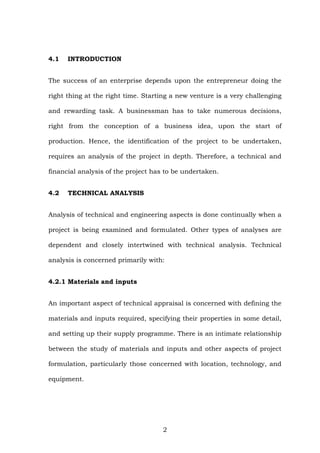
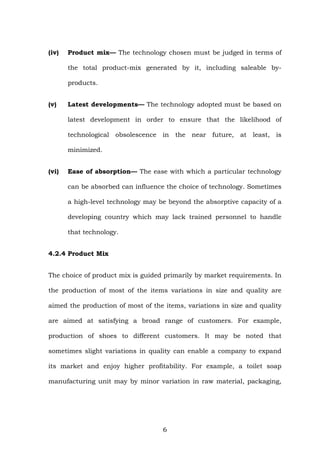
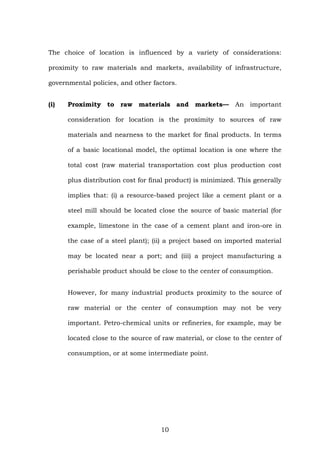
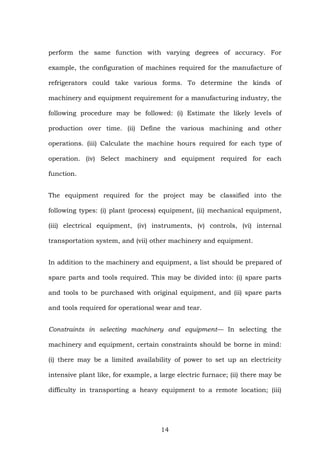
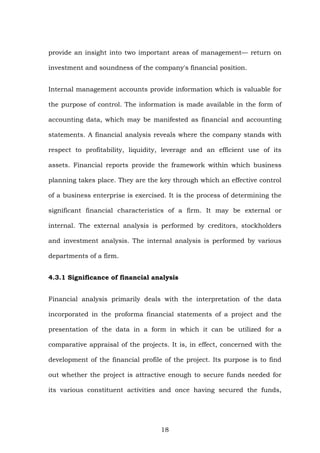
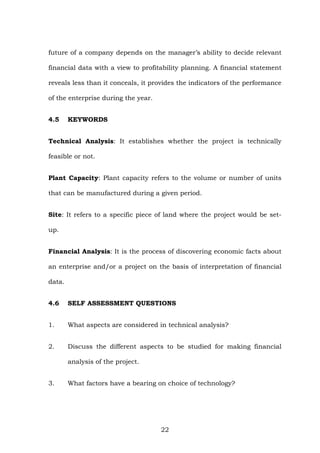
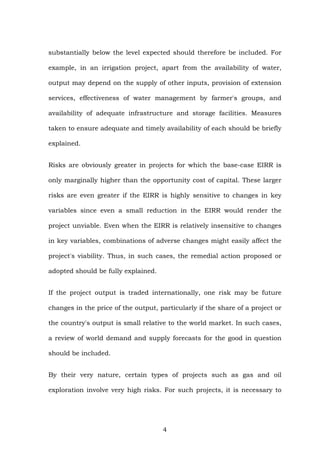
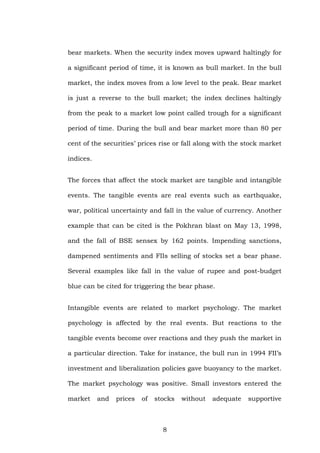
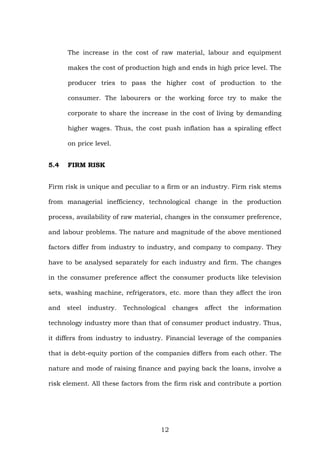
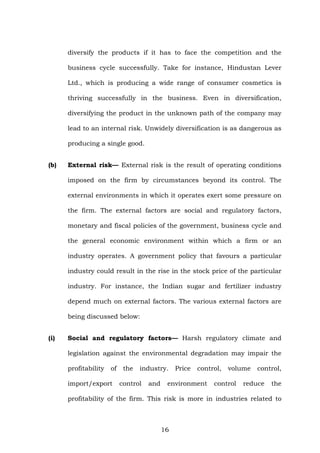
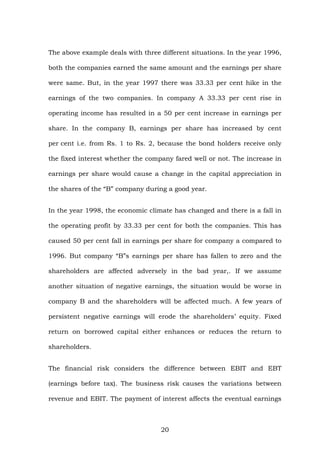
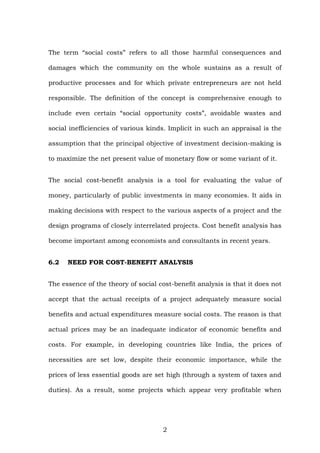
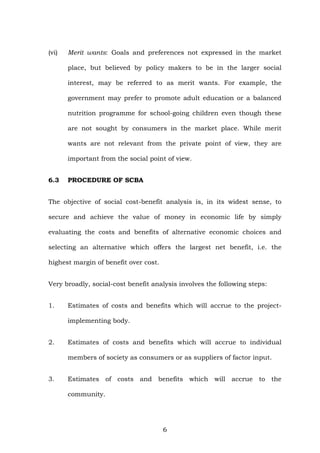
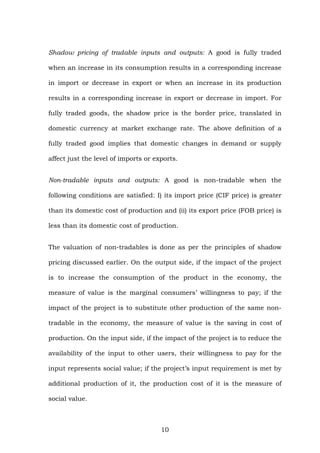
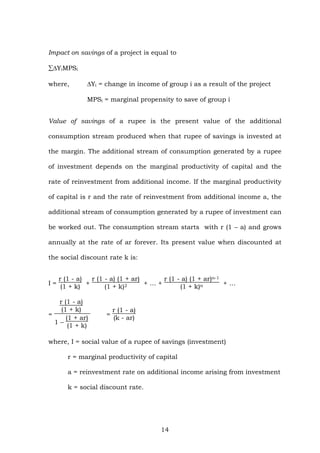
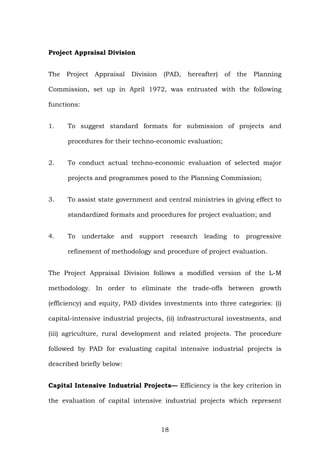
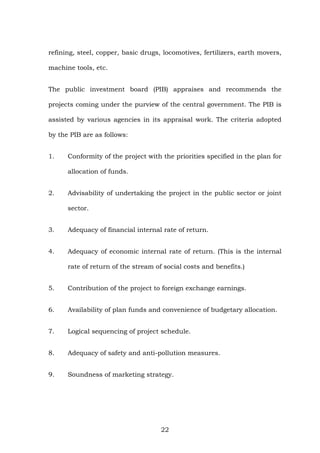
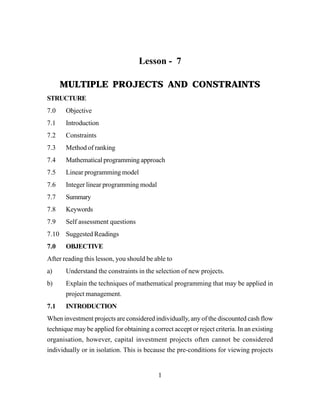
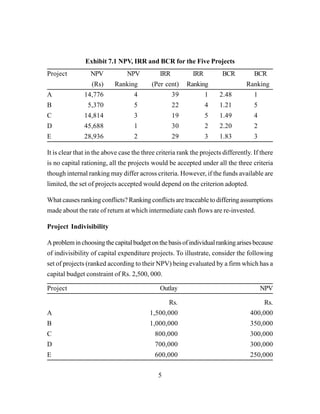
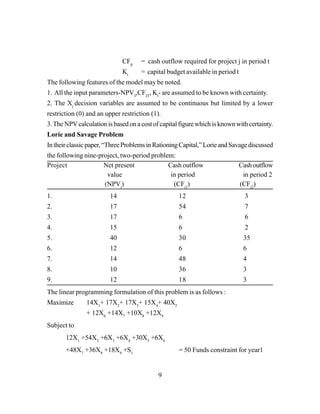
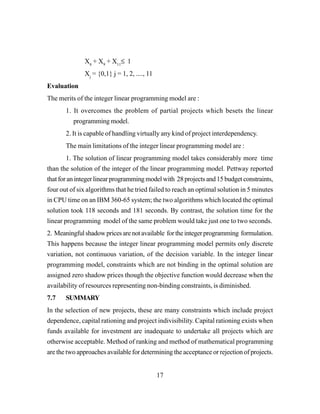
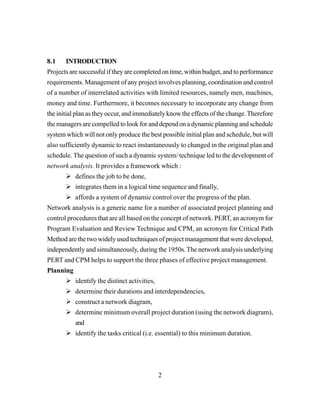
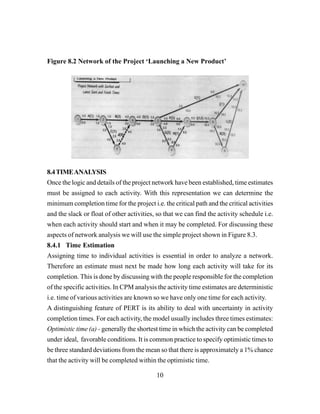
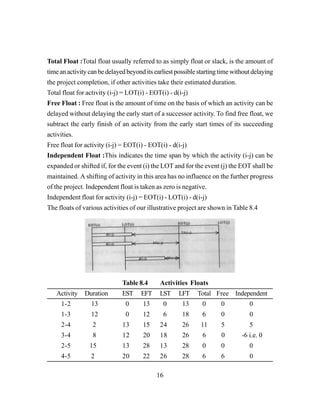
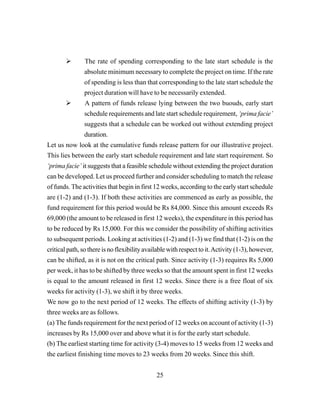
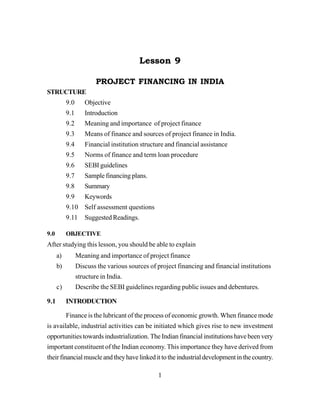
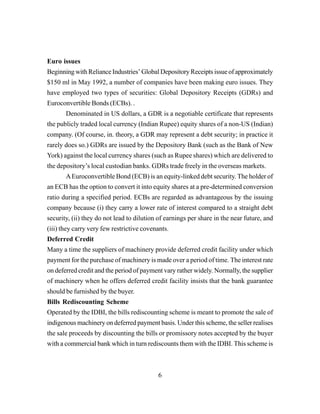
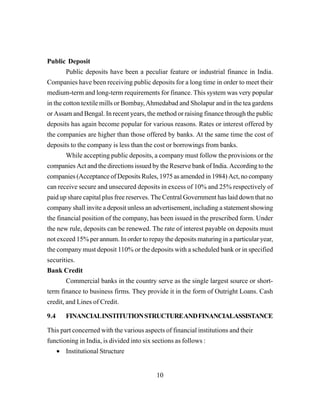
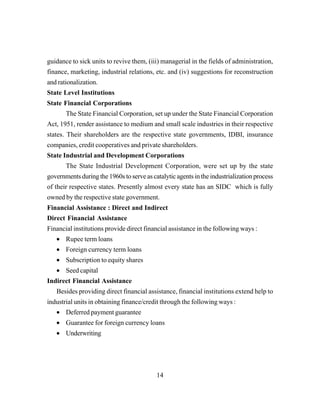
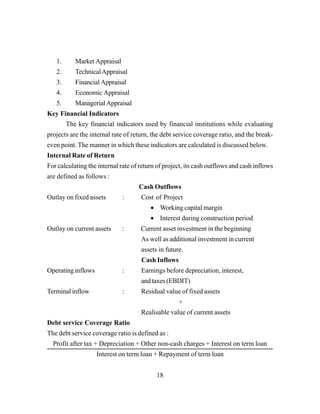
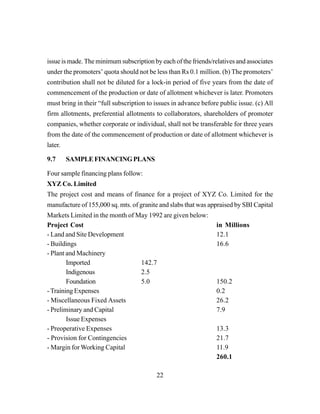
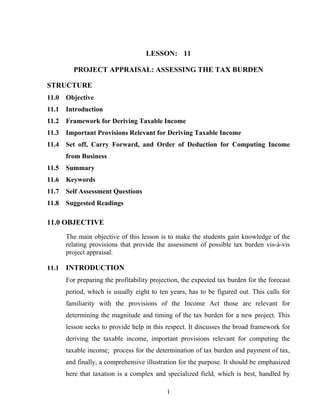
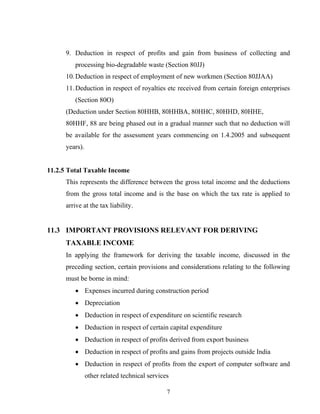
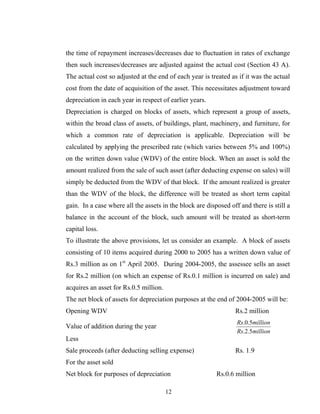
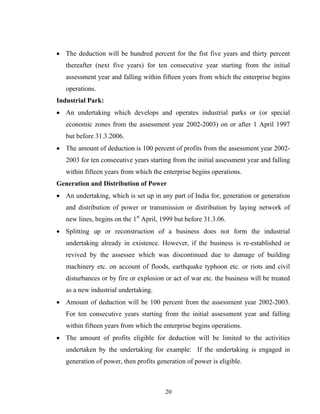
8.4.2.2 Calculate the Latest Occurrence Time (LOT) for each Event.
The LOTfor an event represents the latest allowable time by which the event can occur,
given the time that is allowed for the completion of the project (occurrence of end
event). Normally the time allowed for the completion of the project is set equal to the
EOT of the end event (In other words, the project is supposed to be completed at the
earliest possible time). This means that for the end event the LOT and EOT are set
equal. The LOT for various events is obtained by working backward for the end event.
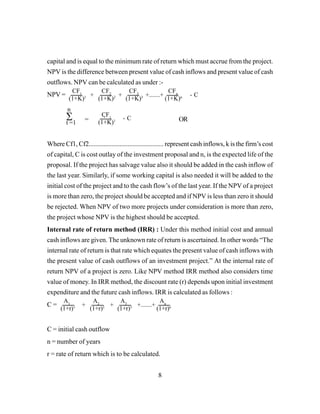
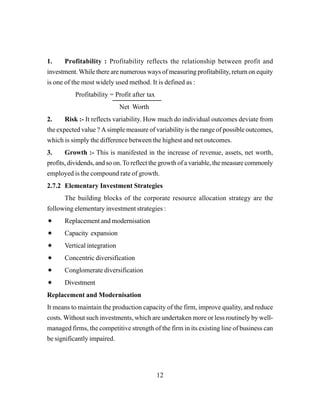
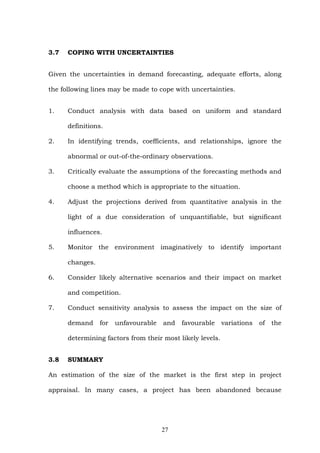
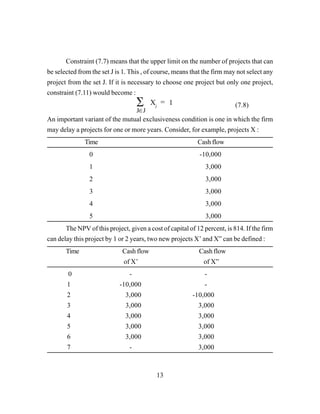
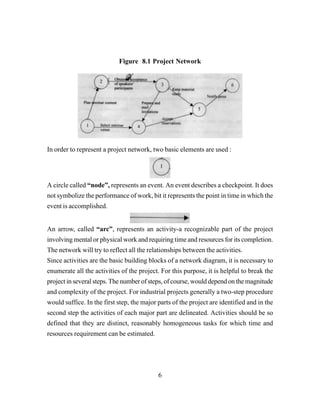
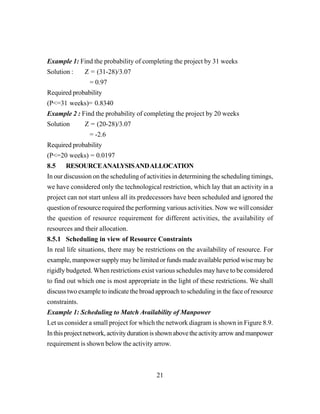
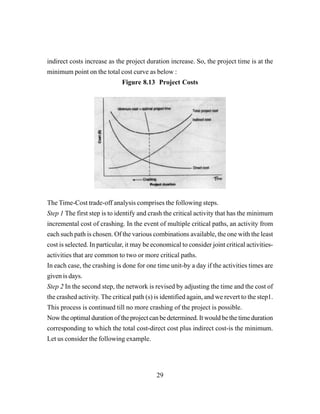
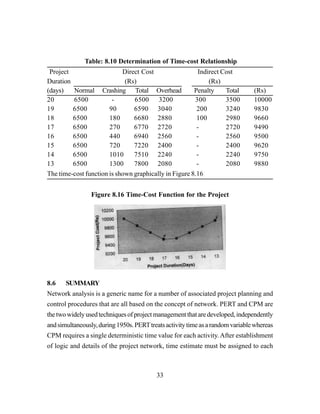
This procedure is known as the backward pass. The LOT for event 4 in our illustrative
project, for example, is equal to the LOT for event 5, the end event, minus the duration
of the activity (4-5), which connects event 4 with 5. Since the LOT for event 5 is 28
weeks and duration of activity (4-5) is 2 week the LOT for event 4 is 26 weeks (28-2).
This represents the latest time by which event 4 should occur to enable the project to
be completed in 28 weeks. Likewise, the LOT for other events can be calculated by
moving backward. The LOT for various events is shown (in the right quarter of the
lower half of event nodes) in Figure 8.4
Figure 8.4 Network with EOT and LOT of Events
The general formula for LOT is :
LOT(i) = Min [LOT(i) - d(i-j)]
where LOT(i) = latest occurrence time of event i
LOT(i) = latest occurrence time of event j (ij follows i & there may be several
j’s)
d(i-j) = duration of activity (i-j).](https://image.slidesharecdn.com/economicsofprojectevaluationforreferencecpmmodule2-200331091020/85/Economics-of-project-evaluation-for-reference-cpm-module2-174-320.jpg)
![20
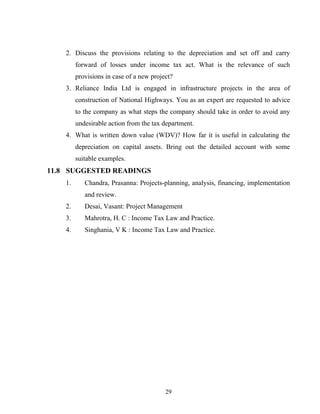
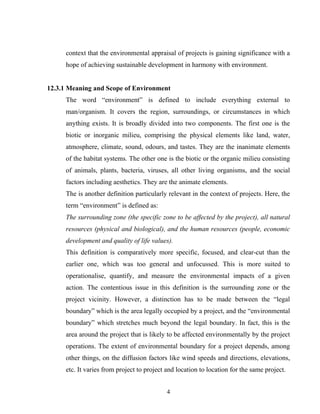
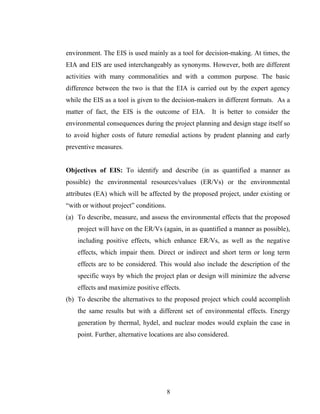
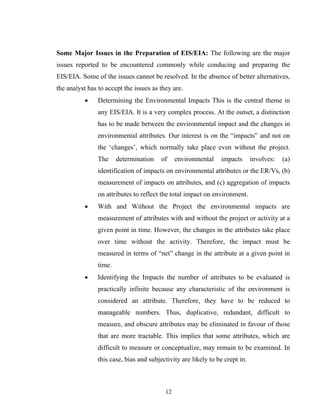
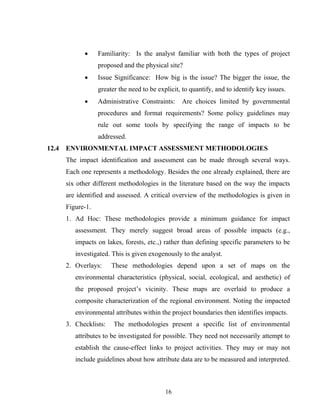
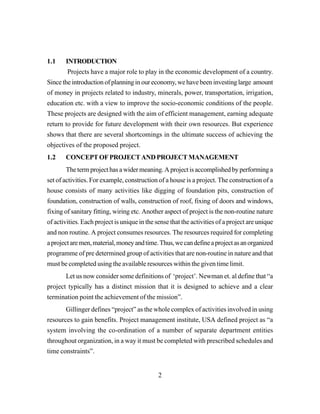
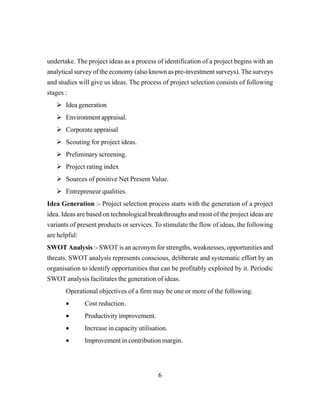
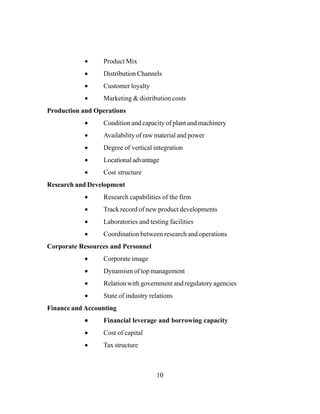
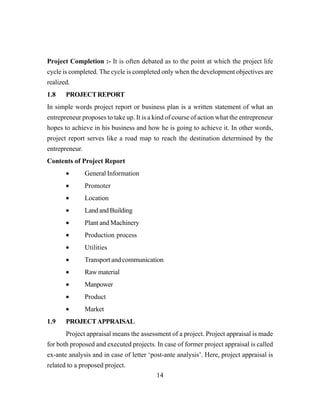
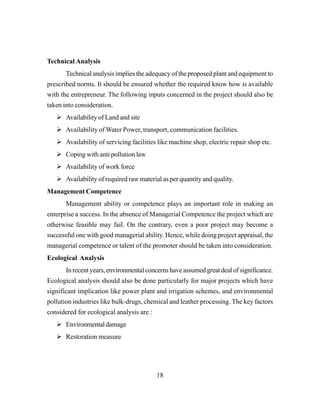
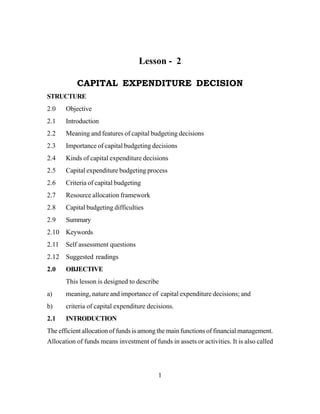
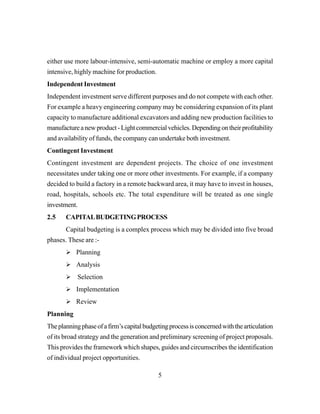
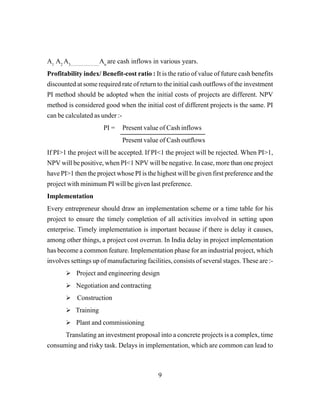
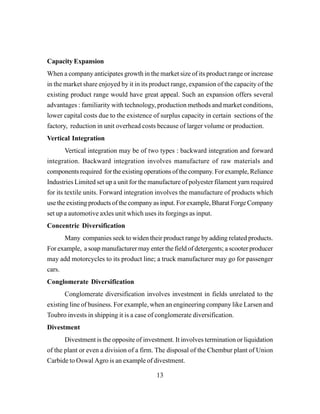
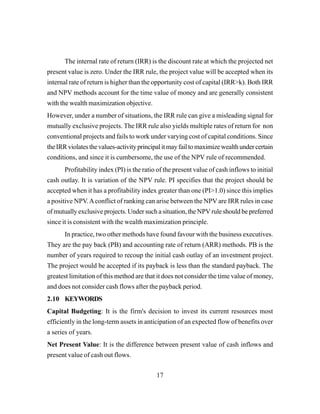
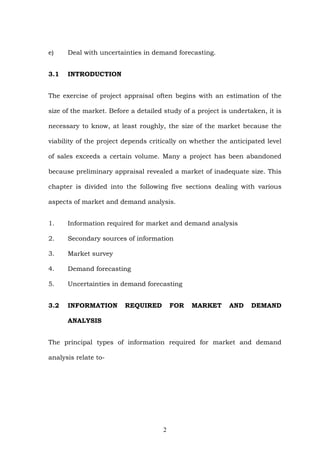
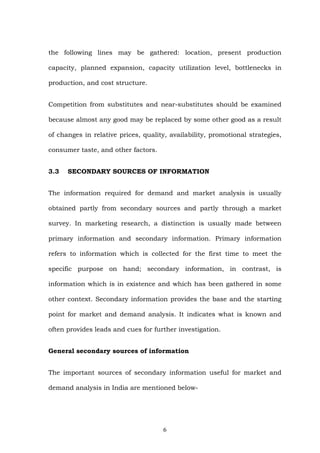
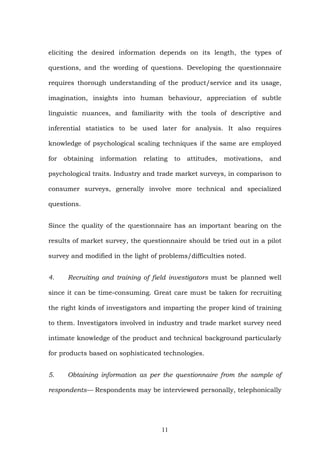
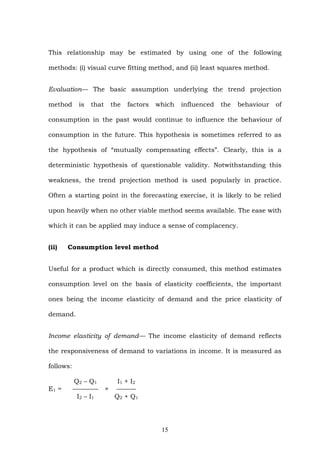
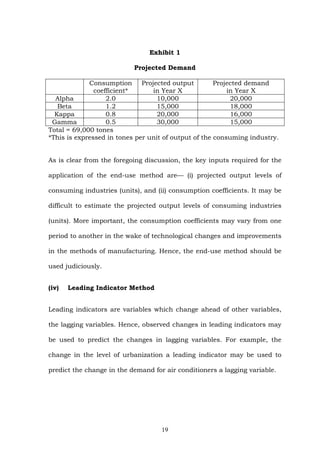
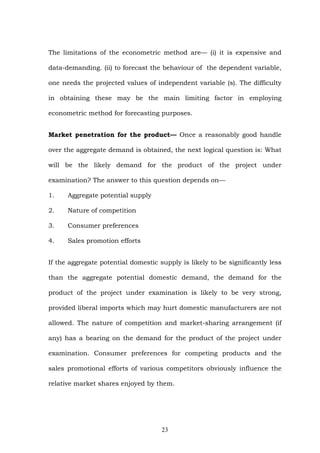
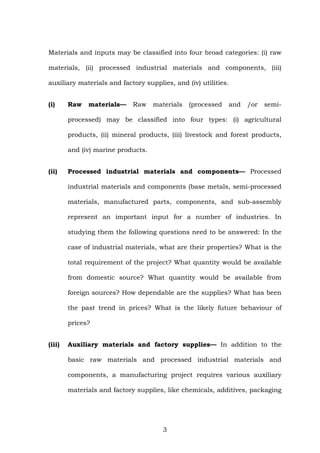
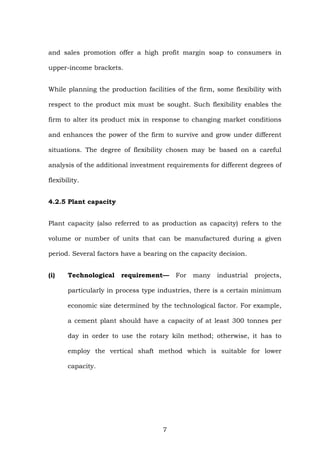
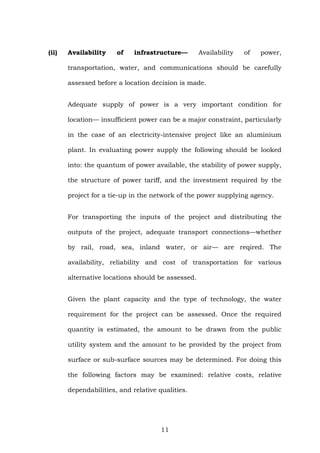
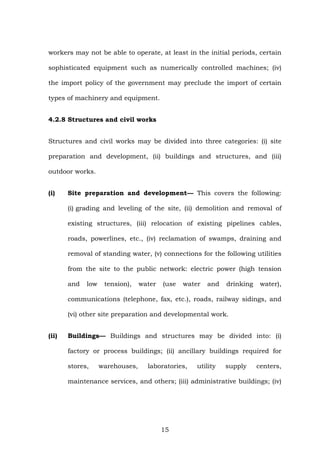
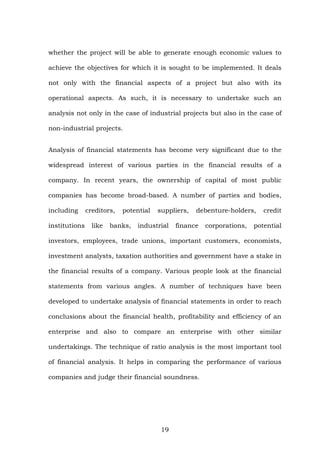
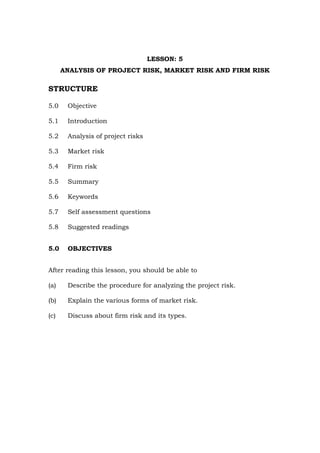
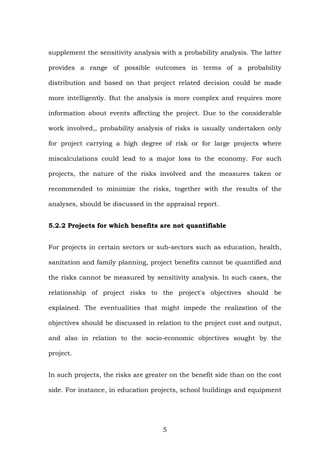
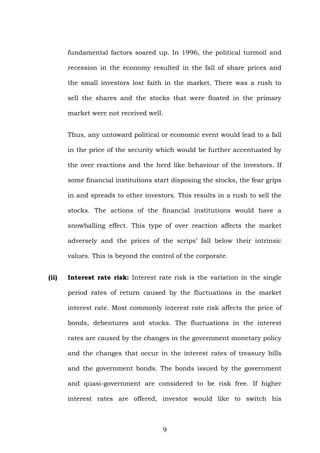
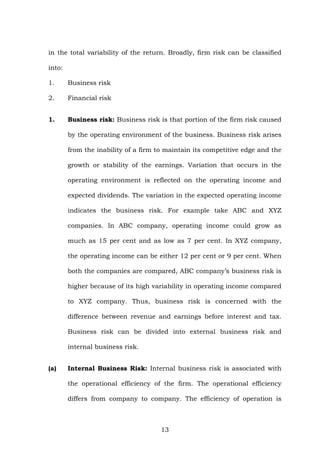
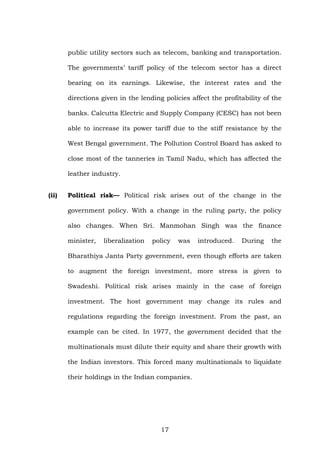
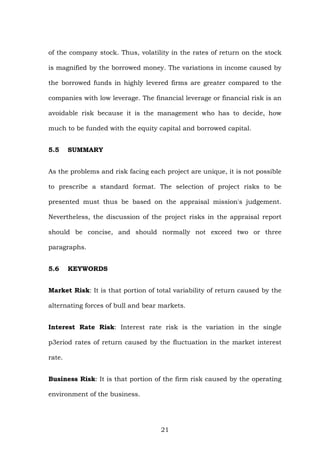
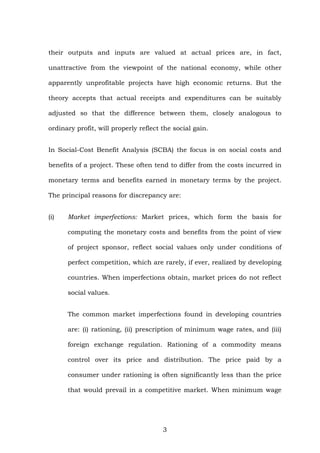
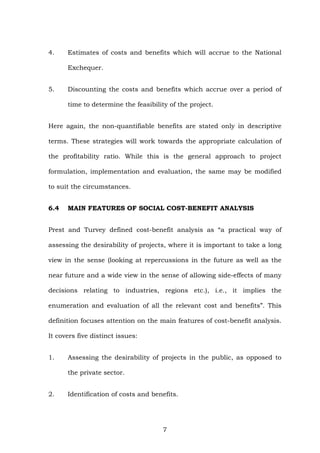
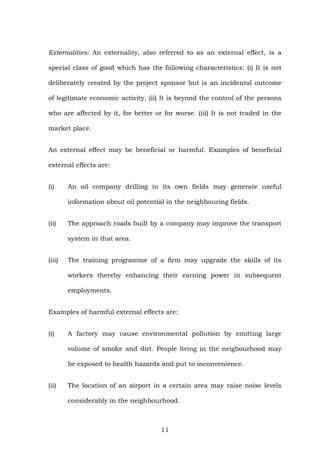
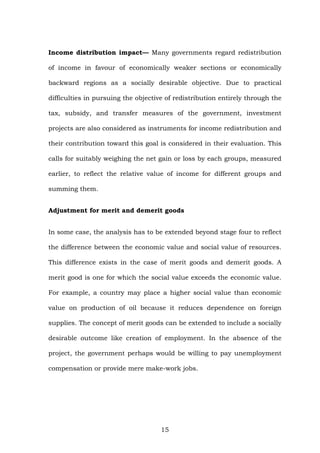
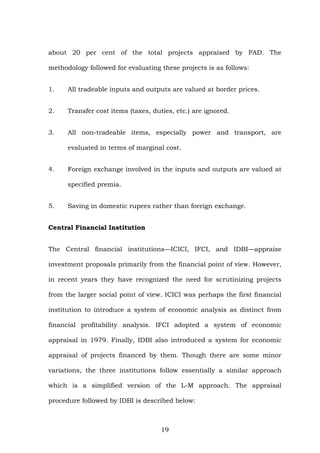
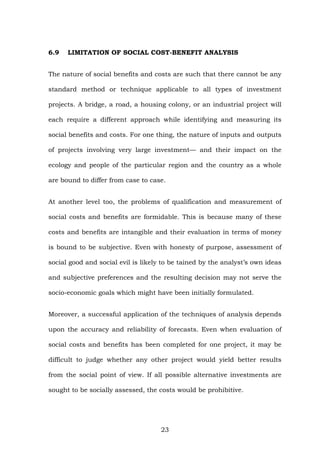
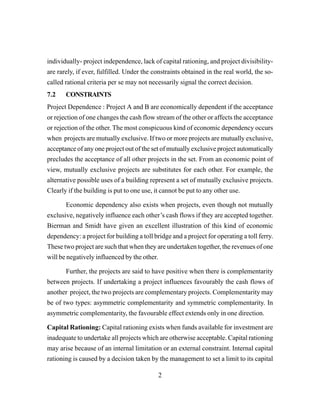
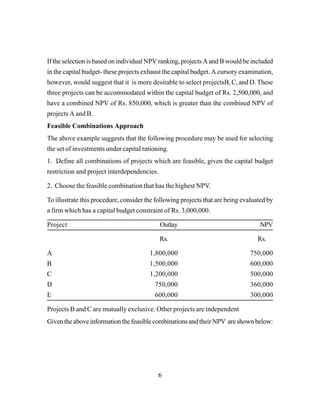
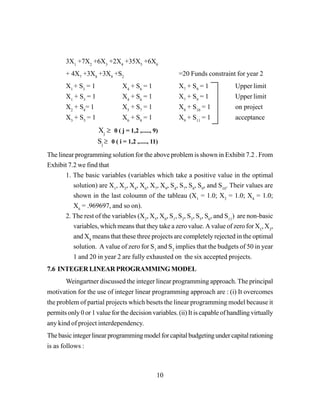
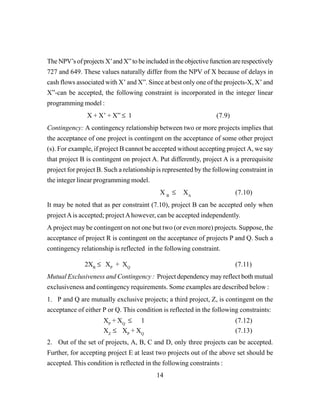
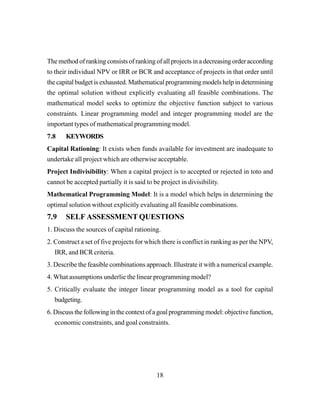
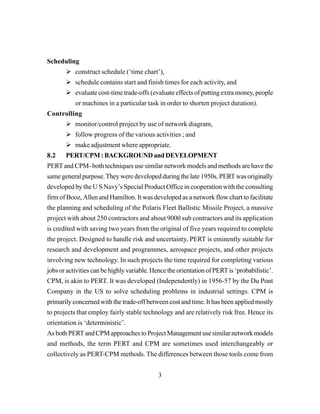
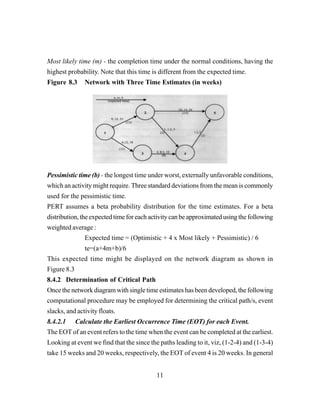
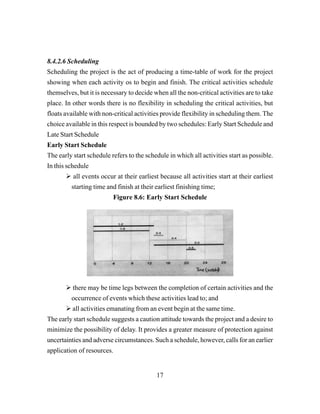
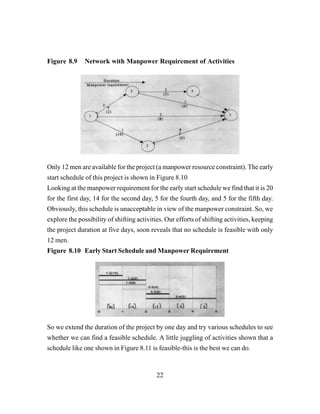
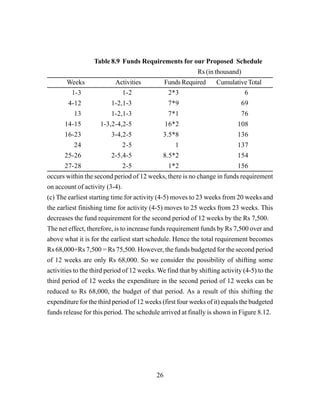
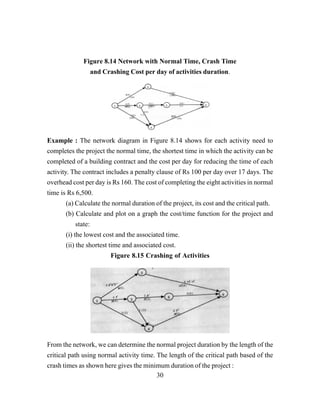
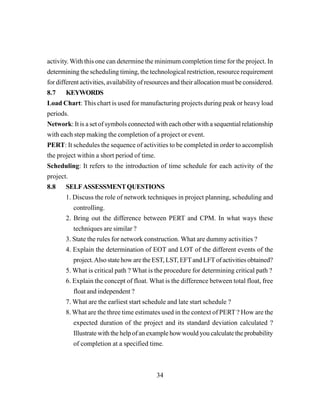
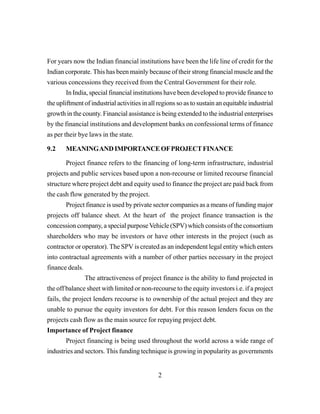
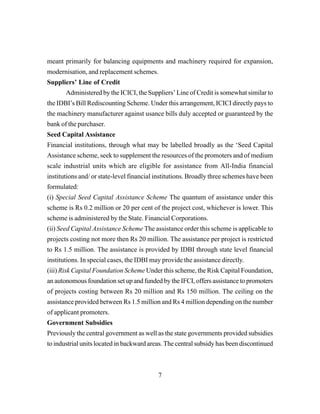
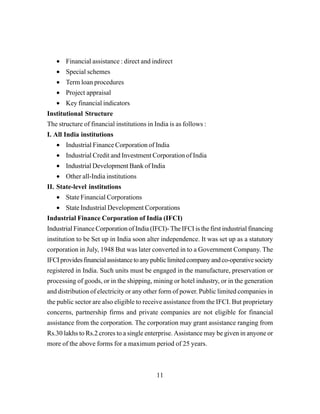
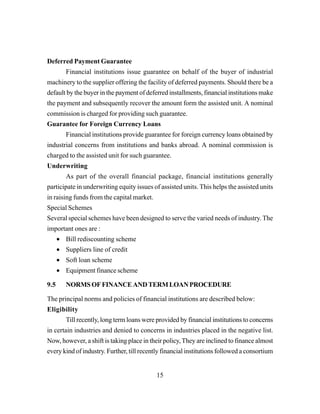
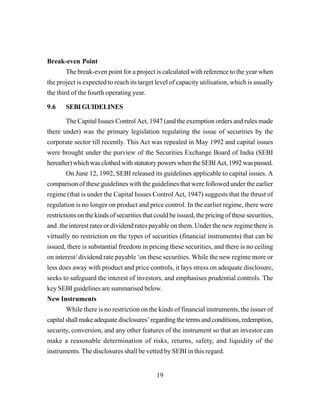
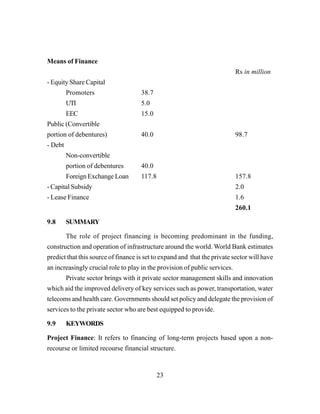
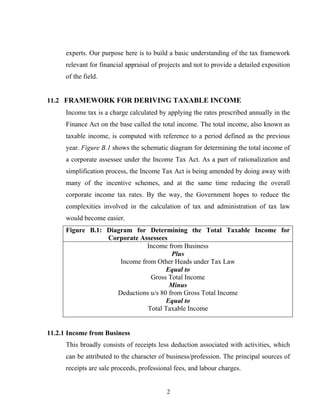
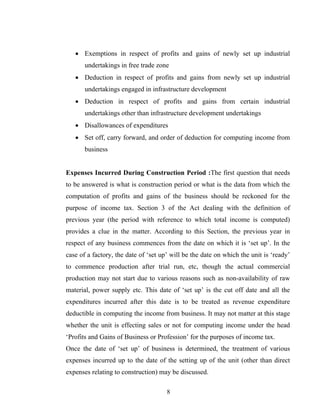
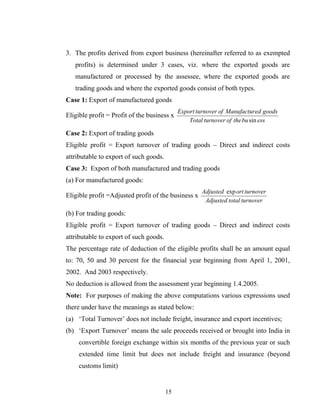
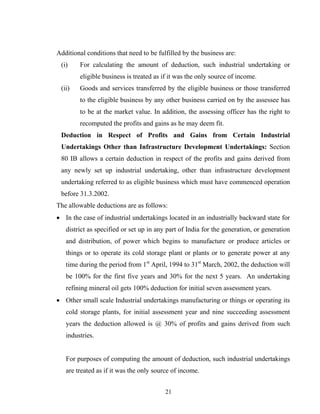
Variance and Standard Deviation of activities :
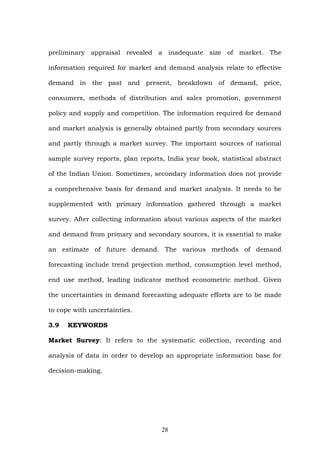
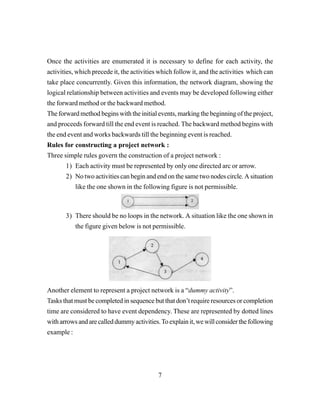
To calculate the variance for each activity completion time, if three standard deviation
times were selected for the optimistic and pessimistic times, then there are six standard
deviations between them, so
Variance = [(Pessimistic - Optimistic) / 6]2
Standard Deviation = [(Pessimistic - Optimistic) /6]
Table 8.5 Variance of activities
Activity b A Var = [(b-a) /6]2
1-2 21 9 4.00
2-5 24 10 5.44
Variance and Standard Deviation of Critical Path :
Variance = [(Pessimistic - Optimistic) /6 ]2
= 4.00+5.44
= 9.44
S.D = (9.44) 1/2
= 3.07
Now we know that mean and standard deviation of the critical path duration for our
project are 28 and 3.07 weeks, respectively. Given this information, we can calculate
the probability that the project will be completed by a certain date.
Probability of Completion by a Specified Date
Convert our specific normal distribution into standard normal distribution
(with mean and standard deviation equal to 0 and 1 restrictively) i.e.
Find z= (X- mean)/s.d.
Obtain cumulative probablity up to z looking at the probability distribution of
the standard normal variate (see Figure 8.8)](https://image.slidesharecdn.com/economicsofprojectevaluationforreferencecpmmodule2-200331091020/85/Economics-of-project-evaluation-for-reference-cpm-module2-181-320.jpg)

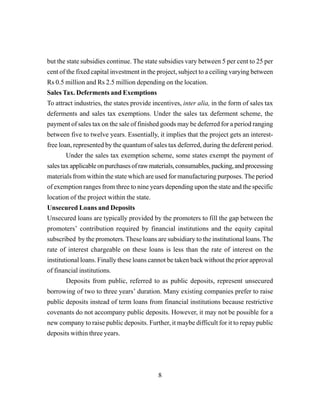
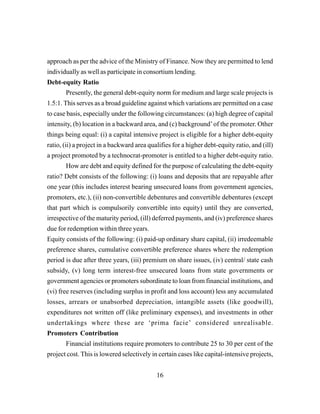
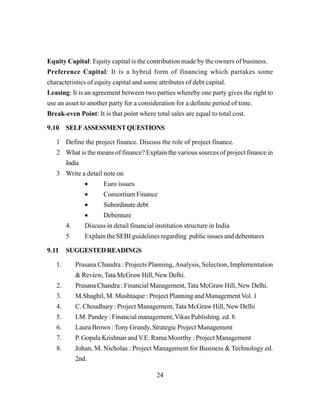
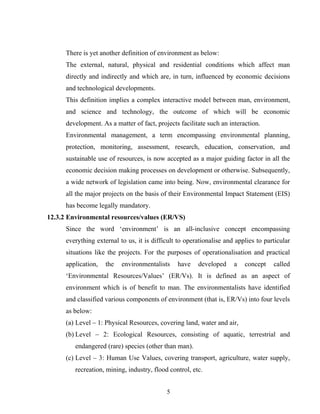
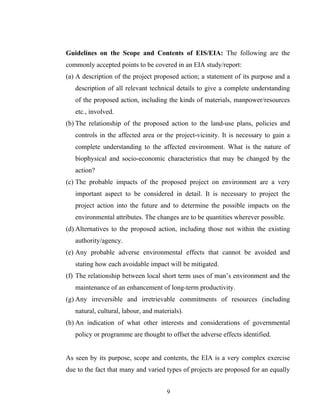
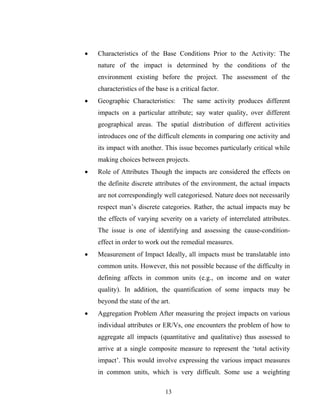
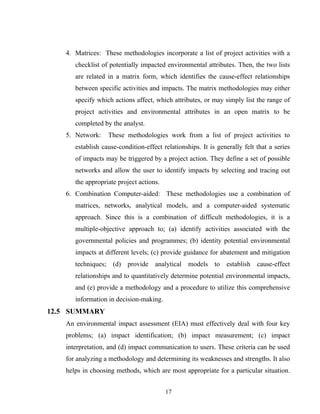
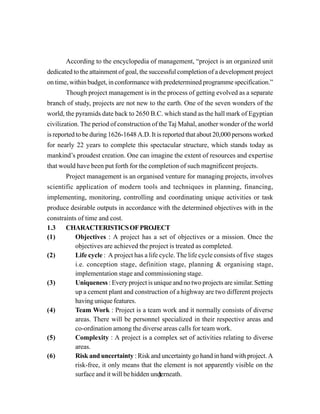
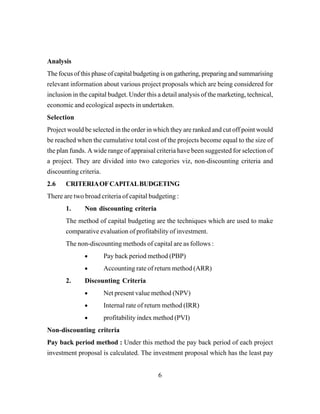
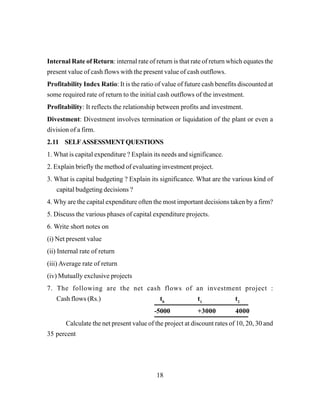
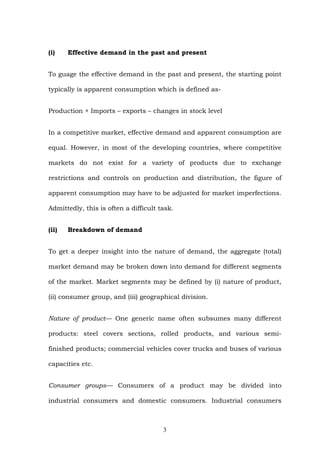
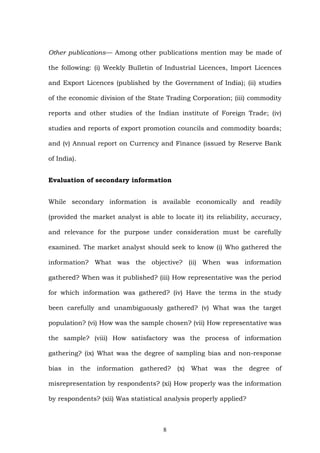
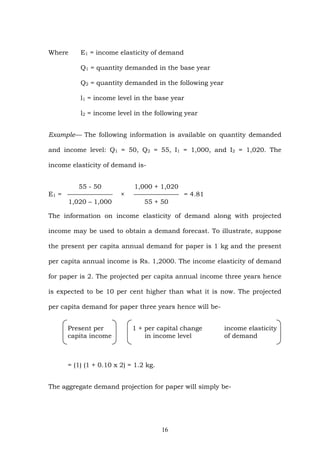
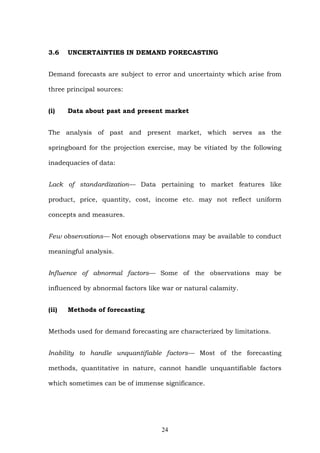
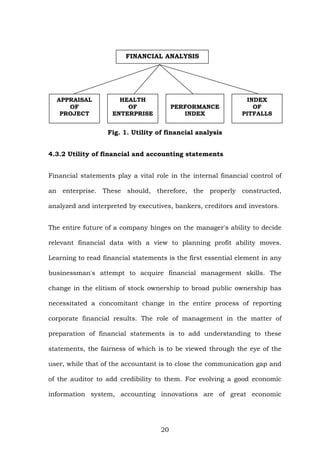
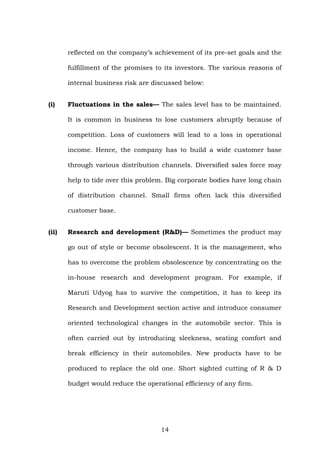
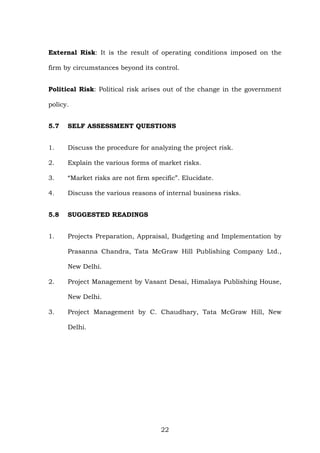
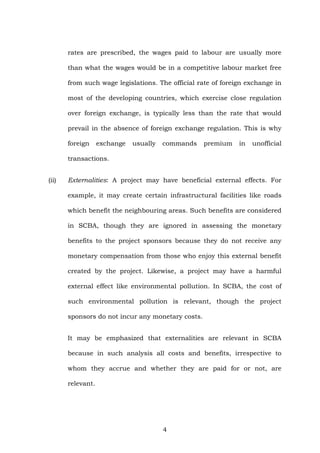
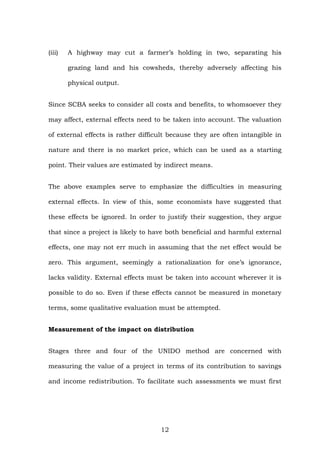
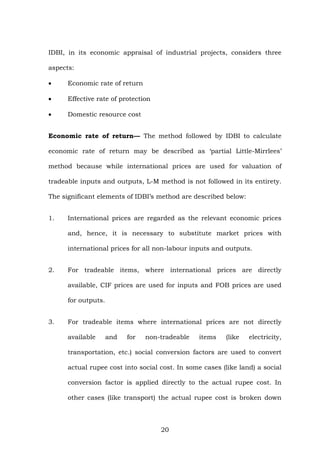
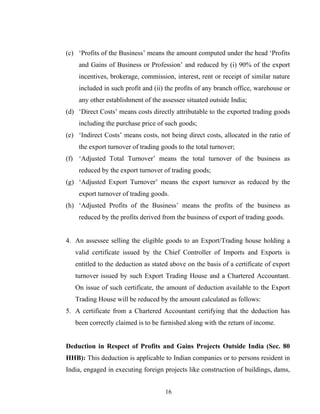
![The deductions can be classified as follows:
• Actual business expenses incurred. The major items included under this head
are: (i) rent, rates, taxes, insurance, repairs and maintenance in respect of
premises used for business (section 30); (ii) repairs, maintenance and
insurance in respect of plant and machinery (section 31); (iii) expenditure on
scientific research not being in the nature of capital expenditure related to the
business of the assessee (section 35); (iv) expenditure on scientific research by
certain notified businesses get weighted deductions; (v) insurance premium
paid in respect of insurance of stock or stores of the business; bad debt etc.
(section 36); (vi) any other expenditure (not being in the nature of capital
expenditure or personal expenses of the assessee) laid out or expended wholly
and exclusively for the purposes of the business/profession (section 37).
• Amortization of certain expenses. Certain expenses are incurred at one time
and a percentage of such expenses are allowed to be deducted against the
income over a number of years by way of amortization. These include: (i)
outlays on fixed assets which are depreciated at the rates prescribed under rule
5 of the Income Tax Rules (section 32); (ii) expenditure on patents and
copyrights (section 35A); (iii) expenditure for acquiring know-how (section
35 AB); (iv) preliminary expenses (section 35D); (v) expenditure on
prospecting of minerals (section 35A); (vi) expenditure incurred by an Indian
Company, for amalgamation or demerger of a company (section 35 DD) and
(vii) capital expenditure on family planning of employees (section 36).
• Capital expenditures of certain types. Though capital expenditures are not
normally allowed as a deduction in computing the business income, the
following capital expenditure can be deducted by virtue of certain provisions
of the Act: (i) capital expenditures on scientific research related to the
business carried on by the assessee [section 35 (1) (iv)]; (ii) capital
expenditure incurred in connection with the business consisting of prospecting
3](https://image.slidesharecdn.com/economicsofprojectevaluationforreferencecpmmodule2-200331091020/85/Economics-of-project-evaluation-for-reference-cpm-module2-225-320.jpg)
![for or extraction or production of mineral oils (section 42). (iii) capital
expenditure incurred in connection with acquiring any rights to operate
telecommunication services (section 35 ABB).
• Certain contribution. Payments made to (a) certain recognized scientific
research institutions to be used for scientific research [section 35 (1) (ii)]; (b)
certain recognized institutions to be used for research in social science or
statistical research [section 35 (1) (iii)]; (c) approved public sector companies
and institutions for promoting the social and economic welfare of, or the uplift
of, the public (section 35 AC); and (d) certain associations and institutions for
carrying out programmes of conservation of natural resources (section 35 CC
B) can be deducted for tax purposes.
In respect of contributions made to approved National Laboratories or a
University or an Indian Institute of Technology with a specific direction that the
amounts be used for scientific research undertaken under an approved
programme, an amount equal to 125% of the contribution is allowed as deduction
(35 2AA).
• Carried forward losses and allowances. In computing the business income,
losses and allowances carried forward from the previous year can be deducted
subject to compliance with certain conditions.
11.2.2 Income from other Heads Under Tax Law
The various other heads, the nature of income, and the deductions allowed under
these heads by the Act are shown below;
4](https://image.slidesharecdn.com/economicsofprojectevaluationforreferencecpmmodule2-200331091020/85/Economics-of-project-evaluation-for-reference-cpm-module2-226-320.jpg)
![Indirect Expenditure Relating to Construction: These consist of expenses like
financial charges, remuneration of various personnel engaged in construction
activity, traveling and other expenses incurred for the purpose of implementing
the project, depreciation on various assets used for the purpose of construction
and trial production expenses. These expenses are allowed to be capitalized, i.e.,
added to the value of various assets set up by allocating them over the items of
plant, machinery, buildings, etc., on some reasonable basis. The unit is permitted
to claim depreciation on the enhanced value of these assets arrived at after such
allocation and this value is referred to as the ‘actual cost’ of the assets. Such
actual cost is reduced by that portion, if any, as has been met directly or indirectly
by any other person or authority [Section 43 (1)].
Indirect Expenditure not Relating to Construction: There are several expenses
incurred during the construction period, which are not in any way related to
construction. Examples: expenses on the marketing department, expenses
incurred due to the corporate status of the unit. Such expenses are not allowed to
be capitalized nor are they allowed to be deducted from the income of the
subsequent years. From the point of view of financial accounting, these expenses
are treated as deferred revenue expenses and are written off over a period of time.
From the income tax point of view, however, the company does not derive the
benefit of charging these expenses against revenue. Hence, it is preferable that
such expenses are incurred, as far as possible, after the date of setting up of the
unit.
Expenditure on Technical Know-how: Capital Expenditure incurred on
technical know-how, incurred after 1st
April, 1998 can be capitalized as direct
expenditure related to construction or can be by itself treated as an intangible
asset, on which depreciation can be claimed under section 32. Revenue
10](https://image.slidesharecdn.com/economicsofprojectevaluationforreferencecpmmodule2-200331091020/85/Economics-of-project-evaluation-for-reference-cpm-module2-232-320.jpg)
![In the above example, if the sale proceeds (after deducting selling expense) had
been Rs.5 million, the difference between this amount and Rs.2.5 million should
be treated as short-term capital gain and the net block for purposes of depreciation
will be zero. Suppose, all the assets in the block (including the assets acquired
during the year) are sold for Rs.2.2 million (after deducting selling expense), the
balance of Rs.0.3 million remaining in the block amount will be treated as short-
term capital loss.
In may be noted that when any asset is acquired and put to use during the
previous year for a period less than 180 days then depreciation will be allowed
only to the extent of 50 percent of the prescribed rate for that asset in respect of
the year of acquisition.
Deduction in Respect of Expenditure on Scientific Research: Under Section
35, the following expenses relating to scientific research incurred during the
previous year are allowed as deduction in computing the income from business:
All expenses, both revenue and capital (other than cost of land) incurred on
scientific research relating to the business of the assessee. Such expenditures
incurred within three years before the commencement of business shall also be
deemed to be incurred in the year of commencement of business and accordingly
deductible in that year.
Contributions to approved scientific research associations/institutions, University
/ College, and to be used for scientific research are eligible for deduction of 125%
of the contribution made [section 35 (1)(ii)].
In respect of contributions made to approved National Laboratories or University
or Indian Institute of Technology, with a specific direction that the amounts be
used for scientific research undertaken under an approved programme, an amount
equal to 125% of the contribution is allowed as a deduction. [section 35 (2AA)].
13](https://image.slidesharecdn.com/economicsofprojectevaluationforreferencecpmmodule2-200331091020/85/Economics-of-project-evaluation-for-reference-cpm-module2-235-320.jpg)
![Contributions to approved institutions to be used for research in social science or
statistical research whether related to business or not are eligible for a deduction
of 125% of the contribution [section 35 (1)(iii)].
Section 35 (2 AB) allows a weighted deduction of one and one half times, on
revenue and capital expenditure (other than land and building) incurred on
approved in house research and development, of companies engaged in
manufacturing and production of drugs and pharmaceuticals, telecommunication
equipment, chemicals, bio-technology, computers and others notifies from time to
time. This deduction is available up to March 31, 2005. [section 35(2AB)].
Expenditure in the nature of capital expenditure incurred for acquiring any right
to operate telecommunication services, either before the commencement of
business or thereafter. Deduction can be claimed under section 35 ABB, starting
from the year in which the payment is made (or the business had commenced), in
equal instalments and ending in the year in which the licence comes to an end.
Deduction in Respect of Profits Derived from Export Business: Section 80
HHC allows deduction of a certain percentage out of the profits derived from
export business of a resident business entity or an Indian company. Various
conditions governing the grant of this deduction are as follows.
1. The assessee should be engaged in the business of export out of India of any
goods and merchandise. Exports of mineral oils and minerals and ores (other
than processed minerals and ores specified in the twelfth schedule to the
Income Tax Act) do not qualify for this deduction.
2. The sale proceeds from exports of such goods are receivable by the assessee in
convertible foreign exchange within a period of six months or such extended
time given by the Appropriate Authority from the end of the previous year in
which the export took place.
14](https://image.slidesharecdn.com/economicsofprojectevaluationforreferencecpmmodule2-200331091020/85/Economics-of-project-evaluation-for-reference-cpm-module2-236-320.jpg)
![roads, the assembly or installation of plant or machinery etc., for which
compensation is payable in convertible foreign exchange [Section 80 HHB].
The conditions governing the deduction are as follows:
• Separate books of accounts are to be maintained for such projects
• The accounts must be audited and a report prepared in the prescribed format
• The assessee is required to credit the Foreign Projects Reserve Account the
specified percentage of profits. The amount credited to the ‘Reserve Account’
is required to be utilized by the assessee before the expiry of a period of five
years following the previous year in which the amount was credited which
must be used for the purpose of the business and not for distribution as
dividends.
• The specified percentage of profits is also required to be remitted to India in
convertible foreign exchange
• The amount that can be claimed is specified percentage of the profits and
gains of such business.
The specified percent is 30% for the assessment year commencing from 1.4.2002
and there after this deduction is reduced by 10% each year. No deduction is
allowed from the assessment year beginning 1.4.2005.
Profits from the Export of Computer Software and Other Related Technical
Service [Section 80 HHE]: The deduction is allowed for an Indian Company or a
person other than company resident in India, and is a Software developer, and has
export out of India of computer software or its transmission from India to a place
outside India by any means or has providing technical services outside India in
connection with the development or production of computer software.
For the purpose, profit derived from the business specified above is determined as
follows:
Eligible Profits =
turnoverTotal
turnoverExport
x Profit of the business
17](https://image.slidesharecdn.com/economicsofprojectevaluationforreferencecpmmodule2-200331091020/85/Economics-of-project-evaluation-for-reference-cpm-module2-239-320.jpg)
![The deduction allowable is 60% of eligible profits for the assessment year 2002-
2003, reduced to 40% and so on in the subsequent assessment years, and is being
phased out in a gradual manner such that no deduction will be available for the
assessment years commencing on 1.4.2005 and subsequent years.
The terms export turnover, total turnover and profit of business have been defined
specifically in the section.
In order to claim the deduction, the assessee is required to furnish an audit report
in the prescribed form along with the return of income.
Exemptions in Respect of Profits and Gains of Newly Set Up Industrial
Undertakings in Free Trade Zones [Section 10A]: Newly established industrial
undertakings in free trade zones, electronic hardware technology parks, software
technology parks, or special economic zones, can claim exemption of 100% of
their profits and gains derived from such exports for a period of ten years
beginning with assessment year relevant to the previous year in which the
industrial undertaking begins to manufacture or produce articles or things.
Sale proceeds must be brought into India in convertible foreign exchange within
the specified period. The exemption will not go beyond assessment year 2009-
2010. The amount of profit that is eligible for deduction is calculated in the ratio
of the export turnover to total turnover of the business. This section applies to
Kandla Free Trade Zone, Santacruz Electronics Export Processing Zone or any
other free trade zone as prescribed by the central government by notification in
the Official Gazette or the technology parks set up under a scheme notified by the
central government, for the purposes of this section.
Newly Established Hundred Per Cent Export Oriented Undertakings
[Section 10B]: This provision extends the same type of benefit as allowed for the
industrial undertakings set up in a free trade zone or technology park, to newly
established undertakings recognized as 100% Export Oriented Undertaking. For
18](https://image.slidesharecdn.com/economicsofprojectevaluationforreferencecpmmodule2-200331091020/85/Economics-of-project-evaluation-for-reference-cpm-module2-240-320.jpg)
![For computing the profits of the eligible business as previously mentioned, past
losses and Unabsorbed allowances relating to such business is deducted even
though such past losses, etc., have already been absorbed by other incomes in the
past.
For both Sections 80IA and 80 IB the following conditions apply;
• The splitting up, or reconstruction, of a business already in existence,
does not form it.
• The transfer does not form it to a new business of a machinery or plant
previously used for any purpose.
• In the case of an industrial undertaking other than a small scale industry
or an industry set up in a backward state, it manufactures or produces any
articles or things other than articles or things specified on the list in the
Eleventh Schedule;
• It employs ten or more workers in a manufacturing process carried on
with the aid of power or employ twenty, or more workers in a
manufacturing process carried on without the aid of power.
Disallowances :The Income Tax Act provides that though certain expenses are
incurred by the assessee during the previous year, they will not be allowed as a
deduction (partly or fully) in computing the income under the head ‘Profits and
Gains of Business or Profession’ under certain circumstances. The more
important of these items are mentioned below:
1. Advertisement expenditure in the material published by any political party is
disallowed in full [Section 37 (2B)].
2. Any expenditure incurred by the assessee who is prohibited by law will not be
allowed as deduction. (Section 37).
22](https://image.slidesharecdn.com/economicsofprojectevaluationforreferencecpmmodule2-200331091020/85/Economics-of-project-evaluation-for-reference-cpm-module2-244-320.jpg)
![3. Expenditure because supply of goods, services, or facilities by certain
specified related persons/organizations, which is in the opinion of the
assessing officer, is excessive or unreasonable can be disallowed [Section 40A
(2)].
4. Expenditure in respect of which payment is made in a sum exceeding
Rs.20,000/-, at a time, otherwise than by crossed cheque or bank draft (except
in certain exempted cases) is disallowed in full [Section 40A (3)].
5. Contributions to unapproved gratuity or other funds of employees are
disallowed in full [Section 40 A (7 and 9)].
6. Expenditures of the following kinds are allowed if they are not paid for within
the previous year or within a stipulated time after the previous year: (a)
expenses on account of tax, duty, or fees, (b) contributions to any
provident/superannuating / gratuity/other welfare fund of employees, (c)
payment of bonus or commission to employees, and (d) interest on any loan or
borrowing from public financial institution (e) Interest on term loan from
scheduled banks (f) provision made for amount payable as in lieu of any leave
(leave encashment) (as defined in Section 4A of the Companies Act, 1956)
(Section 43B).
11.4 SET OFF, CARRY FORWARD, AND ORDER OF DEDUCTION FOR
COMPUTING INCOME FROM BUSINESS
Various deductions and allowances are considered in computing the income from
business as discussed in the previous section. If the result after providing for such
deductions and allowances is a negative figure in any year, this is allowed to be
set off against income from other heads and the remaining unabsorbed amount, if
any, can be carried forward to the next year and set off against the income of that
year and so on. The provisions relating to set off negative income and
23](https://image.slidesharecdn.com/economicsofprojectevaluationforreferencecpmmodule2-200331091020/85/Economics-of-project-evaluation-for-reference-cpm-module2-245-320.jpg)
![11.5 SUMMARY
Once the taxable income of the company (assessing the project appraisal) is
derived, the next step is the determination of the tax burden and its payment. For
this purpose, we need to know; (i) tax rates for companies, (ii) calculation of
Minimum Alternate Tax, (iii) provisions for payment of advance tax, and (iv)
provisions for payment of tax along with the filing return.
For tax purposes, companies are classified as domestic companies and foreign
companies and are taxed at 35% and 48% respectively. Though the rates of
income tax are prescribed annually in the Finance Act, the Income Tax Act it self
stipulates the rates of income tax in respect of certain types of incomes and these
generally relate to foreign companies in respect of incomes of the nature of
royalties, technical know-how fees, interest and dividends. In respect of long-
term capital gains, the Act prescribes rates of tax both for domestic as well as
foreign companies.
Such incomes are taxed at rates mentioned in the Act and the remaining total
income is taxed at the rates stated above.
The total tax liability computed as above is increased by an amount of surcharge
(at present 2 percent) on the tax computed.
In the case of an assessee, being a company, if the income tax is payable on the
total income as computed under the Act, is less than 7.5% of its book profit, the
tax payable for the relevant previous year shall be deemed to be 7.5% of such
book profit. That is every company will now be paying at least 7.5% of the book
profits as tax. [Section 115JB (1), inserted with effect from 1.4.2001].
In addition, a report in the prescribed format, from the accountant certifying that
the book profit has been computed in accordance with the provisions of this
section must be field along with the return of income.
The annual accounts prepared are in accordance with Parts II and III of Schedule
VI of the Companies Act using the accounting policies, accounting standards and
26](https://image.slidesharecdn.com/economicsofprojectevaluationforreferencecpmmodule2-200331091020/85/Economics-of-project-evaluation-for-reference-cpm-module2-248-320.jpg)