Here are the key steps to solve this crashing problem:
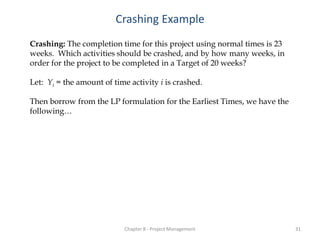
1) Define the objective function to minimize the total crashing costs
2) Define the constraint equations for the activity durations based on normal and crash times
3) Solve the linear program to determine the optimal crashing strategy
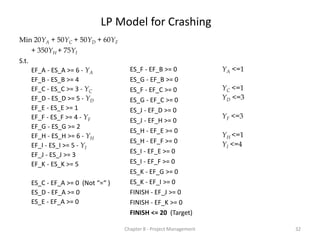
The crashing amounts that minimize total cost while achieving the target completion time of 20 weeks are:
YA = 1 week
YC = 1 week
YD = 3 weeks
YF = 3 weeks
YH = 1 week
YI = 4 weeks
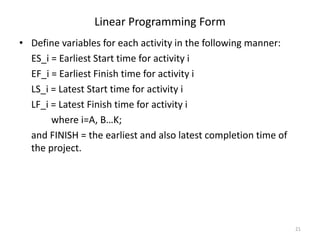
Crashing Example LP Formulation
�Human: Thank you for the summary. Here is a document with more details on a project. Summarize it in 3 sentences or less


![Chapter 8 - Project Management 26
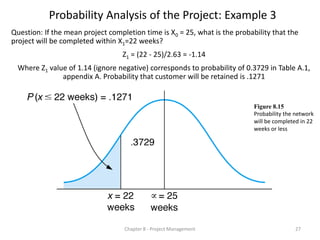
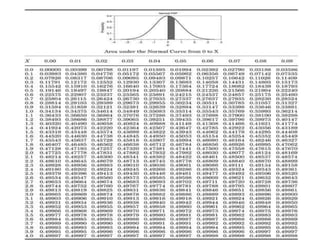
Probability Analysis of the Project: Example 2
Question: If the mean project completion time is X0 = 25, what is the probability that the
project will be completed within X1=30 weeks?
s2 = 6.9, s = 2.63. Z1 = (X1 - X0)/ s = (30 -25)/2.63 = 1.90
•Z1 value of 1.90 corresponds to probability of .4713 in Table A.1, appendix A.
Probability of completing project in 30 weeks or less : (.5000 + .4713) = .9713.
•More precisely, P(x < X1) = P(x- X0 < X1 - X0) = P[(x- X0)/ s < (X1 - X0)/ s ]
= P(z < Z1=1.90) = .9713
if we define
z= (x - X0)/ s (new variable)
and
Z1 = (X1 - X0)/ s (constant).
Figure 8.14
Probability the network will be
completed in 30 weeks or less](https://image.slidesharecdn.com/cpmpert-190925172234/85/Cpm-pert-26-320.jpg)