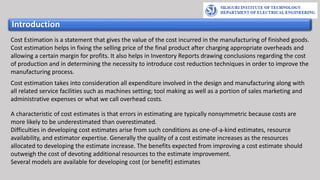
Study on Air-Water & Water-Water Heat Exchange in a Finned Tube Exchanger
cost estimation model per unit model and segmenting model.pdf
1. SILIGURI INSTITUTE OF TECHNOLOGY
DEPARTMENT OF ELECTRICAL ENGINEERING
Presentation on:-- COST ESTIMATING MODELS - PER UNIT MODEL & SEGMENTING MODEL
Course Name:- Economics For Engineers Course Code:-HM-EE 601
Presented by
Name : ARNAB CHAKRABORTY
Roll : 11901621017
Department : ELECTRICAL ENGINEERING
Semester : 6TH SEMESTER
3. Introduction
Cost Estimation is a statement that gives the value of the cost incurred in the manufacturing of finished goods.
Cost estimation helps in fixing the selling price of the final product after charging appropriate overheads and
allowing a certain margin for profits. It also helps in Inventory Reports drawing conclusions regarding the cost
of production and in determining the necessity to introduce cost reduction techniques in order to improve the
manufacturing process.
Cost estimation takes into consideration all expenditure involved in the design and manufacturing along with
all related service facilities such as machines setting; tool making as well as a portion of sales marketing and
administrative expenses or what we call overhead costs.
A characteristic of cost estimates is that errors in estimating are typically nonsymmetric because costs are
more likely to be underestimated than overestimated.
Difficulties in developing cost estimates arise from such conditions as one-of-a-kind estimates, resource
availability, and estimator expertise. Generally the quality of a cost estimate increases as the resources
allocated to developing the estimate increase. The benefits expected from improving a cost estimate should
outweigh the cost of devoting additional resources to the estimate improvement.
Several models are available for developing cost (or benefit) estimates
4. Per-unit models (unit Technique)
Cost per unit information is needed in order to set prices high enough to generate a profit. The cost per unit is derived
from the variable costs and fixed costs incurred by a production process, divided by the number of units produced.
Variable costs, such as direct materials, vary roughly in proportion to the number of units produced, though this cost
should decline somewhat as unit volumes increase, due to greater volume discounts. Fixed costs, such as building rent,
should remain unchanged no matter how many units are produced, though they can increase as the result of additional
capacity being needed (known as a step cost, where the cost suddenly steps up to a higher level once a specific unit
volume is reached). Examples of step costs are adding a new production facility or production equipment, adding a
forklift, or adding a second or third shift. When a step cost is incurred, the total fixed cost will now incorporate the new
step cost, which will increase the cost per unit. Depending on the size of the step cost increase, a manager may want to
leave capacity where it is and instead outsource additional production, thereby avoiding the additional fixed cost. This is a
prudent choice when the need for increased capacity is not clear.
Formula for the Cost per Unit
Within these restrictions, then, the cost per unit calculation is:
(Total fixed costs + Total variable costs) ÷ Total units produced
The cost per unit should decline as the number of units produced increases,
primarily because the total fixed costs will be spread over a larger number of
units (subject to the step costing issue noted above). Thus, the cost per unit is
not constant.
5. Segmenting Model
The segmenting model partitions the total estimation task into segments. Each segment is estimated, then the segment
estimates are combined for the total cost estimate.
Cost indexes can be used to account for historical changes in costs. The widely reported Consumer Price Index (CPI) is an
example. Cost index data are available from a variety of sources. Suppose A is a time point in the past and B is the current
time. Let IVA denote the index value at time A and IVB denote the current index value for the cost estimate of interest. To
estimate the current cost based on the cost at time A, use the equation:
Cost at time B = (Cost at time A) (IVB / IVA).
The power-sizing model accounts explicitly for economies of scale. For example, the cost of constructing a six-story
building will typically be less than double the construction cost of a comparable three-story building. To estimate the cost
of B based on the cost of comparable item A, use the equation
Cost of B = (Cost of A) [ ("Size" of B) / ("Size" of A) ] x
where x is the appropriate power-sizing exponent, available from a variety of sources. An economy of scale is indicated by
an exponent less than 1.0 An exponent of 1.0 indicates no economy of scale, and an exponent greater than 1.0 indicates a
diseconomy of scale.
"Size" is used here in a general sense to indicate physical size, capacity, or some other appropriate comparison unit.
6. Cost Indexes
The cost index describes cost changes caused to entrepreneurs from acquisition of inputs
for a contract or an assignment. Costs are accrued by own labour input and various
products and services bought. Cost indices are sometimes also referred to as input indices.
The cost index describes changes in prices of cost factors relative to the selected base year.
Cost indices are calculated with a method where different cost factors are
weighted together by their proportions of total costs. The Laspeyres calculation index
formula is used in the calculation, whereby the weights are from the base year. Statistics
Finland produces cost indices for building construction and civil engineering, earth movers
and forest machinery, rail, taxi and ambulance transport.
Cost Indexes
7. Power-Sizing Model
The power-sizing model accounts explicitly for economies of scale. For example, the cost of constructing a six-
story building will typically be less than double the construction cost of a comparable three-story building. To
estimate the cost of B based on the cost of comparable item A, use the equation.
Triangulation
Triangulation is an analysis technique used in multi-method research designs. Many research projects utilize
more than one data collection method, leading to the development of different datasets. Datasets might be
those collected from a quantitative survey or participant observation, for example. The results from the
datasets are analyzed independently, but they also need to be compared to each other in some way. How
they are compared depends on the methodological framework used. Triangulation is one technique to
combine datasets, and three different kinds of triangulation can be distinguished: convergence,
complementarity, and divergence or dissonance. These three kinds of triangulation are discussed in detail
below.
8. Conclusion
Cost estimates help produce a reasonable budget for a task or project. For this to happen,
estimates should be both accurate and consistent. An estimate, which approximates the
cost to accomplish work, is needed to assist key personnel by allowing them to make
informed decisions.
The purpose of an estimate has a different meaning to different people involved in the
process. To the owner, it provides a reasonable, accurate idea of the costs.