Downloaded 45 times


![There is perfect positive
correlation [r=+1]](https://image.slidesharecdn.com/correlationalresearchdesignkartika-131206231100-phpapp01/85/Correlational-research-design-Kartika-Ajeng-A-5-320.jpg)
![There’s perfect negative
correlation [r=-1]](https://image.slidesharecdn.com/correlationalresearchdesignkartika-131206231100-phpapp01/85/Correlational-research-design-Kartika-Ajeng-A-6-320.jpg)
![There’s no correlation
[r=0]](https://image.slidesharecdn.com/correlationalresearchdesignkartika-131206231100-phpapp01/85/Correlational-research-design-Kartika-Ajeng-A-7-320.jpg)
![There’s high positive
correlation [r=.80]](https://image.slidesharecdn.com/correlationalresearchdesignkartika-131206231100-phpapp01/85/Correlational-research-design-Kartika-Ajeng-A-8-320.jpg)
![There’s low positive
corelation [r=.30]](https://image.slidesharecdn.com/correlationalresearchdesignkartika-131206231100-phpapp01/85/Correlational-research-design-Kartika-Ajeng-A-9-320.jpg)
![There’s low negative
correlation [r=-.20]](https://image.slidesharecdn.com/correlationalresearchdesignkartika-131206231100-phpapp01/85/Correlational-research-design-Kartika-Ajeng-A-10-320.jpg)

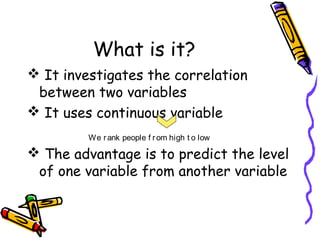
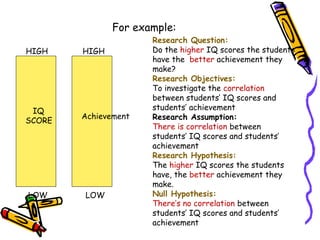
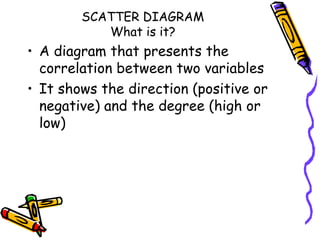
This document discusses correlational research, which investigates the relationship between two continuous variables through statistical analysis. It provides an example of correlating IQ scores and student achievement to determine if higher IQ scores predict better achievement. The research would aim to establish a correlation between the variables and test the hypothesis that a correlation exists against the null hypothesis that there is no correlation. Scatter diagrams are also discussed as a way to visually depict the direction and strength of any correlation between two variables.