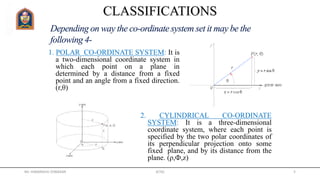
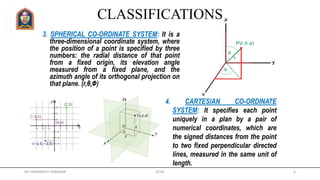
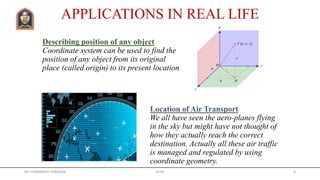
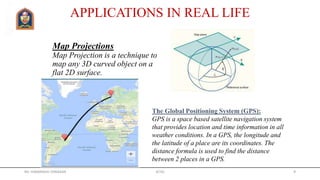
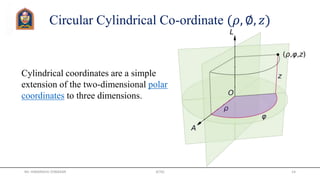
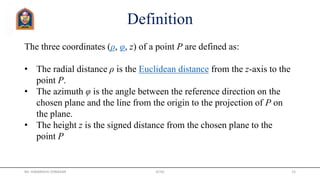
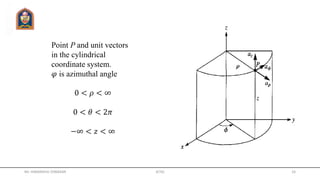
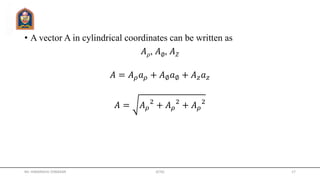
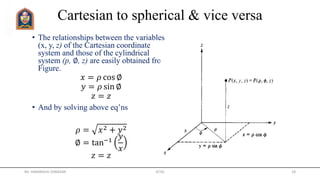
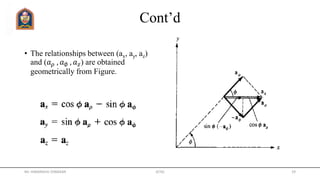
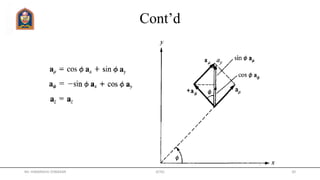
This document provides information about different coordinate systems including polar, cylindrical, Cartesian, and spherical coordinate systems. It describes key aspects of each system such as their components, definitions, relationships between variables in different systems, and applications. Real-world examples of how coordinate systems are used for map projections, global positioning systems, and air traffic control are also discussed.
Raster data is commonly obtained by scanning maps or collecting aerial photographs and satellite images. Scanned map datasets don't normally contain spatial reference information (either embedded in the file or as a separate file). With aerial photography and satellite imagery, sometimes the location information delivered with them is inadequate, and the data does not align properly with other data one has. Thus, to use some raster datasets in conjunction with other spatial data, we need to align or georeference them to a map coordinate system. A map coordinate system is defined using a map projection (a method by which the curved surface of the earth is portrayed on a flat surface). Georeferencing a raster data defines its location using map coordinates and assigns the coordinate system of the data frame. Georeferencing raster data allows it to be viewed, queried, and analyzed with other geographic data.
Generally, we georeference raster data using existing spatial data (target data)—such as georeferenced rasters or a vector feature class—that resides in the desired map coordinate system. The process involves identifying a series of ground control points—known x,y coordinates—that link locations on the raster dataset with locations in the spatially referenced data (target data). Control points are locations that can be accurately identified on the raster dataset and in real-world coordinates. Many different types of features can be used as identifiable locations, such as road or stream intersections, the mouth of a stream, rock outcrops, the end of a jetty of land, the corner of an established field, street corners, or the intersection of two hedgerows. The control points are used to build a polynomial transformation that will shift the raster dataset from its existing location to the spatially correct location. The connection between one control point on the raster dataset (the from point) and the corresponding control point on the aligned target data (the to point) is a link.
Finally, the georeferenced raster file can be exported for further usage.
THIS PRESENTATION IS TO HELP YOU PERFORM THE TASK STEP BY STEP.
This presentation is about the raster and vector data in GIS which is important and costly as well, through the presentation we will learn about both type of data.
One of most important topics in ArcGIS and GIS, is coordinate system, the slides will cover this topic in order to understand the difference between various coordinate systems.
Cylindrical and spherical coordinates shalinishalini singh
In this Presentation, I have explained the co-ordinate system in three plain. ie Cylindrical, Spherical, Cartesian(Rectangular) along with its Differential formulas for length, area &volume.
Coordinate systems
orthogonal coordinate system
Rectangular or Cartesian coordinate system
Cylindrical or circular coordinate system
Spherical coordinate system
Relationship between various coordinate system
Transformation Matrix
DIFFERENTIAL VECTOR
Curvilinear, Cartesian, Cylindrical, Spherical table
Application of particle swarm optimization in 3 dimensional travelling salesm...Maad M. Mijwil
Particle Swarm Optimization (PSO), one of the meta-heuristic methods used to solve optimization problems, Eberhart and Dr. It is an intuitive optimization technique that is categorized by population-based herd intelligence developed by Kennedy.
Sharing information in birds and fish, like people speaking or otherwise sharing information, points to social intelligence.
The PSO was developed by inspiring birds to use each other in their orientation and inspired by the social behavior of fish swarms.
In PSO, the individuals forming the population are called particles, each of which is assumed to move in the state space, and each piece carries its potential solution.
Each piece can remember the best situation and the particles can exchange information among themselves
5. AREAS AND VOLUMES (SUR) 3140601 GTUVATSAL PATEL
Introduction, computation of area, computation of area from field notes and plotted plans, boundary area, area of traverse, Use of Plannimeter, computations of volumes, Volume from cross sections, Trapezoidal and Prismoidal formulae, Prismoidal correction, Curvature correction, capacity of reservoir, volume from borrow pits.
Comprehensive coverage of fundamentals of computer graphics.
3D Transformations
Reflections
3D Display methods
3D Object Representation
Polygon surfaces
Quadratic Surfaces
Introduction, purpose, principle, instruments, methods of tacheometry, stadia constants, anallatic lens, Subtense bar, field work in tacheometry, reduction of readings, errors and precisions.
Welcome to WIPAC Monthly the magazine brought to you by the LinkedIn Group Water Industry Process Automation & Control.
In this month's edition, along with this month's industry news to celebrate the 13 years since the group was created we have articles including
A case study of the used of Advanced Process Control at the Wastewater Treatment works at Lleida in Spain
A look back on an article on smart wastewater networks in order to see how the industry has measured up in the interim around the adoption of Digital Transformation in the Water Industry.
Forklift Classes Overview by Intella PartsIntella Parts
Discover the different forklift classes and their specific applications. Learn how to choose the right forklift for your needs to ensure safety, efficiency, and compliance in your operations.
For more technical information, visit our website https://intellaparts.com
CW RADAR, FMCW RADAR, FMCW ALTIMETER, AND THEIR PARAMETERSveerababupersonal22
It consists of cw radar and fmcw radar ,range measurement,if amplifier and fmcw altimeterThe CW radar operates using continuous wave transmission, while the FMCW radar employs frequency-modulated continuous wave technology. Range measurement is a crucial aspect of radar systems, providing information about the distance to a target. The IF amplifier plays a key role in signal processing, amplifying intermediate frequency signals for further analysis. The FMCW altimeter utilizes frequency-modulated continuous wave technology to accurately measure altitude above a reference point.
Cosmetic shop management system project report.pdfKamal Acharya
Buying new cosmetic products is difficult. It can even be scary for those who have sensitive skin and are prone to skin trouble. The information needed to alleviate this problem is on the back of each product, but it's thought to interpret those ingredient lists unless you have a background in chemistry.
Instead of buying and hoping for the best, we can use data science to help us predict which products may be good fits for us. It includes various function programs to do the above mentioned tasks.
Data file handling has been effectively used in the program.
The automated cosmetic shop management system should deal with the automation of general workflow and administration process of the shop. The main processes of the system focus on customer's request where the system is able to search the most appropriate products and deliver it to the customers. It should help the employees to quickly identify the list of cosmetic product that have reached the minimum quantity and also keep a track of expired date for each cosmetic product. It should help the employees to find the rack number in which the product is placed.It is also Faster and more efficient way.
Hierarchical Digital Twin of a Naval Power SystemKerry Sado
A hierarchical digital twin of a Naval DC power system has been developed and experimentally verified. Similar to other state-of-the-art digital twins, this technology creates a digital replica of the physical system executed in real-time or faster, which can modify hardware controls. However, its advantage stems from distributing computational efforts by utilizing a hierarchical structure composed of lower-level digital twin blocks and a higher-level system digital twin. Each digital twin block is associated with a physical subsystem of the hardware and communicates with a singular system digital twin, which creates a system-level response. By extracting information from each level of the hierarchy, power system controls of the hardware were reconfigured autonomously. This hierarchical digital twin development offers several advantages over other digital twins, particularly in the field of naval power systems. The hierarchical structure allows for greater computational efficiency and scalability while the ability to autonomously reconfigure hardware controls offers increased flexibility and responsiveness. The hierarchical decomposition and models utilized were well aligned with the physical twin, as indicated by the maximum deviations between the developed digital twin hierarchy and the hardware.
Hybrid optimization of pumped hydro system and solar- Engr. Abdul-Azeez.pdffxintegritypublishin
Advancements in technology unveil a myriad of electrical and electronic breakthroughs geared towards efficiently harnessing limited resources to meet human energy demands. The optimization of hybrid solar PV panels and pumped hydro energy supply systems plays a pivotal role in utilizing natural resources effectively. This initiative not only benefits humanity but also fosters environmental sustainability. The study investigated the design optimization of these hybrid systems, focusing on understanding solar radiation patterns, identifying geographical influences on solar radiation, formulating a mathematical model for system optimization, and determining the optimal configuration of PV panels and pumped hydro storage. Through a comparative analysis approach and eight weeks of data collection, the study addressed key research questions related to solar radiation patterns and optimal system design. The findings highlighted regions with heightened solar radiation levels, showcasing substantial potential for power generation and emphasizing the system's efficiency. Optimizing system design significantly boosted power generation, promoted renewable energy utilization, and enhanced energy storage capacity. The study underscored the benefits of optimizing hybrid solar PV panels and pumped hydro energy supply systems for sustainable energy usage. Optimizing the design of solar PV panels and pumped hydro energy supply systems as examined across diverse climatic conditions in a developing country, not only enhances power generation but also improves the integration of renewable energy sources and boosts energy storage capacities, particularly beneficial for less economically prosperous regions. Additionally, the study provides valuable insights for advancing energy research in economically viable areas. Recommendations included conducting site-specific assessments, utilizing advanced modeling tools, implementing regular maintenance protocols, and enhancing communication among system components.
4. GeneralDefinition
A co-ordinate system is a system designed to establish positions with
respect to given reference points.
The co-ordinate system consists of one or more reference points, the style
of measurement (linear or angular) from those reference points, and the
directions (or axes) in which those measurements will be taken.
Mr. HIMANSHU DIWAKAR JETGI 4
5. 1. POLAR CO-ORDINATE SYSTEM: It is
a two-dimensional coordinate system in
which each point on a plane in
determined by a distance from a fixed
point and an angle from a fixed direction.
(r,θ)
2. CYLINDRICAL CO-ORDINATE
SYSTEM: It is a three-dimensional
coordinate system, where each point is
specified by the two polar coordinates of
its perpendicular projection onto some
fixed plane, and by its distance from the
plane. (ρ,Ф,z)
Mr. HIMANSHU DIWAKAR JETGI 5
6. CLASSIFICATIONS
4. CARTESIAN CO-ORDINATE
SYSTEM: It specifies each point
uniquely in a plan by a pair of
numerical coordinates, which are
the signed distances from the point
to two fixed perpendicular directed
lines, measured in the same unit of
length.
3. SPHERICAL CO-ORDINATE SYSTEM: It is a
three-dimensional coordinate system, where
the position of a point is specified by three
numbers: the radial distance of that point
from a fixed origin, its elevation angle
measured from a fixed plane, and the
azimuth angle of its orthogonal projection on
that plane. (r,θ,Ф)
Mr. HIMANSHU DIWAKAR JETGI 6
7. Learning Co-ordinate geometry is not just to clear your present class but also
helps your understanding in various ways. Like–
1. Geometry is applicable in computers or cell phones.
2. The text file or PDF file which we open is itself an example of coordinate
plane.
3. In these, the words or images are written or modified with the use of
coordinate geometry.
4. Any PDF file, which contains text, images and different shapes, are placed
according to the 2-dimentional coordinate (x, y) system.
5. All the concepts like distances, slopes and simple trigonometry are also
applicable here.
USES OF CO-ORDINATE SYSTEM
Mr. HIMANSHU DIWAKAR JETGI 7
8. Describing position of any object
Coordinate system can be used to find the
position of any object from its original
place (called origin) to its present location
APPLICATIONS IN REAL LIFE
Location of Air Transport
We all have seen the aero-planes flying
in the sky but might have not thought of
how they actually reach the correct
destination. Actually all these air traffic
is managed and regulated by using
coordinate geometry.
Mr. HIMANSHU DIWAKAR JETGI 8
9. Map Projections
Map Projection is a technique to
map any 3D curved object on a
flat 2D surface.
APPLICATIONS IN REAL LIFE
The Global Positioning System (GPS):
GPS is a space based satellite navigation system
that provides location and time information in all
weather conditions. In a GPS, the longitude and
the latitude of a place are its coordinates. The
distance formula is used to find the distance
between 2 places in a GPS.
Mr. HIMANSHU DIWAKAR JETGI 9
10. In real life, when weather forecasters
are tracking hurricanes, they note the
absolute location on a periodic basis to
see the path of the storm and try to
predict the future path based partially
on these findings.
APPLICATIONS IN REAL LIFE
A latitude measurement indicates locations at a given
angle north or south of Earth’s equator. So, latitude
measurements range from 90° North at the North Pole
to 0° at the equator to 90° South at the South Pole.
A longitude measurement indicates locations at a
given angle east or west of an imaginary north-south
line called the prime meridian, which runs through
Greenwich, England. Longitude measurements begin
at 0° at the prime meridian and extend 180° both to
the west and to the east.
Mr. HIMANSHU DIWAKAR JETGI 10
11. Now imagine what if coordinate system doesn’t exist. Pilots, aircraft
controller, passengers in the flight, persons waiting for the flight all will not
be able to get the location or position of aircraft. These will also definitely
increase the chances of aircraft crushes. So from here we can easily say that
coordinate system is one of the most important parts of air transport.
WHAT WILL HAPPEN IF IT DOES NOT EXISTS?
Mr. HIMANSHU DIWAKAR JETGI 11
13. An overview
Cylindrical coordinate
surfaces. The three
orthogonal
components, ρ(green), φ(red),
and z (blue), each increasing
at a constant rate. The point is
at the intersection between
the three colored surfaces.
Mr. HIMANSHU DIWAKAR JETGI 13
14. Circular Cylindrical Co-ordinate (𝜌, ∅, 𝑧)
Cylindrical coordinates are a simple
extension of the two-dimensional polar
coordinates to three dimensions.
Mr. HIMANSHU DIWAKAR JETGI 14
15. Definition
The three coordinates (ρ, φ, z) of a point P are defined as:
• The radial distance ρ is the Euclidean distance from the z-axis to the
point P.
• The azimuth φ is the angle between the reference direction on the
chosen plane and the line from the origin to the projection of P on
the plane.
• The height z is the signed distance from the chosen plane to the
point P
Mr. HIMANSHU DIWAKAR JETGI 15
16. Point P and unit vectors
in the cylindrical
coordinate system.
𝜑 is azimuthal angle
0 < 𝜌 < ∞
0 < 𝜃 < 2𝜋
−∞ < 𝑧 < ∞
Mr. HIMANSHU DIWAKAR JETGI 16
17. • A vector A in cylindrical coordinates can be written as
𝐴 𝜌, 𝐴∅, 𝐴 𝑍
𝐴 = 𝐴 𝜌 𝑎 𝜌 + 𝐴∅ 𝑎∅ + 𝐴 𝑧 𝑎 𝑧
𝐴 = 𝐴 𝜌
2
+ 𝐴 𝜌
2
+ 𝐴 𝜌
2
Mr. HIMANSHU DIWAKAR JETGI 17
18. Cartesian to spherical & vice versa
• The relationships between the variables
(x, y, z) of the Cartesian coordinate
system and those of the cylindrical
system (p, ∅, z) are easily obtained from
Figure.
𝑥 = 𝜌 cos ∅
𝑦 = 𝜌 sin ∅
𝑧 = 𝑧
• And by solving above eq’ns
𝜌 = 𝑥2 + 𝑦2
∅ = tan−1
𝑦
𝑥
𝑧 = 𝑧
Mr. HIMANSHU DIWAKAR JETGI 18
19. Cont’d
• The relationships between (ax, ay, az)
and (𝑎 𝜌 , 𝑎∅ , 𝑎 𝑧) are obtained
geometrically from Figure.
Mr. HIMANSHU DIWAKAR JETGI 19
22. Introduction to Spherical Co-ordinate System
• Spherical coordinates are a system of curvilinear coordinates that
are natural for describing positions on a sphere or spheroid.
The coordinate ρ is the distance from P to the
origin.
θ is the angle between the positive x-axis and the
line segment from the origin to Q.
ϕ is the angle between the positive z-axis and the
line segment from the origin to P.
Mr. HIMANSHU DIWAKAR JETGI 22
23. Location of a Point
• The spherical coordinate system extends polar coordinates into 3D
by using an angle ϕ for the third coordinate. This gives
coordinates (r,θ,ϕ) consisting of
Co-ordinate Name Range Definition
r radius 0≤r<∞ distance from the origin
θ azimuth −π<θ≤π
angle from the x-axis in the x–
y plane
ϕ elevation −π/2<ϕ≤π/2 angle up from the x–y plane
The location of any point in spherical is (r,θ,ϕ)
Mr. HIMANSHU DIWAKAR JETGI 23
24. Relationship b/w Spherical and Cartesian coordinate
System
x = ρ sinϕ cosθ
y = ρ sin ϕsinθ
z = ρ cosϕ.
Mr. HIMANSHU DIWAKAR JETGI 24
25. Cont’d
• The space variables (x, y, z) in
Cartesian coordinates can be related
to variables
• (𝑟, 𝜃, ∅) of a spherical coordinate
system. From Figure
𝑟 = 𝑥2 + 𝑦2 + 𝑧2
𝜃 = tan−1
𝑥2 + 𝑦2
𝑧
∅ = tan−1
𝑦
𝑥
Mr. HIMANSHU DIWAKAR JETGI 25
26. The unit vectors ax, ay, az and ar, 𝑎 𝜃, 𝑎∅ are
related as follows
Mr. HIMANSHU DIWAKAR JETGI 26
27. SPHEROIDS AND SPHERES
• The shape and size of a geographic coordinate system’s surface is
defined by a sphere or spheroid
The assumption
that the earth is a sphere is
possible for small-scale
maps (smaller than
1:5,000,000)
To maintain accuracy
for larger-scale maps (scales
of 1:1,000,000 or larger),
a spheroid is necessary to
represent the shape of the
Earth
A sphere is based on a circle, while a spheroid
(or ellipsoid) is based on an ellipse
Mr. HIMANSHU DIWAKAR JETGI 27
28. Latitude & Longitude
• A Geographic Coordinate System (GCS) uses a 3D spherical surface to define
locations on the Earth
• GCS uses the azimuth and elevation of the spherical coordinate system
• A point is referenced by its longitude and latitude values
• Longitude and latitude are angles measured from the earth’s center to a point
on the Earth’s surface.
Mr. HIMANSHU DIWAKAR JETGI 28
29. Latitude
• Horizontal line
• It is the angular distance, in degrees, minutes, and seconds of a
point north or south of the Equator.
• Often referred to as parallels.
• The coordinate ϕ corresponds to latitude
• On the Earth, latitude is measured as angular distance from the
equator.
• In spherical coordinates, latitude is measured as the angular
distance from the North Pole
Mr. HIMANSHU DIWAKAR JETGI 29
30. At the North Pole,
Φ=o
At the equator,
Φ=
At the South Pole,
Φ=
𝜋 2
𝜋
Latitude
Mr. HIMANSHU DIWAKAR JETGI 30
31. Longitude
• Vertical line
• It is the angular distance in degrees, minutes and seconds of a point,
East or West of the Prime (Greenwich) Meridian
• Often referred to as Meridians
• Each longitude line measures 12,429.9 miles
• The coordinate θ corresponds to longitude
• θ is a measurement of angular distance from the horizontal axis.
Mr. HIMANSHU DIWAKAR JETGI 31
32. Longitude
At the North pole
Θ=
At the equator
Θ=0 or 𝜋
At the south pole
Θ= -
𝜋 2
𝜋 2
Mr. HIMANSHU DIWAKAR JETGI 32
33. Latitude & Longitude
Distance between Lines
If we divide the circumference of the earth (approximately 25,000 miles) by 360
degrees, the distance on the earth's surface for each one degree of latitude
orlongitude is just over 69 miles, or 111 km.
Mr. HIMANSHU DIWAKAR JETGI 33
34. GPS (Global Positioning System)
• Space-based satellite navigation system
• Developed in 1973 to overcome the limitations of previous navigation systems
• Provides location and time information in all weather conditions, anywhere on
or near the Earth
Mr. HIMANSHU DIWAKAR JETGI 34
35. GPS
• Any desired location can be found by entering its coordinates in our GPS
device.
• We only need to know the latitude and longitude of that location to know
exactly where it is.
• Today GPS is a network on 30 satellites
Mr. HIMANSHU DIWAKAR JETGI 35