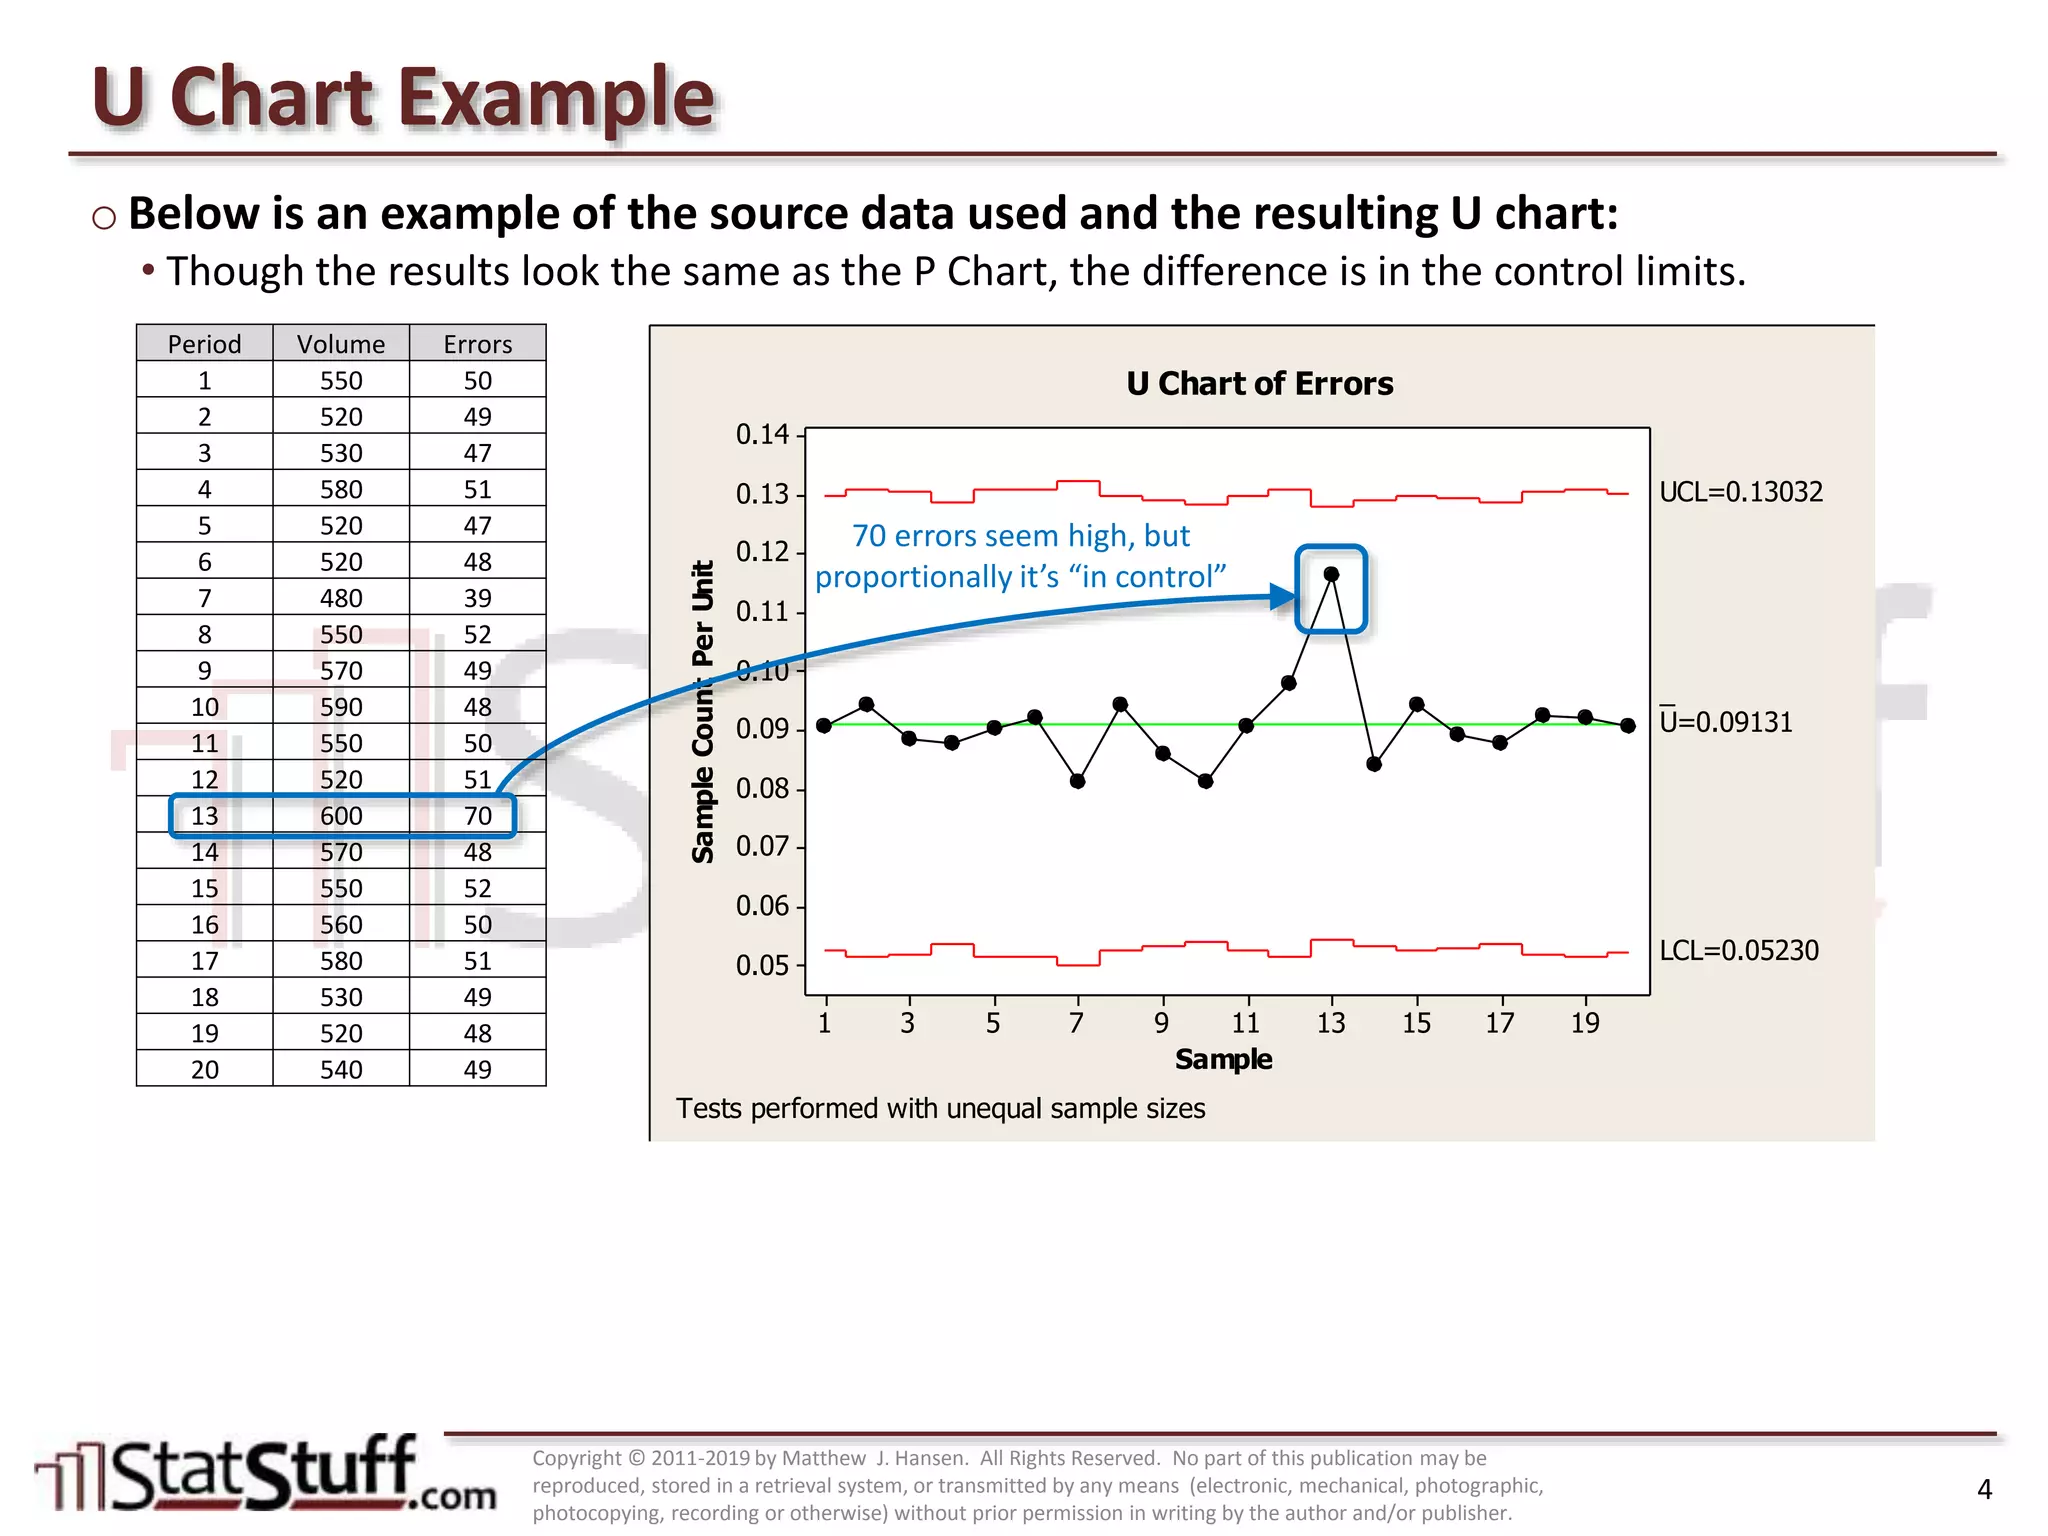
This document provides an overview of the U control chart, which is used to measure the proportion of defectives per unit in a sample. It assumes data is discrete but the units vary in each group. An example shows how to set up and interpret a U chart in Minitab using defect rate data grouped by period. Practitioners are asked to identify two discrete metrics from their organization, run U charts on historical data, and analyze whether any points fail tests indicating special causes of variation.


![Control Charts[1]](https://cdn.slidesharecdn.com/ss_thumbnails/controlcharts1-1226961283054520-8-thumbnail.jpg?width=640&height=640&fit=bounds)
![Control Charts[1]](https://cdn.slidesharecdn.com/ss_thumbnails/controlcharts1-1226081330857138-9-thumbnail.jpg?width=640&height=640&fit=bounds)


![Control charts[1]](https://cdn.slidesharecdn.com/ss_thumbnails/controlcharts1-100924110931-phpapp01-thumbnail.jpg?width=640&height=640&fit=bounds)


