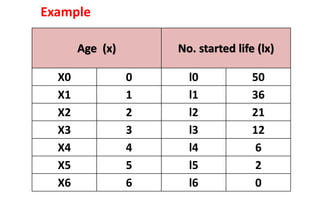
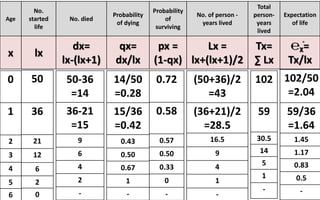
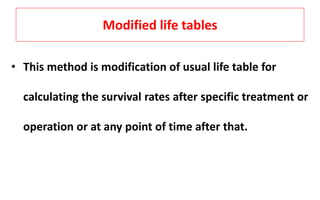
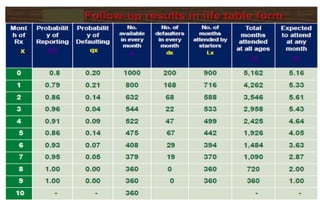
SlideShare a Scribd company logo
Seminar
CONSTRUCTION
OF
LIFE TABLE
By:- Dr Pratap Shinde,
Guide:- Dr Atul Wadagale sir (Asst. professor)
Department of Community medicine,
Govt. Medical college Latur.
Content
• Background
• Construction of a Life table
• Types of Life table
• Modified life table
• Applications of Life table
• Summary
• The concept of life table was first given by John Graunt
in London in 1662 in a book entitled Natural and
Political Observations Made upon the Bills of Mortality.
• At about the same time, Caspar Neumann, living in
Breslau, was collecting data about the number of birth,
deaths and other vital statistics in his city.
Background
• Just after death of Caspar Neumann, Halley got hold
of the data, analyzed them and in 1693 published
his conclusions in the Philosophical Transactions of
the Royal Society.
• Edmond Halley -The first person to show how to
construct the life table.
• Halley was a British astronomer, mathematician,
meteorologist who is best known for computing the
orbit of Halley’s comet.
• Life table tells us how long people live on an average.
• It converts a cross sectional information into a
longitudinal cohort information.
Halley’s life table of Breslau city
In short
• Life table methodology constructs a life experience
for a fictional cohort subjected to current mortality
rates as it progresses through life, as if the current
rates do not change.
Assumptions of Life Table
• A hypothetical cohort of life table usually comprises of
1,000 or 10,000 or 1,00,000 births.
• Deaths equally distributed throughout the year.
• Cohort of people diminish gradually by death only.
• Cohort is closed to the in-migration and out-migration.
• Death rate is related to a pre-determined age specific
death rate.
• No change in death rates overtime.
• Life tables are generally constructed separately for males
and females.
Construction of a life table
• To construct a life table, two things are required:
I. Population living at all individual ages in a
selected year.
II. Number of deaths that occurred in these ages
during the selected year.
Procedures
• Age (x) and Number started life (lx)
• Determine the number of deaths (dx)in each age category.
• Determine probability of dying (qx) and probability of
surviving (px) at each age.
• Calculate No. of person -years lived (Lx) at each age.
• Construct a column called (Tx), the sum of all the (Lx) up
to that age category.
• Calculate expectation of future life for each age category-
ex = Tx / lx
• ex is expressed in the number additional life expected.
Age (x) No. started life (lx)
X0 0 l0 50
X1 1 l1 36
X2 2 l2 21
X3 3 l3 12
X4 4 l4 6
X5 5 l5 2
X6 6 l6 0
Example
Age
No.
started
life
No. died
Probability
of dying
Probability
of
surviving
No. of person -
years lived
Total
person-
years
lived
Expectation
of life
x lx
dx=
lx-(lx+1)
qx=
dx/lx
px =
(1-qx)
Lx =
lx+(lx+1)/2
Tx=
∑ Lx
℮ᵪ֯=
Tx/lx
0
1
2
3
4
5
6
50
36
21
12
6
2
0
50-36
=14
36-21
=15
9
6
4
2
-
14/50
=0.28
15/36
=0.42
0.43
0.50
0.67
1
-
0.72
0.58
0.57
0.50
0.33
0
-
(50+36)/2
=43
(36+21)/2
=28.5
16.5
9
4
1
-
102
59
30.5
14
5
1
-
102/50
=2.04
59/36
=1.64
1.45
1.17
0.83
0.5
-
Modified life tables
• This method is modification of usual life table for
calculating the survival rates after specific treatment or
operation or at any point of time after that.
Example
• A total of 23 patients of tuberculosis started
treatment in a T.B. clinic. Their number becomes
less due to defaulters. Out of 23 who started
treatment in January, only 22 reported in
February,13 in March & so on till there were only 9
left in the month of November.
1
Types of Life table
• 1. Current v/s Cohort.
• 2. Complete v/s Abridged.
• 3. Single decremental v/s Multiple decremental tables.
• 4. Incremental –Decremental life table (Multi state life
table)
• The cohort life table (Generation) presents the
mortality experience of a particular birth cohort.
• All persons born in a year, from the moment of birth
through consecutive ages in successive calendar years.
• The cohort life table reflects the mortality experience
of an actual cohort from birth.
• Current (period life table)
• Based on the mortality experience of the community
for a short period of time such as one year/two year…
• A complete life table contains data for every year of
age. Here information is given for every year of age
from birth to the last age
• An abridged life table typically contains data by 5-or 10-
year age intervals .
• A separate group is made for age group 0-1 years .
• In India a 5 year interval is selected. Here information is
given for age intervals such as x to x+5 years.
Single Decremental v/s Multiple Decremental
Multi state life table
Applications of Life table
• To find the number of survivors out of 1,000 or
10,000 at any age say,
a. At the age of 5, to find number of children likely to
enter primary school.
b. At the age of 15, to find number of women
entering fertile period.
c. At age of 18, to find number of persons become
eligible for voting.
• To estimate the number likely to die after joining
service till retirement, helping in budgeting for
payment towards risk or pension.
• To find expectation of life or longevity of life at birth or
any other age.
• To compare mortality of two places, periods,
professions or groups.
• Helps to project population estimates by age & sex.
• To estimate the cause of specific death rates, male and
female death rates, etc
• By constructing a life table based on the age at marriage,
marriage patterns and changes in them can be estimated.
• Used for formulating family planning programmes relating
to infant mortality, maternal deaths, health programmes,
etc.
• To find survival rate after treatment in chronic disease
like tuberculosis, cancer or after cardiac surgery by
modified life table.
• Calculate failure rate of contraceptive.
• life table methods used to study birth control
effectiveness, (alternative to the Pearl Index)
• A decrement table calculates a separate effectiveness rate
for each month of the study, as well as for a standard
period of time (usually 12 months).
• Use of life table methods eliminates time-related biases
(i.e. the most fertile couples getting pregnant and
dropping out of the study early, and couples becoming
more skilled at using the method as time goes on), and in
this way is superior to the Pearl Index.
• Life table shows the probability of a person at a certain
age dying before their next birthday.
• Mathematically and statistically based actuarial life
tables assist insurance companies by showing event
probabilities, such as death, sickness, and disability.
• An actuarial life table can also include factors to
differentiate variable risks such as smoking, occupation,
socio-economic status, etc
Kaplan Meier Method
• Similar to life table analysis except time since entry in
the study is not divided into intervals for analysis.
• Survival is estimated each time a patient has an event
• It gives exact survival times in comparison to life table
because it does not group survival time into intervals.
Assumptions
• Assume that at any time patients who are censored
have the same survival prospects as those who
continue to be followed.
• Assume that the survival probabilities are same for
subjects recruited early and late in the study.
• Assume that the event happens at the time specified
Subjects are said to be censored
• If they are lost to follow up/Drop out of the study,
• If the study ends before they die or have an outcome of
interest.
• They are counted as alive or disease-free for the time
they were enrolled in the study.
• In simple words, some important information required
to make a calculation is not available to us. i.e.
censored.
Example
Limitations of Life Table
• Hypothetical measure, has potential to be misunderstood
by general public/media.
• It does not say about quality of life; for example, how
many years are lived with disability before dying.
• It’s based on assumption that the cohort is closed for
migration in or out. Hence the change in the cohort is only
due to death.
Summary
• The Life table methodology was first adopted some 300
years back. Credit to Edmond Halley who used this
statistical tool.
• Life table is an old method but is still being used to
calculate some vital parameters.
• Types of Life table
• Modified life table
• Applications of Life table
• Limitations of Life Table
References
• Mahajan’s methods in Biostatics: Jaypee publishers (p) Ltd. 9th edition, 2018.
• Principles and practice of Biostatics, 7th edition, Banarasidas Bhanot
publishers, 2017.
• Text book of public health and community medicine : 1st edition, RajVir
bhalwar, published by Department of community medicine AFMC Pune,
Maharashtra.
• Community medicine with recent advances: AH Suryakantha; Jaypee
publishers (p) Ltd. 4th edition
• Modified life table system: principles, empirical validation, and application,
Paper No. 39; Evidence and information for policy: World health
organization
• Epidemiology, Leon Gordis, 3rd edition, Elsevier publisher, USA; 2014.
Construction of life table

More Related Content

What's hot

Demography and fertility related statistics 2
Demography and fertility related statistics 2Demography and fertility related statistics 2
Demography and fertility related statistics 2
AbhishekDas15
 
Session 9 migration techniques
Session 9  migration techniquesSession 9  migration techniques
Session 9 migration techniques
Papiya Mazumdar
 
1.6 standardization
1.6 standardization1.6 standardization
1.6 standardization
A M
 
Harris-Todaro Migration Model and it's Applicability in Bangladesh
Harris-Todaro Migration Model and it's Applicability in BangladeshHarris-Todaro Migration Model and it's Applicability in Bangladesh
Harris-Todaro Migration Model and it's Applicability in Bangladesh
Mohaiminul Islam
 

What's hot (20)

Survival analysis
Survival analysisSurvival analysis
Survival analysis
 
Measures of mortality
Measures of mortalityMeasures of mortality
Measures of mortality
 
Standerdization
StanderdizationStanderdization
Standerdization
 
Survival analysis
Survival analysis  Survival analysis
Survival analysis
 
Demography and fertility related statistics 2
Demography and fertility related statistics 2Demography and fertility related statistics 2
Demography and fertility related statistics 2
 
Mortality measurement
Mortality measurementMortality measurement
Mortality measurement
 
Session 9 migration techniques
Session 9  migration techniquesSession 9  migration techniques
Session 9 migration techniques
 
SURVIVAL ANALYSIS.ppt
SURVIVAL ANALYSIS.pptSURVIVAL ANALYSIS.ppt
SURVIVAL ANALYSIS.ppt
 
Presentation by amin
Presentation by aminPresentation by amin
Presentation by amin
 
Measures of fertility
Measures of fertility Measures of fertility
Measures of fertility
 
Population Studies / Demography Introduction
Population Studies / Demography IntroductionPopulation Studies / Demography Introduction
Population Studies / Demography Introduction
 
Standardization of rates
Standardization of ratesStandardization of rates
Standardization of rates
 
Standardization of rates by Dr. Basil Tumaini
Standardization of rates by Dr. Basil TumainiStandardization of rates by Dr. Basil Tumaini
Standardization of rates by Dr. Basil Tumaini
 
Mortality rates & standardization
Mortality rates &  standardizationMortality rates &  standardization
Mortality rates & standardization
 
Survival analysis
Survival analysisSurvival analysis
Survival analysis
 
POPULATION PROJECTION
POPULATION PROJECTION POPULATION PROJECTION
POPULATION PROJECTION
 
Survival analysis
Survival  analysisSurvival  analysis
Survival analysis
 
Direct standardisation ppt
Direct standardisation pptDirect standardisation ppt
Direct standardisation ppt
 
1.6 standardization
1.6 standardization1.6 standardization
1.6 standardization
 
Harris-Todaro Migration Model and it's Applicability in Bangladesh
Harris-Todaro Migration Model and it's Applicability in BangladeshHarris-Todaro Migration Model and it's Applicability in Bangladesh
Harris-Todaro Migration Model and it's Applicability in Bangladesh
 

Similar to Construction of life table

Statistics.pdf.pdf for Research Physiotherapy and Occupational Therapy
Statistics.pdf.pdf for Research Physiotherapy and Occupational TherapyStatistics.pdf.pdf for Research Physiotherapy and Occupational Therapy
Statistics.pdf.pdf for Research Physiotherapy and Occupational Therapy
SakhileKhoza2
 
Study Designs Cohort StudiesChapter 7Learning.docx
Study Designs Cohort StudiesChapter 7Learning.docxStudy Designs Cohort StudiesChapter 7Learning.docx
Study Designs Cohort StudiesChapter 7Learning.docx
deanmtaylor1545
 
5.3 history
5.3 history5.3 history
5.3 history
A M
 

Similar to Construction of life table (20)

Application of life tables in insect pest management
Application of life tables in insect pest managementApplication of life tables in insect pest management
Application of life tables in insect pest management
 
id biostatics.pptx
id biostatics.pptxid biostatics.pptx
id biostatics.pptx
 
Statistics.pdf.pdf for Research Physiotherapy and Occupational Therapy
Statistics.pdf.pdf for Research Physiotherapy and Occupational TherapyStatistics.pdf.pdf for Research Physiotherapy and Occupational Therapy
Statistics.pdf.pdf for Research Physiotherapy and Occupational Therapy
 
Study Designs Cohort StudiesChapter 7Learning.docx
Study Designs Cohort StudiesChapter 7Learning.docxStudy Designs Cohort StudiesChapter 7Learning.docx
Study Designs Cohort StudiesChapter 7Learning.docx
 
Occurrence of disease morbidity
Occurrence of disease morbidityOccurrence of disease morbidity
Occurrence of disease morbidity
 
Introduction to biostatistic
Introduction to biostatisticIntroduction to biostatistic
Introduction to biostatistic
 
Descriptive Epidemiology.pptx
Descriptive Epidemiology.pptxDescriptive Epidemiology.pptx
Descriptive Epidemiology.pptx
 
Demography
DemographyDemography
Demography
 
Demographic models
Demographic modelsDemographic models
Demographic models
 
Public health nutrition- national disorders
Public health nutrition- national disordersPublic health nutrition- national disorders
Public health nutrition- national disorders
 
epidemiological measures.pptx
epidemiological measures.pptxepidemiological measures.pptx
epidemiological measures.pptx
 
UNIT 6-DEMOGRAPHY.pptx for 2nd B.Sc nursing
UNIT 6-DEMOGRAPHY.pptx for 2nd B.Sc nursingUNIT 6-DEMOGRAPHY.pptx for 2nd B.Sc nursing
UNIT 6-DEMOGRAPHY.pptx for 2nd B.Sc nursing
 
Community and Public Health (Week 2&3)
Community and Public Health (Week 2&3)Community and Public Health (Week 2&3)
Community and Public Health (Week 2&3)
 
Contemporary Approaches to Survival Data Analysis by Dr. Idokoko A. B.
Contemporary Approaches to Survival Data Analysis by Dr. Idokoko A. B.Contemporary Approaches to Survival Data Analysis by Dr. Idokoko A. B.
Contemporary Approaches to Survival Data Analysis by Dr. Idokoko A. B.
 
DEMOGRAPHY
DEMOGRAPHYDEMOGRAPHY
DEMOGRAPHY
 
UNIT-IV introduction about ANP course for M.sc I year.pptx
UNIT-IV introduction about ANP course for M.sc I year.pptxUNIT-IV introduction about ANP course for M.sc I year.pptx
UNIT-IV introduction about ANP course for M.sc I year.pptx
 
Life Tables & Kaplan-Meier Method.pptx
 Life Tables & Kaplan-Meier Method.pptx Life Tables & Kaplan-Meier Method.pptx
Life Tables & Kaplan-Meier Method.pptx
 
5.3 history
5.3 history5.3 history
5.3 history
 
Introduction to basics of bio statistics.
Introduction to basics of bio statistics.Introduction to basics of bio statistics.
Introduction to basics of bio statistics.
 
Survival analysis
Survival analysisSurvival analysis
Survival analysis
 

Recently uploaded

New Directions in Targeted Therapeutic Approaches for Older Adults With Mantl...
New Directions in Targeted Therapeutic Approaches for Older Adults With Mantl...New Directions in Targeted Therapeutic Approaches for Older Adults With Mantl...
New Directions in Targeted Therapeutic Approaches for Older Adults With Mantl...
i3 Health
 
Alcohol_Dr. Jeenal Mistry MD Pharmacology.pdf
Alcohol_Dr. Jeenal Mistry MD Pharmacology.pdfAlcohol_Dr. Jeenal Mistry MD Pharmacology.pdf
Alcohol_Dr. Jeenal Mistry MD Pharmacology.pdf
Dr Jeenal Mistry
 
Lung Cancer: Artificial Intelligence, Synergetics, Complex System Analysis, S...
Lung Cancer: Artificial Intelligence, Synergetics, Complex System Analysis, S...Lung Cancer: Artificial Intelligence, Synergetics, Complex System Analysis, S...
Lung Cancer: Artificial Intelligence, Synergetics, Complex System Analysis, S...
Oleg Kshivets
 

Recently uploaded (20)

Relationship between vascular system disfunction, neurofluid flow and Alzheim...
Relationship between vascular system disfunction, neurofluid flow and Alzheim...Relationship between vascular system disfunction, neurofluid flow and Alzheim...
Relationship between vascular system disfunction, neurofluid flow and Alzheim...
 
TEST BANK For Wong’s Essentials of Pediatric Nursing, 11th Edition by Marilyn...
TEST BANK For Wong’s Essentials of Pediatric Nursing, 11th Edition by Marilyn...TEST BANK For Wong’s Essentials of Pediatric Nursing, 11th Edition by Marilyn...
TEST BANK For Wong’s Essentials of Pediatric Nursing, 11th Edition by Marilyn...
 
US E-cigarette Summit: Taming the nicotine industrial complex
US E-cigarette Summit: Taming the nicotine industrial complexUS E-cigarette Summit: Taming the nicotine industrial complex
US E-cigarette Summit: Taming the nicotine industrial complex
 
Report Back from SGO 2024: What’s the Latest in Cervical Cancer?
Report Back from SGO 2024: What’s the Latest in Cervical Cancer?Report Back from SGO 2024: What’s the Latest in Cervical Cancer?
Report Back from SGO 2024: What’s the Latest in Cervical Cancer?
 
DECIPHERING COMMON ECG FINDINGS IN ED.pptx
DECIPHERING COMMON ECG FINDINGS IN ED.pptxDECIPHERING COMMON ECG FINDINGS IN ED.pptx
DECIPHERING COMMON ECG FINDINGS IN ED.pptx
 
New Directions in Targeted Therapeutic Approaches for Older Adults With Mantl...
New Directions in Targeted Therapeutic Approaches for Older Adults With Mantl...New Directions in Targeted Therapeutic Approaches for Older Adults With Mantl...
New Directions in Targeted Therapeutic Approaches for Older Adults With Mantl...
 
Scientificity and feasibility study of non-invasive central arterial pressure...
Scientificity and feasibility study of non-invasive central arterial pressure...Scientificity and feasibility study of non-invasive central arterial pressure...
Scientificity and feasibility study of non-invasive central arterial pressure...
 
Alcohol_Dr. Jeenal Mistry MD Pharmacology.pdf
Alcohol_Dr. Jeenal Mistry MD Pharmacology.pdfAlcohol_Dr. Jeenal Mistry MD Pharmacology.pdf
Alcohol_Dr. Jeenal Mistry MD Pharmacology.pdf
 
1130525--家醫計畫2.0糖尿病照護研討會-社團法人高雄市醫師公會.pdf
1130525--家醫計畫2.0糖尿病照護研討會-社團法人高雄市醫師公會.pdf1130525--家醫計畫2.0糖尿病照護研討會-社團法人高雄市醫師公會.pdf
1130525--家醫計畫2.0糖尿病照護研討會-社團法人高雄市醫師公會.pdf
 
Temporal, Infratemporal & Pterygopalatine BY Dr.RIG.pptx
Temporal, Infratemporal & Pterygopalatine BY Dr.RIG.pptxTemporal, Infratemporal & Pterygopalatine BY Dr.RIG.pptx
Temporal, Infratemporal & Pterygopalatine BY Dr.RIG.pptx
 
Anuman- An inference for helpful in diagnosis and treatment
Anuman- An inference for helpful in diagnosis and treatmentAnuman- An inference for helpful in diagnosis and treatment
Anuman- An inference for helpful in diagnosis and treatment
 
For Better Surat #ℂall #Girl Service ❤85270-49040❤ Surat #ℂall #Girls
For Better Surat #ℂall #Girl Service ❤85270-49040❤ Surat #ℂall #GirlsFor Better Surat #ℂall #Girl Service ❤85270-49040❤ Surat #ℂall #Girls
For Better Surat #ℂall #Girl Service ❤85270-49040❤ Surat #ℂall #Girls
 
Lung Cancer: Artificial Intelligence, Synergetics, Complex System Analysis, S...
Lung Cancer: Artificial Intelligence, Synergetics, Complex System Analysis, S...Lung Cancer: Artificial Intelligence, Synergetics, Complex System Analysis, S...
Lung Cancer: Artificial Intelligence, Synergetics, Complex System Analysis, S...
 
Prix Galien International 2024 Forum Program
Prix Galien International 2024 Forum ProgramPrix Galien International 2024 Forum Program
Prix Galien International 2024 Forum Program
 
Arterial health throughout cancer treatment and exercise rehabilitation in wo...
Arterial health throughout cancer treatment and exercise rehabilitation in wo...Arterial health throughout cancer treatment and exercise rehabilitation in wo...
Arterial health throughout cancer treatment and exercise rehabilitation in wo...
 
CURRENT HEALTH PROBLEMS AND ITS SOLUTION BY AYURVEDA.pptx
CURRENT HEALTH PROBLEMS AND ITS SOLUTION BY AYURVEDA.pptxCURRENT HEALTH PROBLEMS AND ITS SOLUTION BY AYURVEDA.pptx
CURRENT HEALTH PROBLEMS AND ITS SOLUTION BY AYURVEDA.pptx
 
Fundamental of Radiobiology -SABBU.pptx
Fundamental of Radiobiology  -SABBU.pptxFundamental of Radiobiology  -SABBU.pptx
Fundamental of Radiobiology -SABBU.pptx
 
Couples presenting to the infertility clinic- Do they really have infertility...
Couples presenting to the infertility clinic- Do they really have infertility...Couples presenting to the infertility clinic- Do they really have infertility...
Couples presenting to the infertility clinic- Do they really have infertility...
 
PT MANAGEMENT OF URINARY INCONTINENCE.pptx
PT MANAGEMENT OF URINARY INCONTINENCE.pptxPT MANAGEMENT OF URINARY INCONTINENCE.pptx
PT MANAGEMENT OF URINARY INCONTINENCE.pptx
 
Why invest into infodemic management in health emergencies
Why invest into infodemic management in health emergenciesWhy invest into infodemic management in health emergencies
Why invest into infodemic management in health emergencies
 

Construction of life table

  • 1. Seminar CONSTRUCTION OF LIFE TABLE By:- Dr Pratap Shinde, Guide:- Dr Atul Wadagale sir (Asst. professor) Department of Community medicine, Govt. Medical college Latur.
  • 2. Content • Background • Construction of a Life table • Types of Life table • Modified life table • Applications of Life table • Summary
  • 3. • The concept of life table was first given by John Graunt in London in 1662 in a book entitled Natural and Political Observations Made upon the Bills of Mortality. • At about the same time, Caspar Neumann, living in Breslau, was collecting data about the number of birth, deaths and other vital statistics in his city. Background
  • 4. • Just after death of Caspar Neumann, Halley got hold of the data, analyzed them and in 1693 published his conclusions in the Philosophical Transactions of the Royal Society. • Edmond Halley -The first person to show how to construct the life table. • Halley was a British astronomer, mathematician, meteorologist who is best known for computing the orbit of Halley’s comet.
  • 5. • Life table tells us how long people live on an average. • It converts a cross sectional information into a longitudinal cohort information.
  • 6. Halley’s life table of Breslau city
  • 7.
  • 8.
  • 9. In short • Life table methodology constructs a life experience for a fictional cohort subjected to current mortality rates as it progresses through life, as if the current rates do not change.
  • 10. Assumptions of Life Table • A hypothetical cohort of life table usually comprises of 1,000 or 10,000 or 1,00,000 births. • Deaths equally distributed throughout the year. • Cohort of people diminish gradually by death only. • Cohort is closed to the in-migration and out-migration. • Death rate is related to a pre-determined age specific death rate. • No change in death rates overtime. • Life tables are generally constructed separately for males and females.
  • 11. Construction of a life table • To construct a life table, two things are required: I. Population living at all individual ages in a selected year. II. Number of deaths that occurred in these ages during the selected year.
  • 12. Procedures • Age (x) and Number started life (lx) • Determine the number of deaths (dx)in each age category. • Determine probability of dying (qx) and probability of surviving (px) at each age. • Calculate No. of person -years lived (Lx) at each age. • Construct a column called (Tx), the sum of all the (Lx) up to that age category. • Calculate expectation of future life for each age category- ex = Tx / lx • ex is expressed in the number additional life expected.
  • 13. Age (x) No. started life (lx) X0 0 l0 50 X1 1 l1 36 X2 2 l2 21 X3 3 l3 12 X4 4 l4 6 X5 5 l5 2 X6 6 l6 0 Example
  • 14. Age No. started life No. died Probability of dying Probability of surviving No. of person - years lived Total person- years lived Expectation of life x lx dx= lx-(lx+1) qx= dx/lx px = (1-qx) Lx = lx+(lx+1)/2 Tx= ∑ Lx ℮ᵪ֯= Tx/lx 0 1 2 3 4 5 6 50 36 21 12 6 2 0 50-36 =14 36-21 =15 9 6 4 2 - 14/50 =0.28 15/36 =0.42 0.43 0.50 0.67 1 - 0.72 0.58 0.57 0.50 0.33 0 - (50+36)/2 =43 (36+21)/2 =28.5 16.5 9 4 1 - 102 59 30.5 14 5 1 - 102/50 =2.04 59/36 =1.64 1.45 1.17 0.83 0.5 -
  • 15. Modified life tables • This method is modification of usual life table for calculating the survival rates after specific treatment or operation or at any point of time after that.
  • 16. Example • A total of 23 patients of tuberculosis started treatment in a T.B. clinic. Their number becomes less due to defaulters. Out of 23 who started treatment in January, only 22 reported in February,13 in March & so on till there were only 9 left in the month of November.
  • 17.
  • 18.
  • 19. 1
  • 20. Types of Life table • 1. Current v/s Cohort. • 2. Complete v/s Abridged. • 3. Single decremental v/s Multiple decremental tables. • 4. Incremental –Decremental life table (Multi state life table)
  • 21. • The cohort life table (Generation) presents the mortality experience of a particular birth cohort. • All persons born in a year, from the moment of birth through consecutive ages in successive calendar years. • The cohort life table reflects the mortality experience of an actual cohort from birth.
  • 22. • Current (period life table) • Based on the mortality experience of the community for a short period of time such as one year/two year…
  • 23. • A complete life table contains data for every year of age. Here information is given for every year of age from birth to the last age • An abridged life table typically contains data by 5-or 10- year age intervals . • A separate group is made for age group 0-1 years . • In India a 5 year interval is selected. Here information is given for age intervals such as x to x+5 years.
  • 24. Single Decremental v/s Multiple Decremental
  • 26. Applications of Life table • To find the number of survivors out of 1,000 or 10,000 at any age say, a. At the age of 5, to find number of children likely to enter primary school. b. At the age of 15, to find number of women entering fertile period. c. At age of 18, to find number of persons become eligible for voting.
  • 27. • To estimate the number likely to die after joining service till retirement, helping in budgeting for payment towards risk or pension. • To find expectation of life or longevity of life at birth or any other age. • To compare mortality of two places, periods, professions or groups. • Helps to project population estimates by age & sex.
  • 28. • To estimate the cause of specific death rates, male and female death rates, etc • By constructing a life table based on the age at marriage, marriage patterns and changes in them can be estimated. • Used for formulating family planning programmes relating to infant mortality, maternal deaths, health programmes, etc.
  • 29. • To find survival rate after treatment in chronic disease like tuberculosis, cancer or after cardiac surgery by modified life table. • Calculate failure rate of contraceptive.
  • 30. • life table methods used to study birth control effectiveness, (alternative to the Pearl Index) • A decrement table calculates a separate effectiveness rate for each month of the study, as well as for a standard period of time (usually 12 months). • Use of life table methods eliminates time-related biases (i.e. the most fertile couples getting pregnant and dropping out of the study early, and couples becoming more skilled at using the method as time goes on), and in this way is superior to the Pearl Index.
  • 31. • Life table shows the probability of a person at a certain age dying before their next birthday. • Mathematically and statistically based actuarial life tables assist insurance companies by showing event probabilities, such as death, sickness, and disability. • An actuarial life table can also include factors to differentiate variable risks such as smoking, occupation, socio-economic status, etc
  • 32.
  • 33.
  • 34. Kaplan Meier Method • Similar to life table analysis except time since entry in the study is not divided into intervals for analysis. • Survival is estimated each time a patient has an event • It gives exact survival times in comparison to life table because it does not group survival time into intervals.
  • 35. Assumptions • Assume that at any time patients who are censored have the same survival prospects as those who continue to be followed. • Assume that the survival probabilities are same for subjects recruited early and late in the study. • Assume that the event happens at the time specified
  • 36. Subjects are said to be censored • If they are lost to follow up/Drop out of the study, • If the study ends before they die or have an outcome of interest. • They are counted as alive or disease-free for the time they were enrolled in the study. • In simple words, some important information required to make a calculation is not available to us. i.e. censored.
  • 37.
  • 39.
  • 40. Limitations of Life Table • Hypothetical measure, has potential to be misunderstood by general public/media. • It does not say about quality of life; for example, how many years are lived with disability before dying. • It’s based on assumption that the cohort is closed for migration in or out. Hence the change in the cohort is only due to death.
  • 41. Summary • The Life table methodology was first adopted some 300 years back. Credit to Edmond Halley who used this statistical tool. • Life table is an old method but is still being used to calculate some vital parameters. • Types of Life table • Modified life table • Applications of Life table • Limitations of Life Table
  • 42. References • Mahajan’s methods in Biostatics: Jaypee publishers (p) Ltd. 9th edition, 2018. • Principles and practice of Biostatics, 7th edition, Banarasidas Bhanot publishers, 2017. • Text book of public health and community medicine : 1st edition, RajVir bhalwar, published by Department of community medicine AFMC Pune, Maharashtra. • Community medicine with recent advances: AH Suryakantha; Jaypee publishers (p) Ltd. 4th edition • Modified life table system: principles, empirical validation, and application, Paper No. 39; Evidence and information for policy: World health organization • Epidemiology, Leon Gordis, 3rd edition, Elsevier publisher, USA; 2014.