10/05/2025 cyril.ocheri@unn.edu.ng EngrOcheri C
.
Introduction
A life table (also called a mortality table or actuarial table) is a
table which shows, for each age, what the probability is that a
person of that age will die before his or her next birthday
("probability of death").
In other words, it represents the survivorship of people from a
certain population.[
They can also be explained as a long-term
mathematical way to measure a population's longevity.
OR
Life table is a mathematical sample which gives a view of death
in a country and is the basis for measuring the average life
expectancy in a society.
It tells about the probability of a person dying at a certain age, or
living upto a definite age.
https://www.ssa.gov/oact/NOTES/as116/as116_I_II_III.html
3.
10/05/2025 cyril.ocheri@unn.edu.ng EngrOcheri C
.
What is a cohort
A cohort is a subset of a population consisting of all
individuals born in the same year.
Populations of species with longer lifespans have
more cohorts and more interactions among individuals of
different ages.
Populations consisting of multiple cohorts tend to be more
resistant to extinction than those consisting of only one or
very few cohorts.
http://www.bio.miami.edu/dana/330/330F19_13b.html
http://article.sapub.org/10.5923.j.ajcam.20130306.01.html
10/05/2025 cyril.ocheri@unn.edu.ng EngrOcheri C
.
Introduction
Life Table
Life table is a comprehensive method of describling
mortality , survivval and other vital event in population
It is composed of several sets of values showing how a
group infants who are under unchanging conditions
would gradually die
It provides concise measure of lonevity of that
population
Separate tables are prepared for females and males
after each decenniun census
It is also called as the Biometer of the population by
Willian Fair
6.
10/05/2025 cyril.ocheri@unn.edu.ng EngrOcheri C
.
History of Life table
John Graunt ( 1620-1670) - National and Potitical
observations made upon the Bills of Mortarity
( 1662)
Edmund Halley ( 1656 -1742)
An estimate of the Degree of the Mortality of
mankind drawn from the curious table of the Birth
and Funerals at the City of Breslaw
7.
10/05/2025 cyril.ocheri@unn.edu.ng EngrOcheri C
.
Why we use Life tables?
Life tables are used to describe age-specific mortality and survival
rates for a population. When this information is combined with
fecundity data, life-tables can be used to estimate rates of
population change.
A life table is a concise way of showing the probabilities of
a member of a particular population living to or dying at a particular
age. In this study, the life tables are used to examine the mortality
changes in the Social Security population over time.
According to Bogue, “The life table is a mathematical
model that portrays mortality condition at a particular time among a
population and provides a basis for measuring longevity. It is based
on age specific mortality rates observed for a population for a
particular year.”
https://www.sociologydiscussion.com/demography/population-growth/
life-table-meaning-types-and-importance/3030
8.
10/05/2025 cyril.ocheri@unn.edu.ng EngrOcheri C
.
Types of Life Tables
There are two types of life tables:
1. Period or static life tables show the current probability of
death (for people of different ages, in the current year)
OR
“Period Life Table summarizes the age specific mortality
conditions pertaining to a given or other short time period.”
2. Cohort life tables show the probability of death of people
from a given cohort (especially birth year) over the course of their
lifetime.
OR
The Cohort or Generation Life Table “summarizes the age
specific mortality experience of a given birth cohort (a group of
persons all born at the same time) for its life and thus extends over
many calendar years.”
9.
10/05/2025 cyril.ocheri@unn.edu.ng EngrOcheri C
.
Assumptions of Life Table:
A life table is based on the following assumptions:
1. A hypothetical cohort of life table usually comprises of 1,000 or
10,000 or 1,00,000 births.
2. The deaths are equally distributed throughout the year.
3. The cohort of people diminish gradually by death only.
4. The cohort is closed to the in-migration and out-migration.
5. The death rate is related to a pre-determined age specific death
rate.
6. The cohort of persons die at a fixed age which does not change.
7. There is no change in death rates overtime.
8. The cohort of life tables are generally constructed separately for
males and females.
10.
10/05/2025 cyril.ocheri@unn.edu.ng EngrOcheri C
.
Importance of Life Tables
1. Life table is used to project future population on the basis of
the present death rate.
2. It helps in determining the average expectation of life based on
age specific death rates.
3. The method of constructing a life table can be followed to
estimate the cause of specific death rates, male and female death
rates, etc.
4. The survival rates in a life table can be used to calculate the net
migration rate on the basis of age distribution at 5 or 10 year
interval.
5. Life tables can be used to compare population trends at national
and international levels.
6. By constructing a life table based on the age at marriage,
marriage patterns and changes in them can be estimated.
11.
10/05/2025 cyril.ocheri@unn.edu.ng EngrOcheri C
.
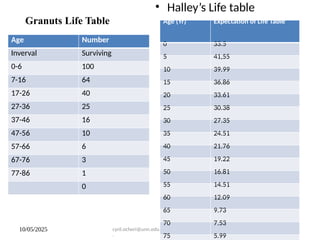
Granuts Life Table
Age Number
Inverval Surviving
0-6 100
7-16 64
17-26 40
27-36 25
37-46 16
47-56 10
57-66 6
67-76 3
77-86 1
0
• Halley’s Life table
Age (Yr) Expectation of Life Table
0 33.5
5 41,55
10 39.99
15 36.86
20 33.61
25 30.38
30 27.35
35 24.51
40 21.76
45 19.22
50 16.81
55 14.51
60 12.09
65 9.73
70 7.53
75 5.99
12.
10/05/2025 cyril.ocheri@unn.edu.ng EngrOcheri C
.
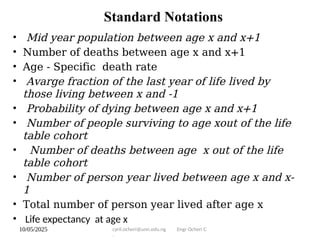
Standard Notations
• Mid year population between age x and x+1
• Number of deaths between age x and x+1
• Age - Specific death rate
• Avarge fraction of the last year of life lived by
those living between x and -1
• Probability of dying between age x and x+1
• Number of people surviving to age xout of the life
table cohort
• Number of deaths between age x out of the life
table cohort
• Number of person year lived between age x and x-
1
• Total number of person year lived after age x
• Life expectancy at age x
10/05/2025 cyril.ocheri@unn.edu.ng EngrOcheri C
.
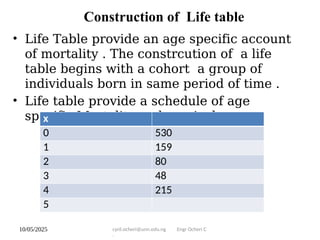
Construction of Life table
• Life Table provide an age specific account
of mortality . The constrcution of a life
table begins with a cohort a group of
individuals born in same period of time .
• Life table provide a schedule of age
specific Mortality and survival
x
0 530
1 159
2 80
3 48
4 215
5
10/05/2025 cyril.ocheri@unn.edu.ng EngrOcheri C
.
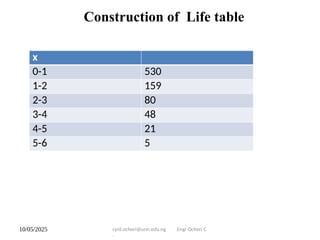
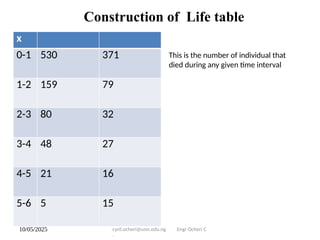
Construction of Life table
x
0-1 530 371
1-2 159 79
2-3 80 32
3-4 48 27
4-5 21 16
5-6 5 15
This is the number of individual that
died during any given time interval
17.
10/05/2025 cyril.ocheri@unn.edu.ng EngrOcheri C
.
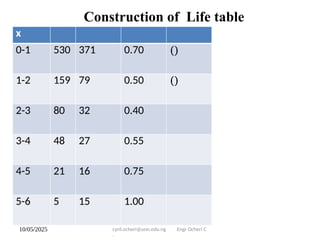
Construction of Life table
x
0-1 530 371 0.70 ()
1-2 159 79 0.50 ()
2-3 80 32 0.40
3-4 48 27 0.55
4-5 21 16 0.75
5-6 5 15 1.00
10/05/2025 cyril.ocheri@unn.edu.ng EngrOcheri C
.
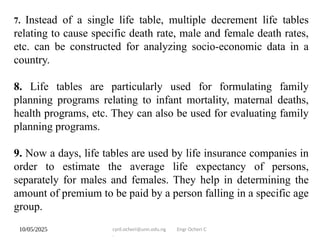
7. Instead of a single life table, multiple decrement life tables
relating to cause specific death rate, male and female death rates,
etc. can be constructed for analyzing socio-economic data in a
country.
8. Life tables are particularly used for formulating family
planning programs relating to infant mortality, maternal deaths,
health programs, etc. They can also be used for evaluating family
planning programs.
9. Now a days, life tables are used by life insurance companies in
order to estimate the average life expectancy of persons,
separately for males and females. They help in determining the
amount of premium to be paid by a person falling in a specific age
group.
22.
10/05/2025 cyril.ocheri@unn.edu.ng EngrOcheri C
.
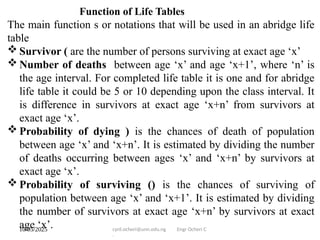
Function of Life Tables
The main function s or notations that will be used in an abridge life
table
Survivor ( are the number of persons surviving at exact age ‘x’
Number of deaths between age ‘x’ and age ‘x+1’, where ‘n’ is
the age interval. For completed life table it is one and for abridge
life table it could be 5 or 10 depending upon the class interval. It
is difference in survivors at exact age ‘x+n’ from survivors at
exact age ‘x’.
Probability of dying ) is the chances of death of population
between age ‘x’ and ‘x+n’. It is estimated by dividing the number
of deaths occurring between ages ‘x’ and ‘x+n’ by survivors at
exact age ‘x’.
Probability of surviving () is the chances of surviving of
population between age ‘x’ and ‘x+1’. It is estimated by dividing
the number of survivors at exact age ‘x+n’ by survivors at exact
age ‘x’.
23.
10/05/2025 cyril.ocheri@unn.edu.ng EngrOcheri C
.
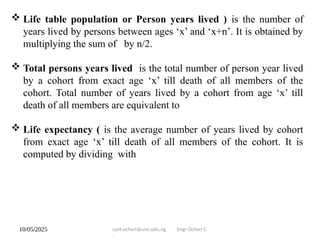
Life table population or Person years lived ) is the number of
years lived by persons between ages ‘x’ and ‘x+n’. It is obtained by
multiplying the sum of by n/2.
Total persons years lived is the total number of person year lived
by a cohort from exact age ‘x’ till death of all members of the
cohort. Total number of years lived by a cohort from age ‘x’ till
death of all members are equivalent to
Life expectancy ( is the average number of years lived by cohort
from exact age ‘x’ till death of all members of the cohort. It is
computed by dividing with
24.
10/05/2025 cyril.ocheri@unn.edu.ng EngrOcheri C
.
Uses of Life Tables
Life table helps to study population growth and forecast the size of
the population
Life table provide a schedule of age -specific mortality and survival
It enables the demography to estimate the true rate of increasing the
population
We cam estimate school -going population future labour force , future
orphans etc through the use of life table
It helps to anlyses the effects of mortality on the age and sex
composition of population