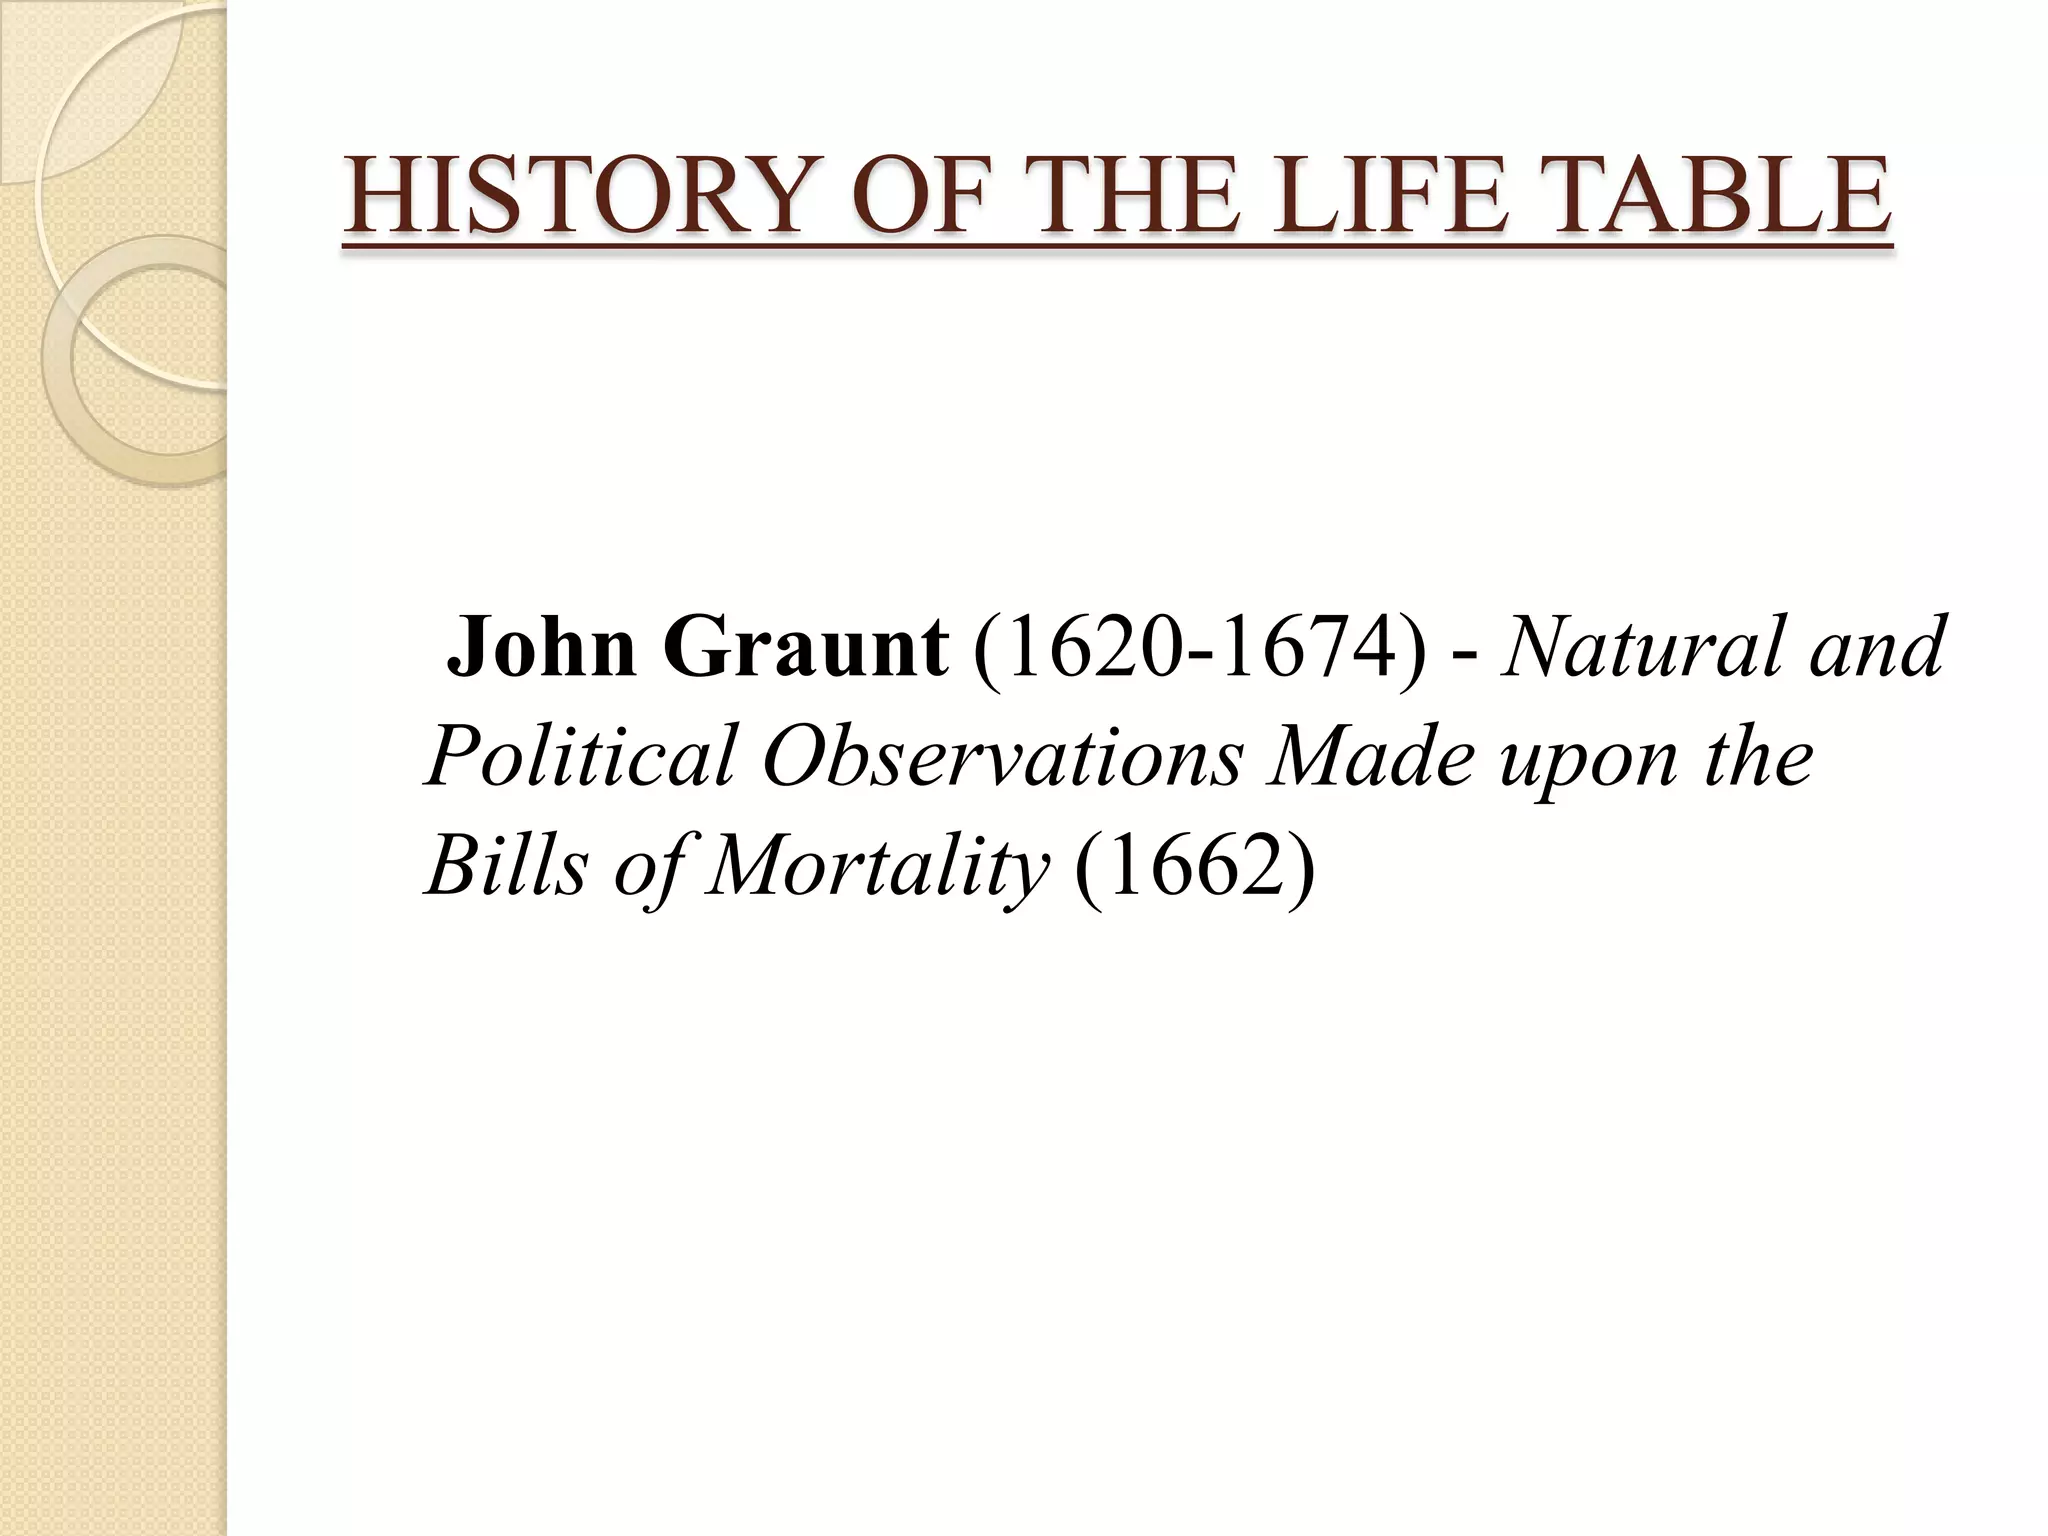
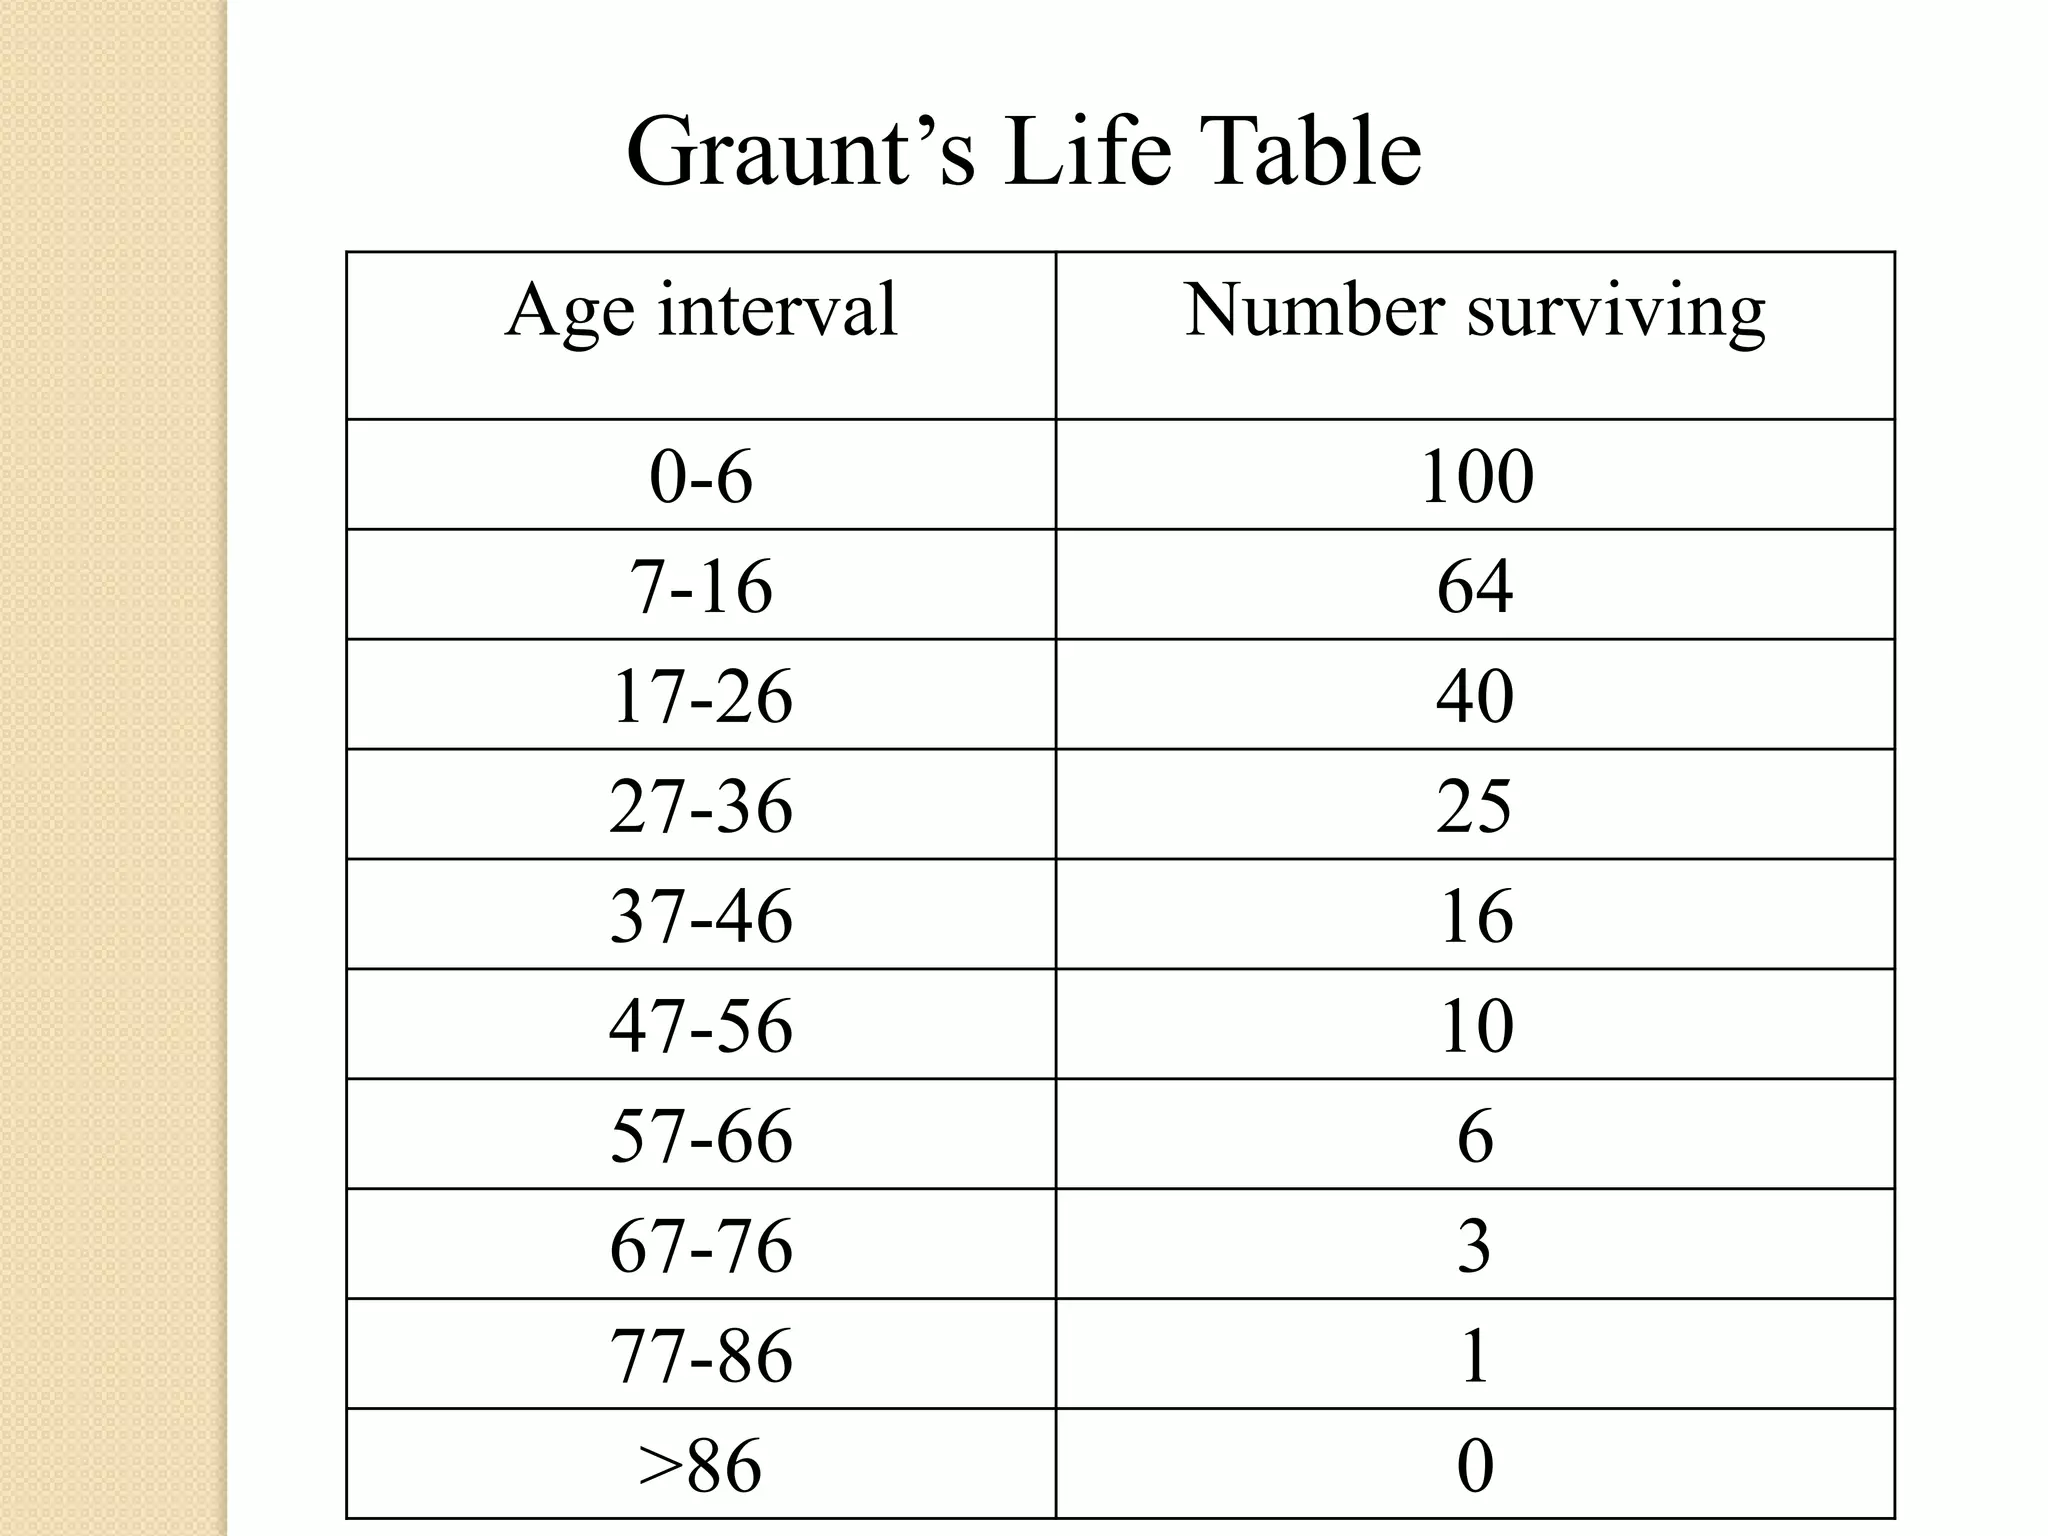
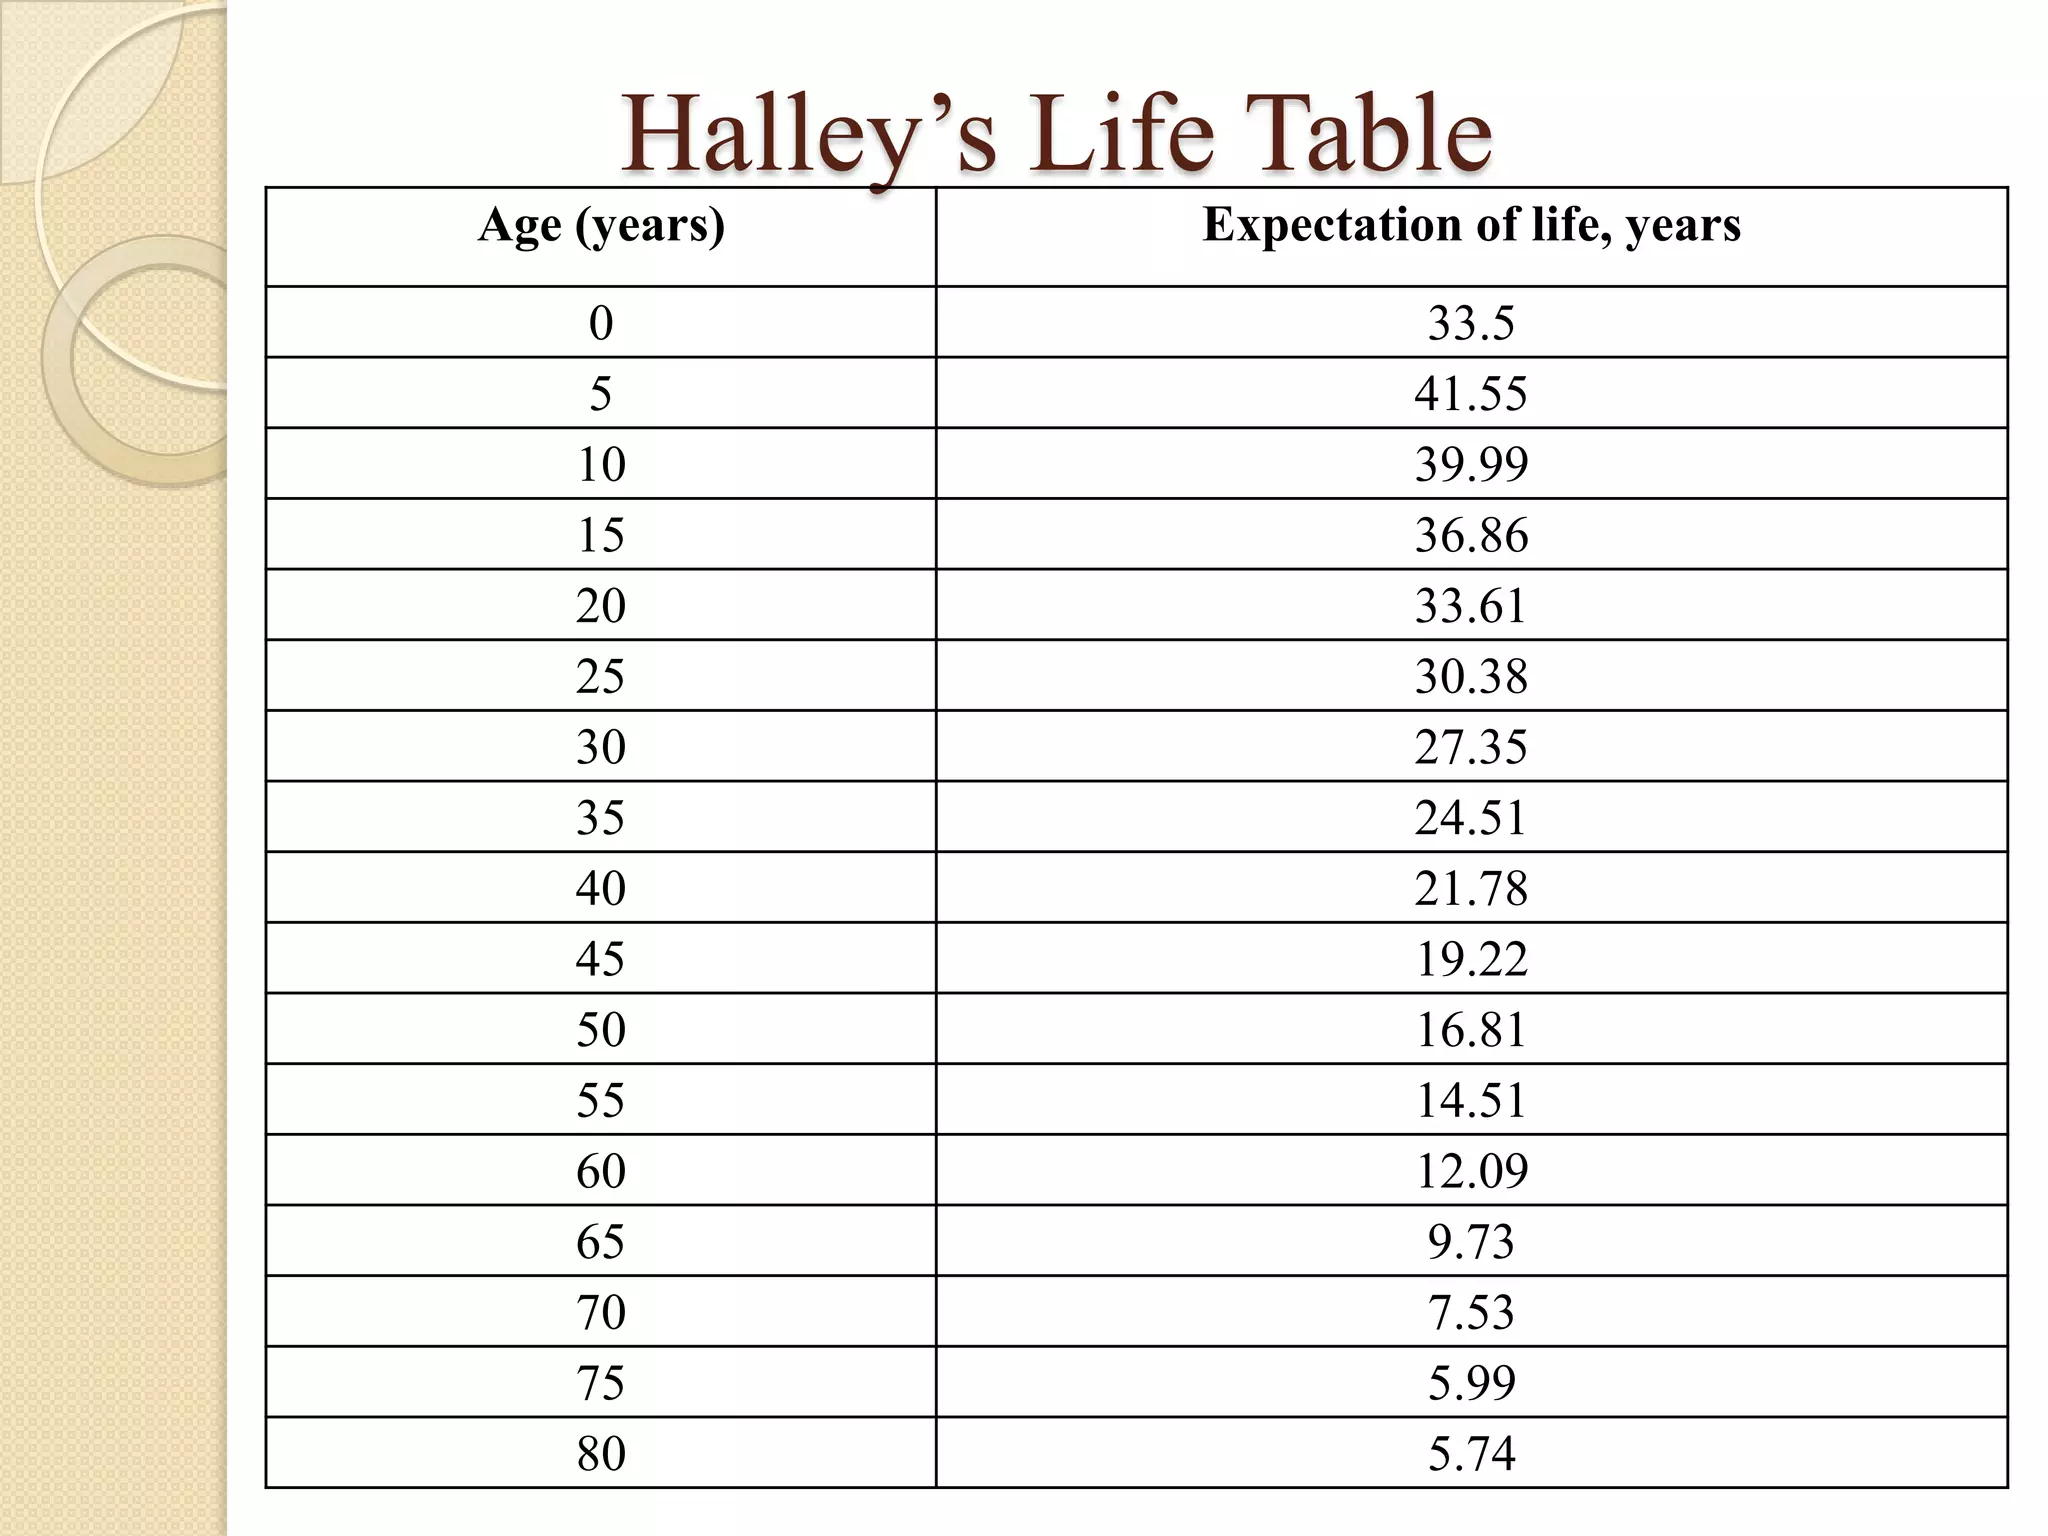
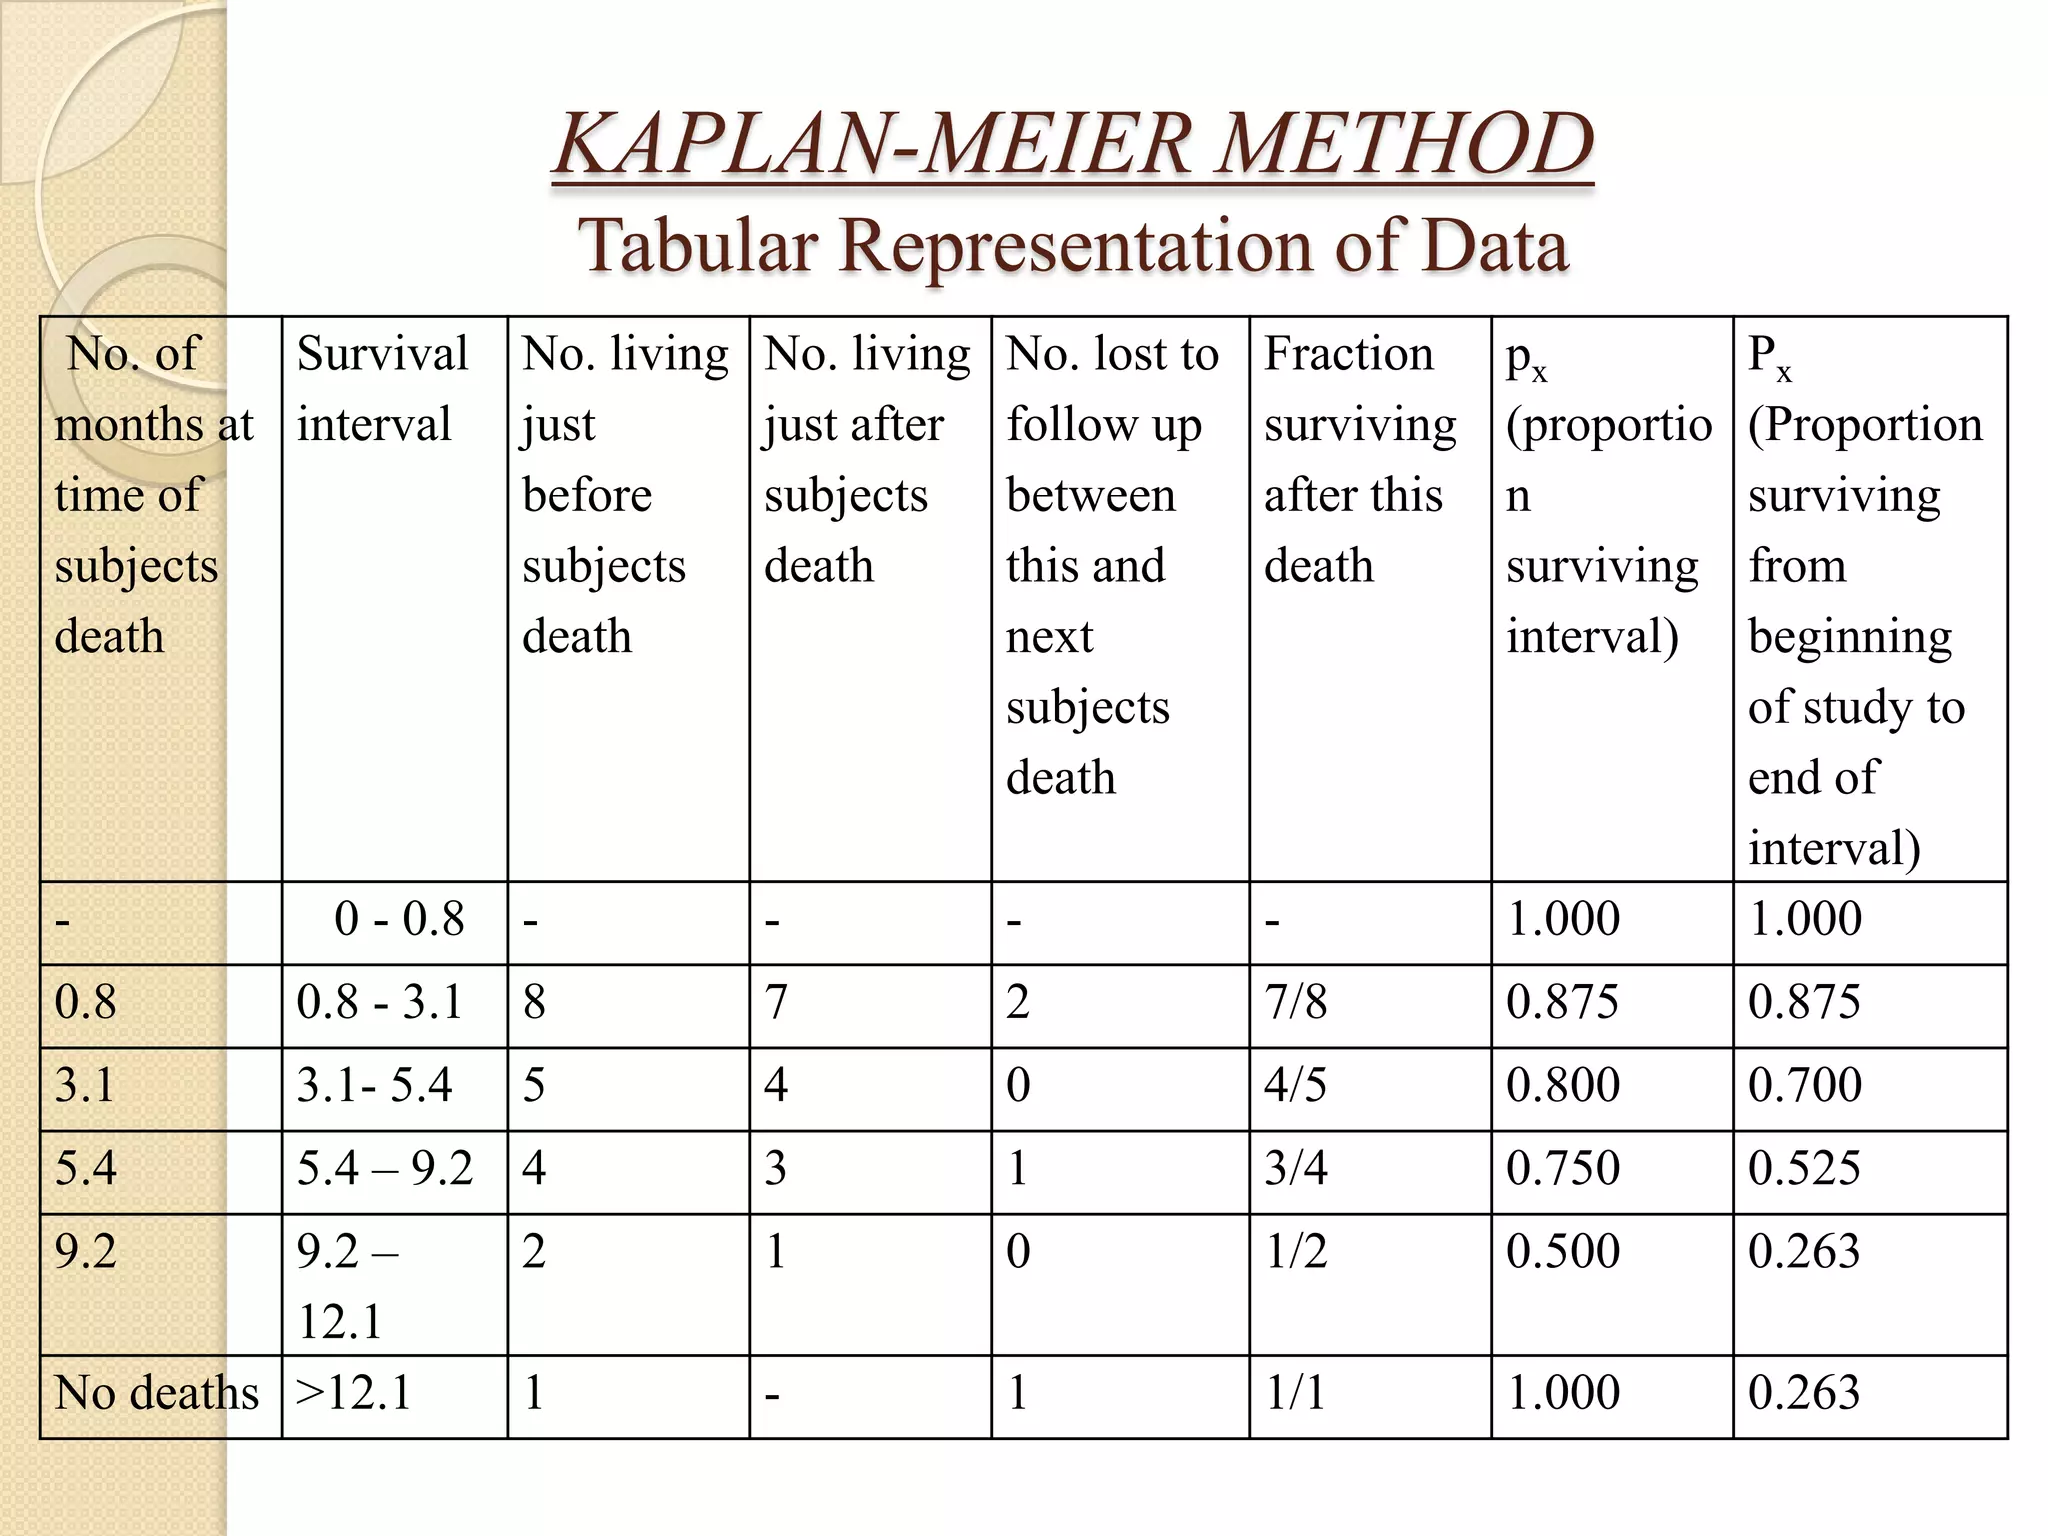
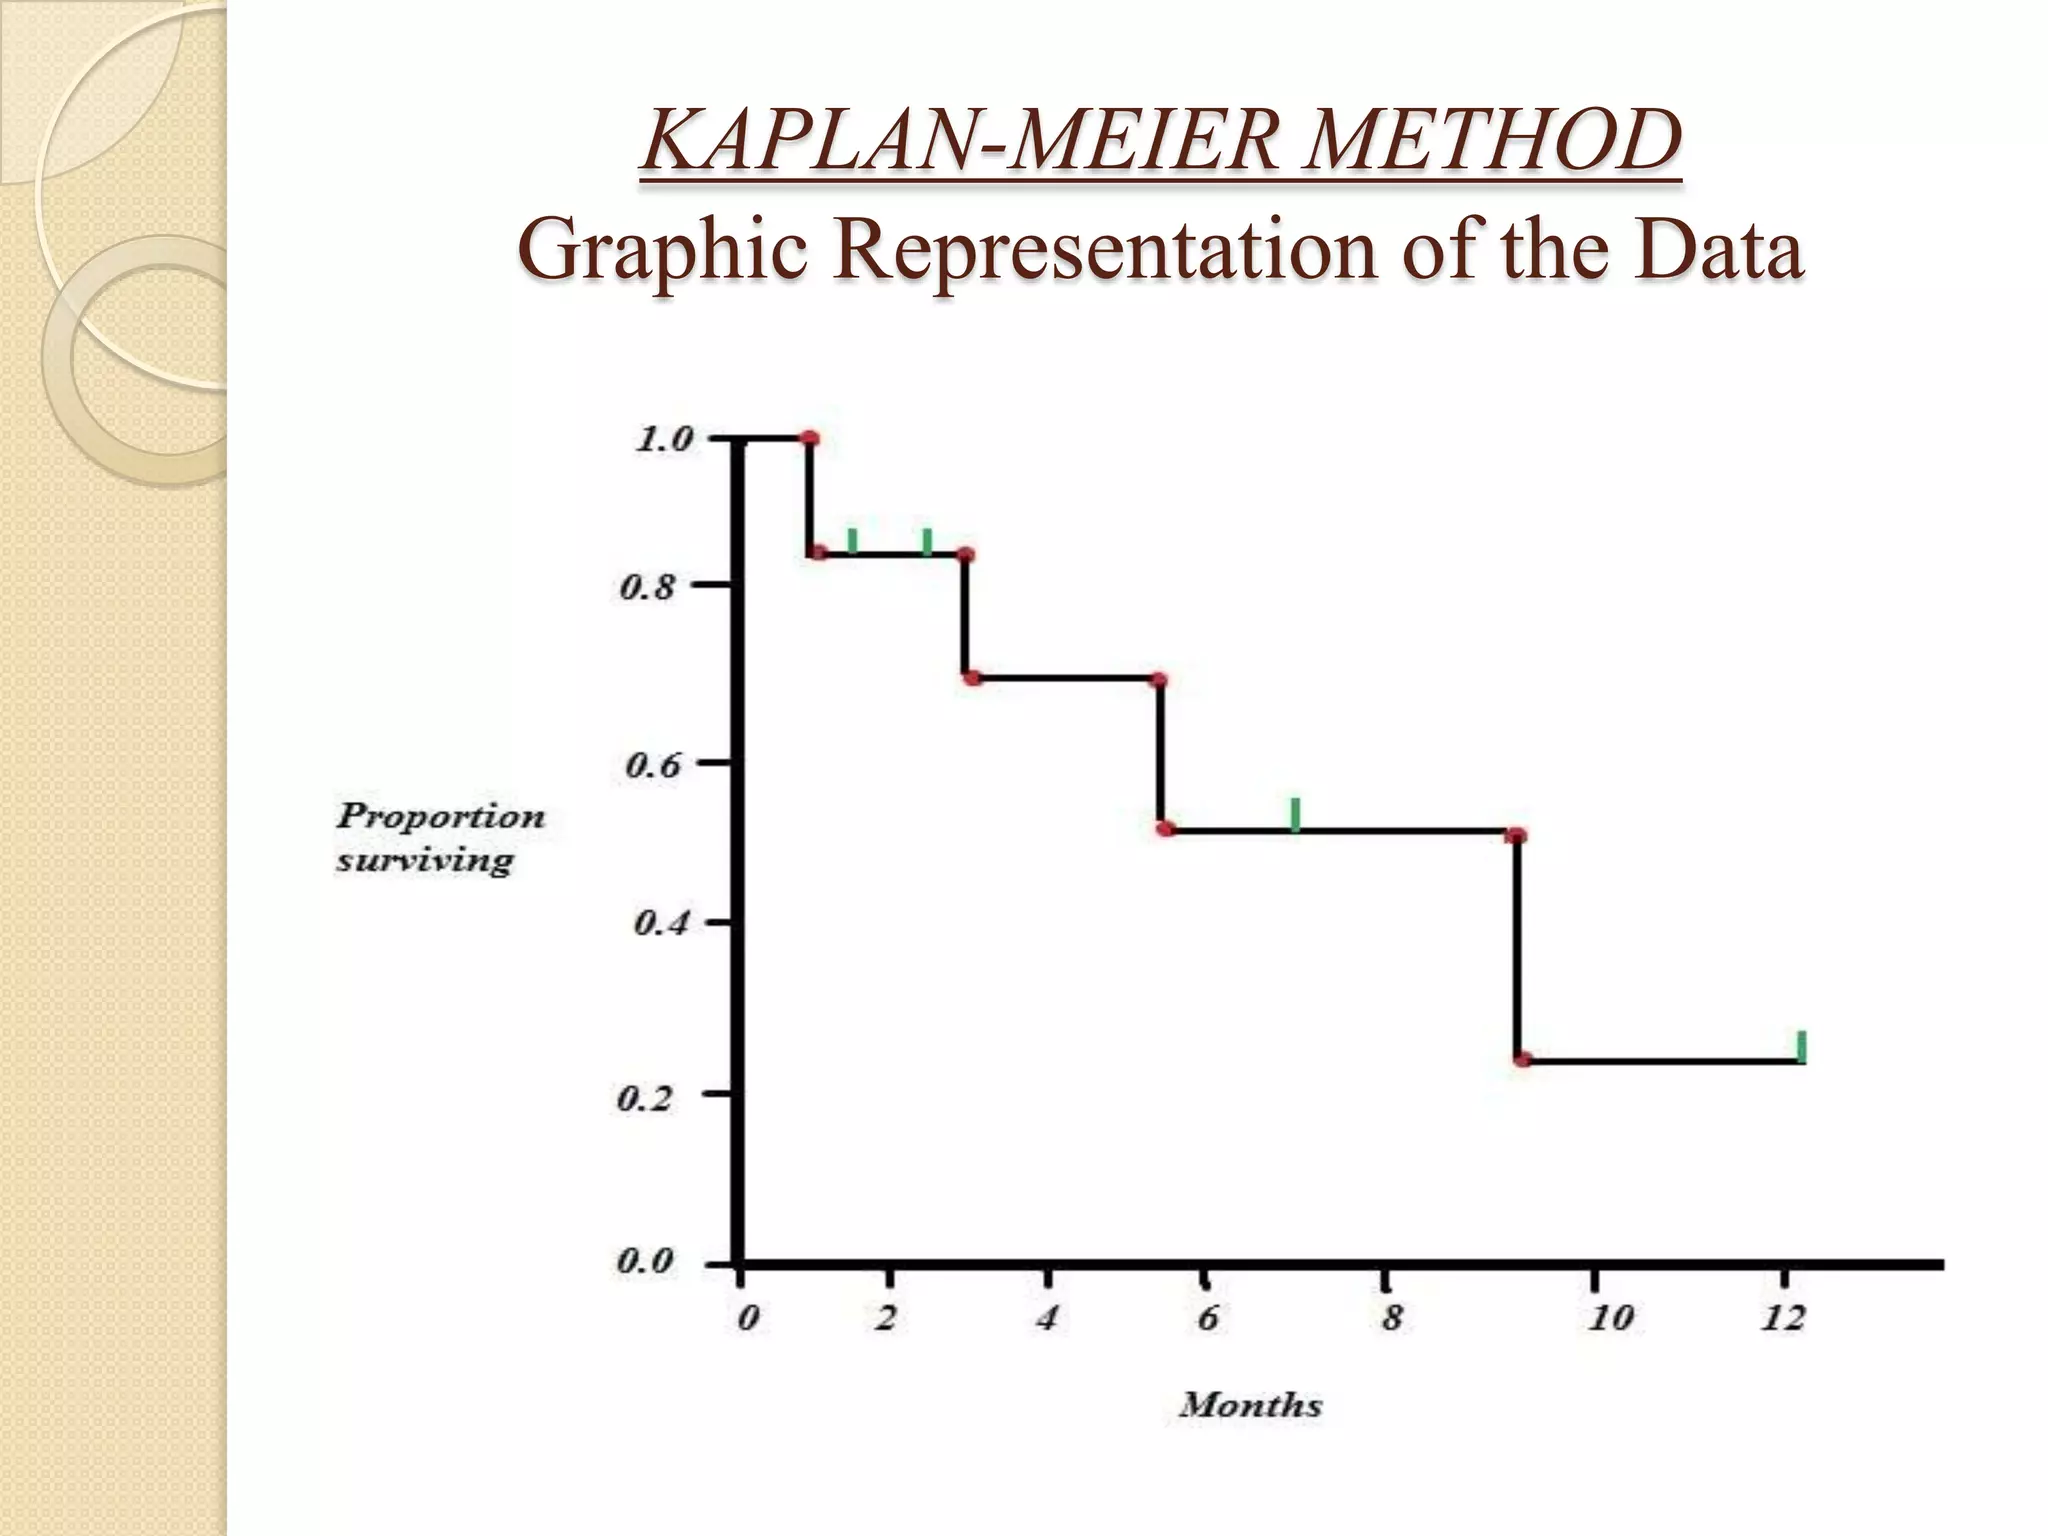
LIFE TABLEDr. Priyadarshini. CI M.D.ICM, MMC
INTRODUCTION	Described as the ‘Biometer’ of the population by William Farr.	Means of describing mortality, survival and other vital events in the population.
HISTORY OF THE LIFE TABLE
HISTORY OF THE LIFE TABLE	 John Graunt(1620-1674) - Natural and Political Observations Made upon the Bills of Mortality (1662)
Graunt’s Life Table
HISTORY OF THE LIFE TABLE
HISTORY OF THE LIFE TABLE	Edmund Halley (1656 – 1742) - ‘An estimate of the Degree of the Mortality of Mankind drawn from the curious Table of the Births and Funerals at the city of Breslaw’
Halley’s Life Table
IMPORTANCE OF LIFE TABLE- No. of survivors	At 5 years, the no, of children likely to enter primary school	At 15 years, no. of women entering fertile period	At 21 years. no. eligible for voting- No. likely to die after life insurance or after joining service to budget for payment towards risk or pension
IMPORTANCE OF LIFE TABLECalculation of expectation of life and comparison of mortality among communities
Population studies
Survival rate after treatment- Analysis by causes of death
CONSTRUCTION OF A LIFE TABLEPrerequisites1. Population living at all individual ages in a selected period2. No. of deaths that occurred in these ages during the selected period
Standard Notations
Construction of Life Table1.2.3.
Construction of Life Table4.5.6.7.
DECREMENT TABLE	The column of deaths or living can be split and analysed for new characteristics.
LIFE TABLE IN CLINICAL MEDICINEKAPLAN-MEIER METHODMost commonly used approach to survival analysis in medicine. Also called as the Kaplan-Meier life table method or the product-limit method.	Actuarial method used if there are large numbers of subjects but the Kaplan-Meier method more advantageous if the numbers of subjects are small.
KAPLAN-MEIER METHODThe actuarial method calculates survival rates based on fixed intervals whereas in the Kaplan-Meier method the intervals are uneven. 	Here, the deaths are not conceived of as occurring during an interval. Rather, they are seen as instantaneously terminating one interval and beginning a new interval.
KAPLAN-MEIER METHODDataTiming of Deaths in 4 subjects: 0.8, 3.1, 5.4, 9.2 monthsTiming of loss to follow-up or censorship in four subjects: 1.0, 2.7, 7.0, 12.1 months
KAPLAN-MEIER METHODTabular Representation of Data
KAPLAN-MEIER METHODGraphic Representation of the Data
KAPLAN-MEIER METHOD Graphic Representation of comparison of two groups
TESTS OF SIGNIFICANCE	Differences between actuarial survival curve – t-test and z-test	Differences between Kaplan-Meier curves – Logrank test
LOGRANK TEST

Life table