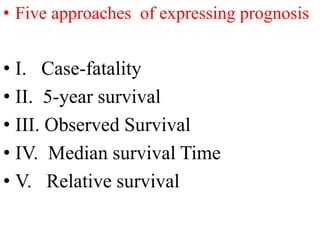
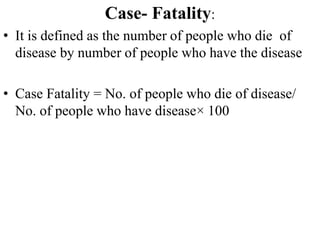
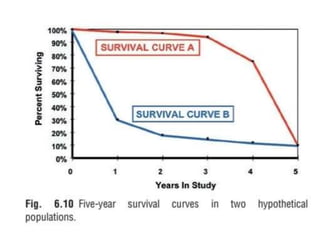
1. The document discusses various methods for expressing disease prognosis, including life tables and the Kaplan-Meier method.
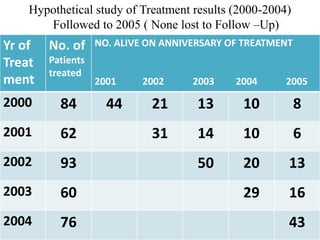
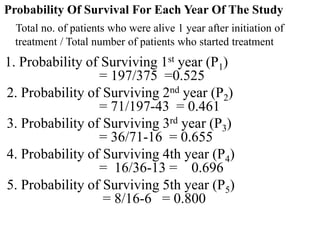
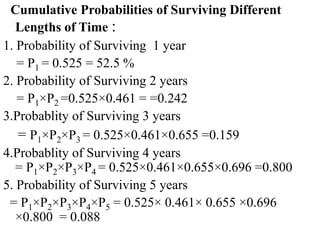
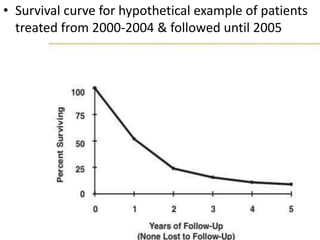
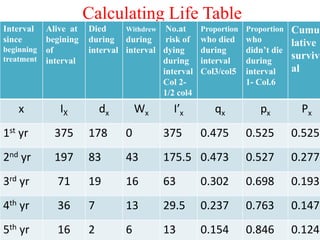
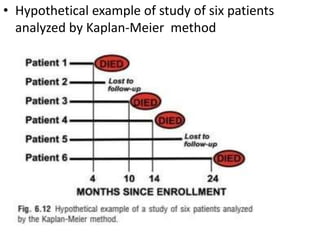
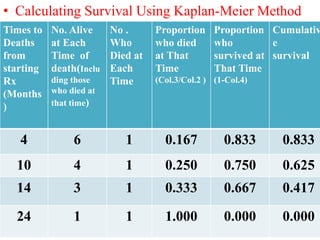
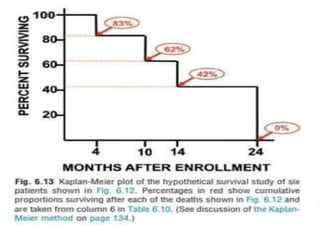
2. It provides examples of how to calculate survival probabilities using both a hypothetical life table and the Kaplan-Meier method based on data from patients treated between 2000-2004.
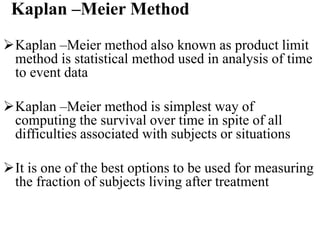
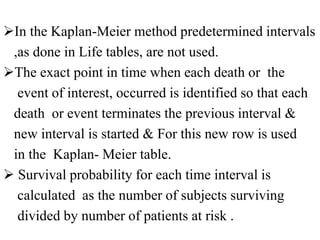
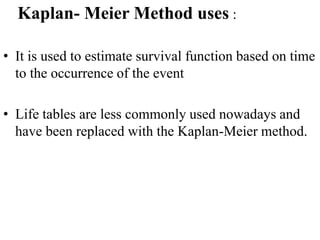
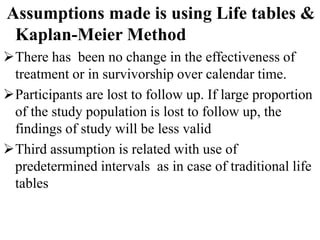
3. Both methods allow estimation of survival functions over time but the Kaplan-Meier method uses the exact times of events rather than predetermined intervals.


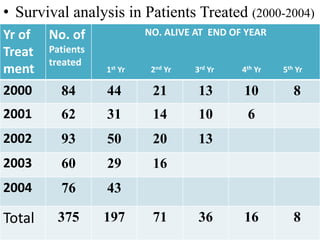


![CASE_PRESENTATION_ON_subdural_hematoma(SDH)[1 FINAL PPT]-1.pptx](https://cdn.slidesharecdn.com/ss_thumbnails/casepresentationonsubduralhematomasdh1finalppt-1-260129172522-d405d375-thumbnail.jpg?width=640&height=640&fit=bounds)


