Downloaded 13 times
![Simulating High Availability Scenarios in Cloud
Data Centers : A Closer Look
Mohamed Abu Sharkh∗, Abdallah Shami∗, Peter ¨Ohl´en†, Abdelkader Ouda∗, and Ali Kanso†
∗Department of Electrical and Computer Engineering, Western University
∗London, Canada, Email: {mabusha, ashami2, aouda}@uwo.ca
† Ericsson Research, Stockholm, Sweden, Email: {ali.kanso, peter.ohlen}@ericsson.com
Abstract—Migrating to the cloud is becoming a necessity for
the majority of businesses. Cloud tenants require certain levels
of performance in aspects like high availability and service rate
and deployment options. On the other hand, Cloud providers are
in constant pursuit of a system that satisfies client demands for
resources, maximizes availability, minimizes power consumption
and, in turn, minimizes the cloud providers’ cost. A main
challenge cloud providers face here is ensuring high availability
(HA). High availability includes the combined reliability of
components of all categories including network, computational,
hardware and software components of all layers.
In this work, we first address the need for a cloud simu-
lator that enables HA algorithm testing in cloud environments
and observe its impact on energy efficiency . We introduce a
framework to amend cloud simulators with critical HA features.
We take GreenCloud, a major simulator with a direct focus on
green computing, and implement these features as an additional
measurement layer. We demonstrate these added features by
simulating their impact on a phased communication application
(PCA).
Keywords: Cloud Computing, Cloud simulators, High Availabil-
ity, Scalability, Virtualization, Network and systems monitoring and
measurements
I. INTRODUCTION
With the increased migration of business applications to
the cloud, more familiar challenges related to service perfor-
mance are arising. The Cloud tenants require certain levels of
performance in aspects like high availability, pricing options
and general reliability. On the other hand, Cloud providers
strive to satisfy their clients’ demands according, first, to their
resource requirements and, second, to their service quality
requirements. Cloud providers are in constant pursuit of the
holy grail of cloud management systems. This translates to a
system that satisfies client demands for resources, maximizes
availability, minimizes power consumption and, in turn, min-
imizes cloud providers’ cost.
A main challenge cloud providers face to achieve these
goals is ensuring high availability (HA). Client are becoming
more demanding in that aspect and the 5 nines requirement
(guaranteeing that the data center service is available for
1This work is supported by the Natural Sciences and Engineering Research
Council of Canada (NSERC-STPGP 447230) and Ericsson Research.
99.999% of the time) is becoming a reality. High availabil-
ity includes the combined reliability for components of all
categories including hardware and software components. This
covers Network and processing resource sides. It also includes
the availability of components of all layers (cloud, racks,
servers, VMs, applications, application components).
HA received major attention as soon as the cloud solutions
started being deployed. In [1] for example, we notice a solution
depending on RAID-technology used to accomplish the task
of managing data across multiple cloud storage providers.
Factors like geographic location, quality of service, providers’
reputation, and budget preferences are taken into considera-
tion. Early efforts up to 2012 are summarized in [2] which
focused on HA techniques based on multi-core processing,
virtualization, and distributed storage. In more recent work,
the authors of [3] presented the HA constraints within the
context of a multiple objective resource scheduling problem
in the cloud environment. Their algorithm was tested on a
real life social news application with synthetically generated
costs and loads. Another variation is the one seen in [4], where
a failover strategy is presented. The tested technique combines
load balancing algorithms with multilevel checkpointing so as
to decrease checkpointing overheads. In their paper published
in 2014, the authors of [5] offer an architecture for automatic
failover between multiple Platform-as-a-Service (PaaS) cloud
providers.
Virtualized storage and redundancy are of prime interest
as well. In addition, other works can be found discussing
experiments on VM migration analysis, including security
related aspects [6] and performance analysis of migration
algorithms [7]. Finally, in [8], a solution is provided to ensure
HA in cloud storage by decreasing virtual machine reboot
time.
Cloud simulators play a critical role while developing
the optimal cloud data center management System. A cloud
simulator offers an environment to implement scheduling
policies and operation scenarios with clear cost advantage
and decreased risk. A cloud simulator serves as the first
barrier that can examine resource allocation algorithms, energy
efficiency techniques and HA-aware scheduling algorithms. A
comprehensive survey and feature comparison of the available](https://image.slidesharecdn.com/simulating-high-availability-scenarios-in-cloud-data-centers-a-closer-look-151210095902/75/Conference-Paper-Simulating-High-Availability-Scenarios-in-Cloud-Data-Centers-A-closer-look-1-2048.jpg)
![Fig. 1. GreenCloud output
cloud simulators can be found in [10].
The most popular simulators tried to cover cloud function-
ality in a generic view that covers components, processing
components and data center management as can be seen in
efforts like CloudSim (along with the extensions) [11][12],
GreenCloud [13] and MDCsim [14]. With all the efforts to
propose HA solutions for the different elements composing
the cloud, we still lack a Cloud simulator that can simulate
the behavior of multi-tiered applications, while considering
the different failures that can occur in the Cloud, and quantify
their impact on the applications availability.
Therefore, there is a need for a cloud simulator that enables
high availability algorithm testing in order to reach a HA
scheduling technique that does not sacrifice energy efficiency.
To the best of our knowledge, there is not a simulator that
provides the detailed functionality that enables measuring HA
metrics, testing HA algorithms and producing the results in a
way that can serve academia and the industry.
In this work, we introduce a framework to amend cloud sim-
ulators with HA features. We take GreenCloud as an example
of a major simulator with a direct focus on green computing
and implement these features as an additional measurement
layer. This is illustrated using the specifications of a phased
communication application (abbreviated henceforth as PCA).
Section II introduces a framework to enhance the cloud
simulator of choice with required features in order to turn
it into an HA-aware simulator. Section III presents the en-
hanced GreenCloud architecture and added features. Section
IV explains the experimental setup. Section V shows some of
the testing results achieved after enhancing GreenCloud with
HA-awareness and then we present conclusions in section VI.
II. A FRAMEWORK TO IMPLEMENT HA-AWARENESS IN
CLOUD SIMULATORS
The notion of guaranteeing a certain standard of high
availability has a direct effect on performance and specially
energy consumption in a cloud environment. Implementing
redundancy which is a prerequisite to any highly available
algorithm causes the amount of resources required to serve a
certain load to increase linearly. The increase factor in this case
will depend on the number of redundant hardware components.
In addition, the activities required to implement redundancy
require computational and network resources just like user
requests. This will, in turn, increase the demand for data center
resources and naturally increase energy consumption. Hence, a
careful consideration of the effect HA algorithms have on the
energy efficiency in the cloud is needed. This will assist cloud
providers in making the decision as to which HA algorithm
achieves the best trade-off for them in terms of availability
and energy efficiency.
To enable any cloud simulator to measure availability and
evaluate different HA algorithms in a cloud data center, it has
to include the following features.
1) HA Features
a) Component Failure
Components failure simulation means that simu-
lator users would be able to inject failure events
based on any specific time series or distribution
that suits their input. Components covered should
ideally include all GreenCloud components. This
includes servers, racks, virtual machines, switches
(all types) and other network components. This](https://image.slidesharecdn.com/simulating-high-availability-scenarios-in-cloud-data-centers-a-closer-look-151210095902/75/Conference-Paper-Simulating-High-Availability-Scenarios-in-Cloud-Data-Centers-A-closer-look-2-2048.jpg)
![includes the case of the whole data center failing
in case of a major power problem for example.
Another issue here is the domino effect of failure.
If a host fails, all VMs on it and tasks scheduled
on them would have to suffer failure too. All these
resource consumers (as termed in GreenCloud)
would be rescheduled on other servers(resource
providers).
b) Component Recovery
In a real data center, failed components naturally
come back to a running state after a period of time.
c) Synchronization Redundancy and Server Groups
Based on the roles they can perform, servers are di-
vided into groups . A task in phase I is only sched-
uled on a server in the corresponding(matching)
group. As shown in Fig. 2 and the flowchart in
Fig. 3, as the task in the first phase (for instance,
PCA client phase) is executed, the following task
is added to the scheduling queue matching the
next phase(PCA). When that phase is over, the fol-
lowing task is added to the following queue(IMS-
CSCF) until the last phase. That simulator also
guarantees that if a task in the IMS-CSCF phase
fails for any reason(server failure or VM failure
for example), the task will only be scheduled on
a server from the same server group(IMS-CSCF
server group).
2) Workload Modeling and Scheduling
a) Higher Granularity Modeling of Application
i) Adding User-defined Resources
A task as defined in GreenCloud includes the
attributes seen in Table I. The ability to add
extra types of resources means more shades of
problems can be represented. We can represent
scenarios in which specific servers have re-
sources other servers do not. For example, some
servers would be able to offer DB service for
a specific number of requests per second. This
can be helpful in simulating scenarios where
each server group performs a predefined role.
ii) Defining Tasks with User-defined Resource Re-
quirements
Emphasizing on the previous feature, task re-
source specification has to be amended with
the amount the task would request of the new
resource (I.O percentage or number of HTTP
requests the task contains for example).
iii) Defining Applications with Diverse Set of
Tasks Representing Execution in Dynamically-
defined Phases
A request in this case moves from being just
a simple task disjoint from all other tasks
and defined by only its computational resource
requirements and data exchange requirements
to something more inclusive. A request consists
TABLE I
TASKS IN GREENCLOUD- DEFINING ATTRIBUTES
Variable name Attribute
task(size) Input data to be sent to host the task is scheduled on
task(memory) [Byte] of used RAM
task(storage) [Byte] of disk space
task(duration) computing deadline of tasks in seconds(can be set as parameter
task(duration) computing deadline in seconds
task(outputsize) standard- Size of output on task completion
task(outputsize) Size of output on task completion
task(outputsize) low comm- Size of output on task completion
task(intercom) Size of inter-task communication
of a set of tagged tasks that have functional
dependency between them. The first task would
represent the first phase in implementing the
complete request. The request would be fully
executed when the task representing the last
phase gets executed. As seen in the figure ,
the request consists of tasks being processed at
the App front end component, app core , app
back end then the app core again and the front
end component once more before eventually
sending the results to the client. Each one of
these components could be scheduled on a
distant VM on a separate server along the data
center or event in other data centers.
b) Functional Dependency and Dynamic Scheduling
of Phases (based on resource requests)
Once the request is constructed of a set of tasks
that differ in resource requirements, the scheduler
is supposed to take that into consideration while
scheduling. A task will only be scheduled on a
server with the sufficient resources and also the
server with the suitable functionality. Tasks in
phase i will not be processed or scheduled before
tasks in phase i-1 are completed.
3) Monitoring and Reporting
a) Reporting Availability Status The measurements
shown in figure 1 are something to start with. The
metrics included are:
• Failure cases/component (server, VM, etc)
• Failure events/task
• Total outage time and percentage.
The availability of a complex component like a
data center can be calculated factoring in the
availability of its subcomponents (server, racks,
switches , etc).
b) Reporting Service Total Exec Time & Outage Time
The average completion time of a full request is
shown in Fig. 1. This means the total time to
complete all of its tasks (phases).
III. ENHANCING GREENCLOUD WITH HA FEATURES
A. GreenCloud scheduling environment
As one of the most detailed cloud simulators available,
Greencloud arises as a powerful tool to implement the pro-](https://image.slidesharecdn.com/simulating-high-availability-scenarios-in-cloud-data-centers-a-closer-look-151210095902/75/Conference-Paper-Simulating-High-Availability-Scenarios-in-Cloud-Data-Centers-A-closer-look-3-2048.jpg)
![Schedule
Wait Execute
Last
phase?
Finish
Set up gen
rate
Set up task
parameters
Initialization
generate
Active NS simulation
GreenCloud task Life cycle
Run NS
No
Yes
Data center level
Add to
Corresponding
Queue
PCA Client
PCA
IMS -CSCF
HSS
No
Current
feature
New
feature
Failure Injection/Recovery
Schedule new task
Core (CPU) level
Fig. 2. The enhanced task life cycle in GreenCloud
Set Up Task Parameters
Set Up Task Generation Rate
Generate Task
Schedule Task On Most Eligible Server/VM
Wait In The Queue
Execute
Task In Last Phase?
Task Goes To Next Phase
No
End
GreenCloud Task Execution Flowchart
Set Up Task resource requirements:
Hardware resources& Functionality resources
Construct Func_list to include servers having
the required functional capabilities
Construct Elegible_list from Func_lsit to include
servers having the required hardware resources
Order Elegible_list servers based on :
•Energy consumption
•Reliability (MTTF)
•Queue size
Fig. 3. GreenCloud task execution flowchart
posed functionalities. GreenCloud was developed as simulator
with a focus on energy efficiency and fine grained networking
capabilities. The prime purpose cited for building GreenCloud
is mitigating overprovision issues [13]. Overprovision happens
in a data center due to the loads constantly changing on
the computational and communication resources. The average
load can be as low as 30% of the data center server and
network capacity [13]. This, in turn, causes the data center
to systematically use more power than the optimal value.
GreenCloud offers simulation capabilities including mul-
tiple topology choices (2 layers and 3 layers) and it offers
communication through packets using the underlying NS-
2 simulator features. GreenCloud also offers the choice of
scheduling tasks(user requests) on hosts directly or on virtual
machines which reside on hosts.
Tasks are modeled as unit requests that contain resource
specification in the form of computational resource require-
ments (MIPs, memory and storage) in addition to data ex-
change requirements (task size variable representing the pro-
cess files to be sent to the host the task scheduled on before
execution, data sent to other servers during execution and
output data sent after execution).
B. HA enhancements made to GreenCloud
We have implemented the HA features discussed in the
previous section in GreenCloud. As illustrated in Fig. 1, failure
injection feature was added to GreenCloud. Failures and
recovery can be injected at preset times or taken from a file.
Related recovery procedures were also added. Corresponding
service and outage metrics are also available in the enhanced
GreenCloud as seen in the figure. Functional dependency
and synchronization dependency were implemented including
implementing task tagging, server grouping and the related ser-
vice metrics. Major changes to the GreenCloud Scheduler are
illustrated in the flowchart in Fig. 3. For a start, we distinguish
between hardware resource like RAM, CPU, disk, bandwidth
and Functionality resource like the HTTP capabilities, the
availability of DB implementation on the server and so on.,
The scheduler starts by filtering out the list of the all servers,
leaving only those that do include the functionality recourse
producing a Func list. Next, the servers that do not satisfy
the hardware resources from the Func list are filtered out and
hence an Eligible list is produced. This list is ordered based on
a combination of consumption of energy, reliability (MTTF)
and queue size. The task is then scheduled on the most eligible
server. This is done in every phase the task is in until the whole
request is served.
In the following paragraphs, the scenario used to test these
features is illustrated.
C. Phased Communication application(PCA) Scenario
The scenario we chose to evaluate the framework through
is a case where the cloud client uses leased cloud resources to
simulate the implementation of Phased Communication appli-
cation(PCA). This application makes communication services
accessible to developers using technologies like HTTP and
WebRTC. Without loss of generality, this scenario is used
as it demonstrates functional dependency, synchronization
dependency and the tagged tasks phases.
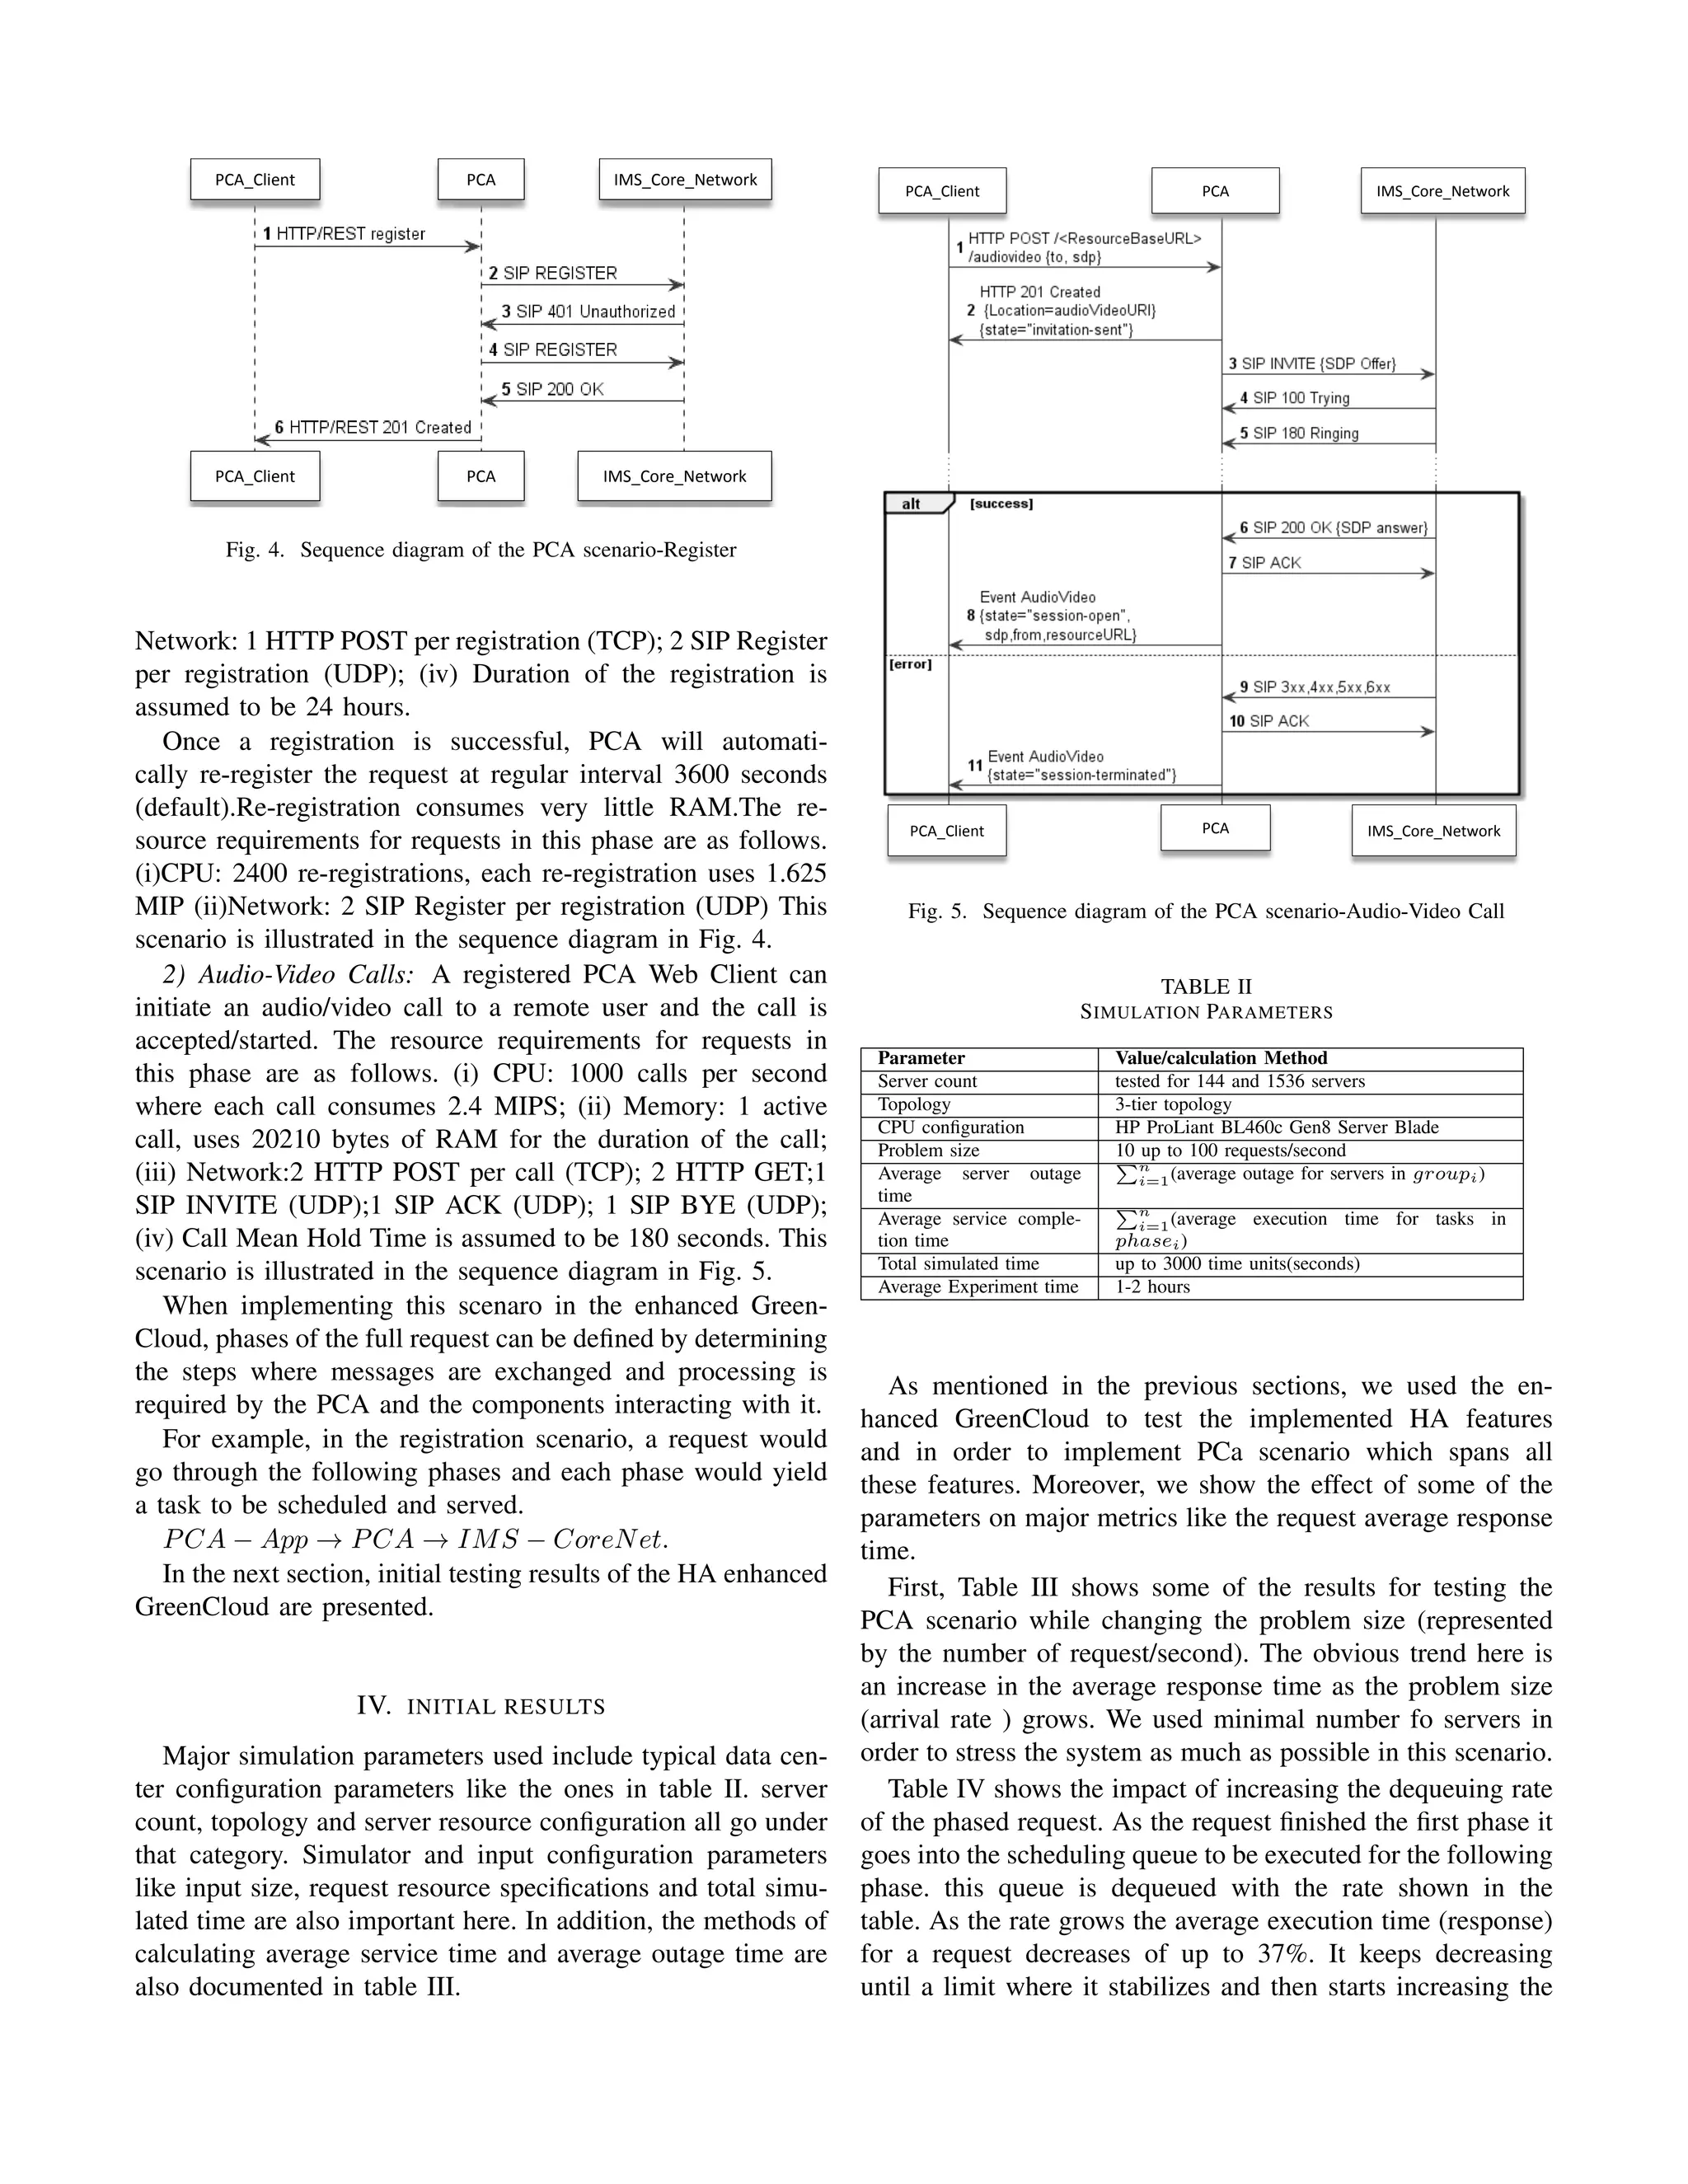
1) Registration: In this scenario, a Web Access component
allows HTTP-based clients to connect to an IMS network.
The PCA receives HTTP/REST-based requests from a web
client and sends these requests to the IMS network. The
PCA receives requests from the IMS network and sends them
as events over an event channel to the web client. these
requests allow clients to register to the IMS Core Network. The
resource requirements for requests in this phase are as follows.
(i) CPU: 1200 registrations per second where each registrations
consumes 2 MIPS; (ii) Memory: 1 active registration, uses
13905 bytes of RAM for the duration of the registration; (iii)](https://image.slidesharecdn.com/simulating-high-availability-scenarios-in-cloud-data-centers-a-closer-look-151210095902/75/Conference-Paper-Simulating-High-Availability-Scenarios-in-Cloud-Data-Centers-A-closer-look-4-2048.jpg)
![TABLE III
PCA SCENARIO SIMULATION RESULTS- IMPACT OF INCREASING THE
ARRIVAL RATE ON AVERAGE SERVICE TIME
Dequeuing
Rate
Total
servers
Group 1
size
Group 2
size
Requests
per sec
Average
service time
1 call/sec 2 1 1 10 0.36190456
1 call/sec 2 1 1 50 0.74810514
1 call/sec 2 1 1 100 1.24199910
TABLE IV
PCA SCENARIO SIMULATION RESULTS-IMPACT OF THE DEQUEUING RATE
ON THE AVERAGE SERVICE TIME
Dequeuing
Rate
Total
servers
Group 1
size
Group 2
size
Requests
per sec
Average
service time
1 call/sec 140 70 70 100 1.22678165
4 calls/sec 140 70 70 100 0.84924532
1000 calls/sec 140 70 70 100 0.77226364
1 call/sec 2 1 1 100 1.24199910
4 calls/sec 2 1 1 100 0.89261223
1000 calls/sec 2 1 1 100 0.79194872
average response time. This happens because the dequeuing
process adds no more value and just causes an overhead for
the simulator. the simulator runs the dequeuing process while
the queue is empty.
Table V show the effect of changing the server group sizes
on the average response time of a request. To show that and
also to show that this scenario works for large data center, we
tested the same set of features for a large data center of 1536
( the three-tier topology configuration in GreenCloud). A gain
of up to 17% in the average response time can be reached
by controlling the server group sizes even for the very small
load of 10 requests per second. The lesson to be learned here
is that the parameter configuration in terms of server group
distribution and dequeuing rate can be have positive impact if
they were adjusted to the exact demands of the input request
set. A closer look at the resource requirements and life time of
each phase of the request has the potential to produce sizeable
gains in response time and power consumption. An effect on
the power consumption metric was recorded as well. For the
large data center setup (1500 servers), A gap of 14.5 kW*h was
recorded between the two server group configurations used.
This gap could grow as the load starts increasing to meet the
data center capacity. The lesson to be learned here is that the
parameter configuration in terms of server group distribution
and dequeuing rate can be have positive impact if they were
adjusted to the exact demands of the input request set. A closer
look at the resource requirements and life time of each phase
of the request has the potential to produce sizable gains in
response time and power consumption.
TABLE V
PCA SCENARIO SIMULATION RESULTS-LARGE DATA CENTER
Group 1
size
Group 2
size
Average service time Power consumption
750 750 0.26823299 17111.9 kW*h
1500 1 0.31653402 17095.4 kW*h
V. CONCLUSION
The cloud computing environment current state of affairs
imposes the need for cloud solutions that enables high avail-
ability capabilities without sacrificing energy efficiency. To
address this need, researchers need resilient comprehensive
algorithms as well as sufficient tools that enables them to
evaluate new techniques. We introduced a framework to amend
GreenCloud cloud simulator with HA features. The sides
covered were HA features, workload modeling and scheduling
features,and reporting/monitoring. This was illustrated using
the specifications of the PCA example.
After implementing the PCA scenario for different topolo-
gies and data center configurations, the results show that
gains in the average response time can be achieved by con-
trolling parameters including the server group distributions
and dequeuing rate. This includes adjusting the scheduling
decisions and the parameter configuration according to the
demands of the input request set. A closer look at the resource
requirements and life time of each phase of the request has the
potential to produce sizable gains in response time and power
consumption.
In the future, we will investigate the performance of dif-
ferent scheduling algorithms when amending the resource list
with user-defined unconventional resources like security capa-
bilities or guaranteed DB performance. The ultimate objective
is reaching a comprehensive HA algorithm that can serve a
wide range of cloud applications.
ACKNOWLEDGMENTS
The authors would like to thank GreenCloud developing
team represented by Mateusz Guzek for promptly answering
questions. The authors would also like to thank the CloudSim
team for an informative forum and group website.
REFERENCES
[1] M. Schnjakin, R. Alnemr, and C. Meinel, “A security and high-
availability layer for cloud storage,” Grid Computing Environments
Workshop,GCE ’08, pp.1-10, 12-16 Nov 2008.
[2] C. Pham, P. Cao, Z. Kalbarczyk, and R. Iyer, “Toward a high avail-
ability cloud: Techniques and challenges,” IEEE/IFIP 42nd International
Conference on Dependable Systems and Networks Workshops (DSN-W),
Jun. 2012, pp. 1-6.
[3] M. Frincu and C. Craciun, “Multi-objective Meta-heuristics for Schedul-
ing Applications with High Availability Requirements and Cost Con-
straints in Multi-Cloud Environments,” IEEE International Conference
on Utility and Cloud Computing (UCC) , Washington, DC, USA, 2011.
[4] D. Singh, J. Singh, and A. Chhabra, “High availability of clouds:
Failover strategies for cloud computing using integrated checkpointing
algorithms,” 2012 International Conference on Communication Systems
and Network Technologies(CSNT), May 2012, pp. 698703.
[5] I.D. Addo, S.I. Ahamed, and W.C. Chu, “A Reference Architecture for
High-Availability Automatic Failover between PaaS Cloud Providers,”
International Conference on Trustworthy Systems and their Applications
(TSA), 9-10 Jun 2014, pp.4 - 21.
[6] Y. Wang, J. Ma, D. Lu, X. Lu, and L. Zhang. “From high-availability to
collapse: quantitative analysis of Cloud-Droplet-Freezing attack threats
to virtual machine migration in cloud computing,” Cluster Computing
Journal ,Dec 2014, Volume 17, Issue 4, pp 1369-1381
[7] D.K. Prasad, “High Availability Based Migration Analysis to Cloud
Computing for High Growth Businesses,” International Journal of Com-
puter Networks (IJCN), Volume 4, Issue 2, 2012 pp 35](https://image.slidesharecdn.com/simulating-high-availability-scenarios-in-cloud-data-centers-a-closer-look-151210095902/75/Conference-Paper-Simulating-High-Availability-Scenarios-in-Cloud-Data-Centers-A-closer-look-6-2048.jpg)
![[8] S. Jaffer, M. Chitnis, and A. Usgaonkar, “Providing high availability in
cloud storage by decreasing virtual machine reboot time,” 10th Workshop
on Hot Topics in System Dependability (HotDep 14), Oct 2014.
[9] M. Abu Sharkh, M. Jammal, A. Ouda, and A. Shami, “Resource
Allocation In A Network-Based Cloud Computing Environment: Design
Challenges,” Communications Magazine, IEEE Volume:51, Issue:11
Nov., 2013, pp.46-52.
[10] M. Abu Sharkh, A. Kanso, A. Shami, and P. ¨Ohl´en “Building a
Cloud on Earth: A Study of Cloud Computing Data Center Simulators,”
Submitted to Elsevier Computer Networks journal, Aug. 2015.
[11] R. N. Calheiros, et al., “CloudSim: a toolkit for modeling & simulation
of cloud computing environments & evaluation of resource provisioning
algorithms,” Software: Practice& Experience, Vol.41, pp.23-50, 2011.
[12] S. K. Garg and R. Buyya, “NetworkCloudSim: modeling parallel
applications in cloud simulations,” 4th IEEE International Conference
on Utility and Cloud Computing, pp.105-113, 2011.
[13] D. Kliazovich, P. Bouvry, and S. U. Khan, “GreenCloud: a packet-
level simulator of energy-aware cloud computing data centers,” Journal
of Supercomputing, special issue on Green Networks, 2011.
[14] S. H. Lim, B. Sharma, G. Nam, E. K. Kim, and C. R. Das, “MDC-
Sim: a multi-tier data center simulation, platform,” IEEE International
Conference on Cluster Computing and Workshops, pp.1-9, 2009.](https://image.slidesharecdn.com/simulating-high-availability-scenarios-in-cloud-data-centers-a-closer-look-151210095902/75/Conference-Paper-Simulating-High-Availability-Scenarios-in-Cloud-Data-Centers-A-closer-look-7-2048.jpg)

The document discusses the need for high availability (HA) in cloud data centers as businesses increasingly migrate to cloud computing. It introduces a framework to enhance cloud simulators, specifically GreenCloud, by incorporating HA features that improve performance and energy efficiency while addressing component failures and recovery. The authors detail the enhancements made to GreenCloud, allowing users to simulate high availability scenarios effectively and evaluate the impact on energy consumption.


![Vibe Coding vs. Spec-Driven Development [Free Meetup]](https://cdn.slidesharecdn.com/ss_thumbnails/vibecodingvsspecdrivendevelopment-251209105622-43f455e7-thumbnail.jpg?width=640&height=640&fit=bounds)


