Download to read offline

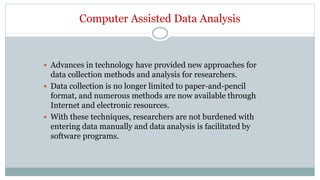
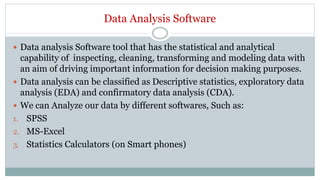
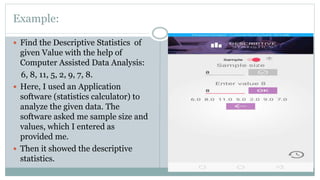


The document discusses the advancements in computer-assisted data analysis, highlighting the transition from traditional data collection methods to modern electronic resources. It explains the role of data analysis software, such as SPSS and MS Excel, in inspecting and modeling data for decision-making purposes, along with examples of how these tools simplify the analysis process. The author emphasizes the efficiency and accuracy of utilizing such software in performing statistical calculations.


![Lecture 04 - Exploratory Data Analysis - EDA [Basics].pptx](https://cdn.slidesharecdn.com/ss_thumbnails/lecture04-exploratorydataanalysis-edabasics-260114092941-c7b659e6-thumbnail.jpg?width=640&height=640&fit=bounds)