![DR VISHAL BATHMA [MBBS, MBA(HA), MD]
COMMUNITY MEDICINE
Socio-Economic Status Scale
2020
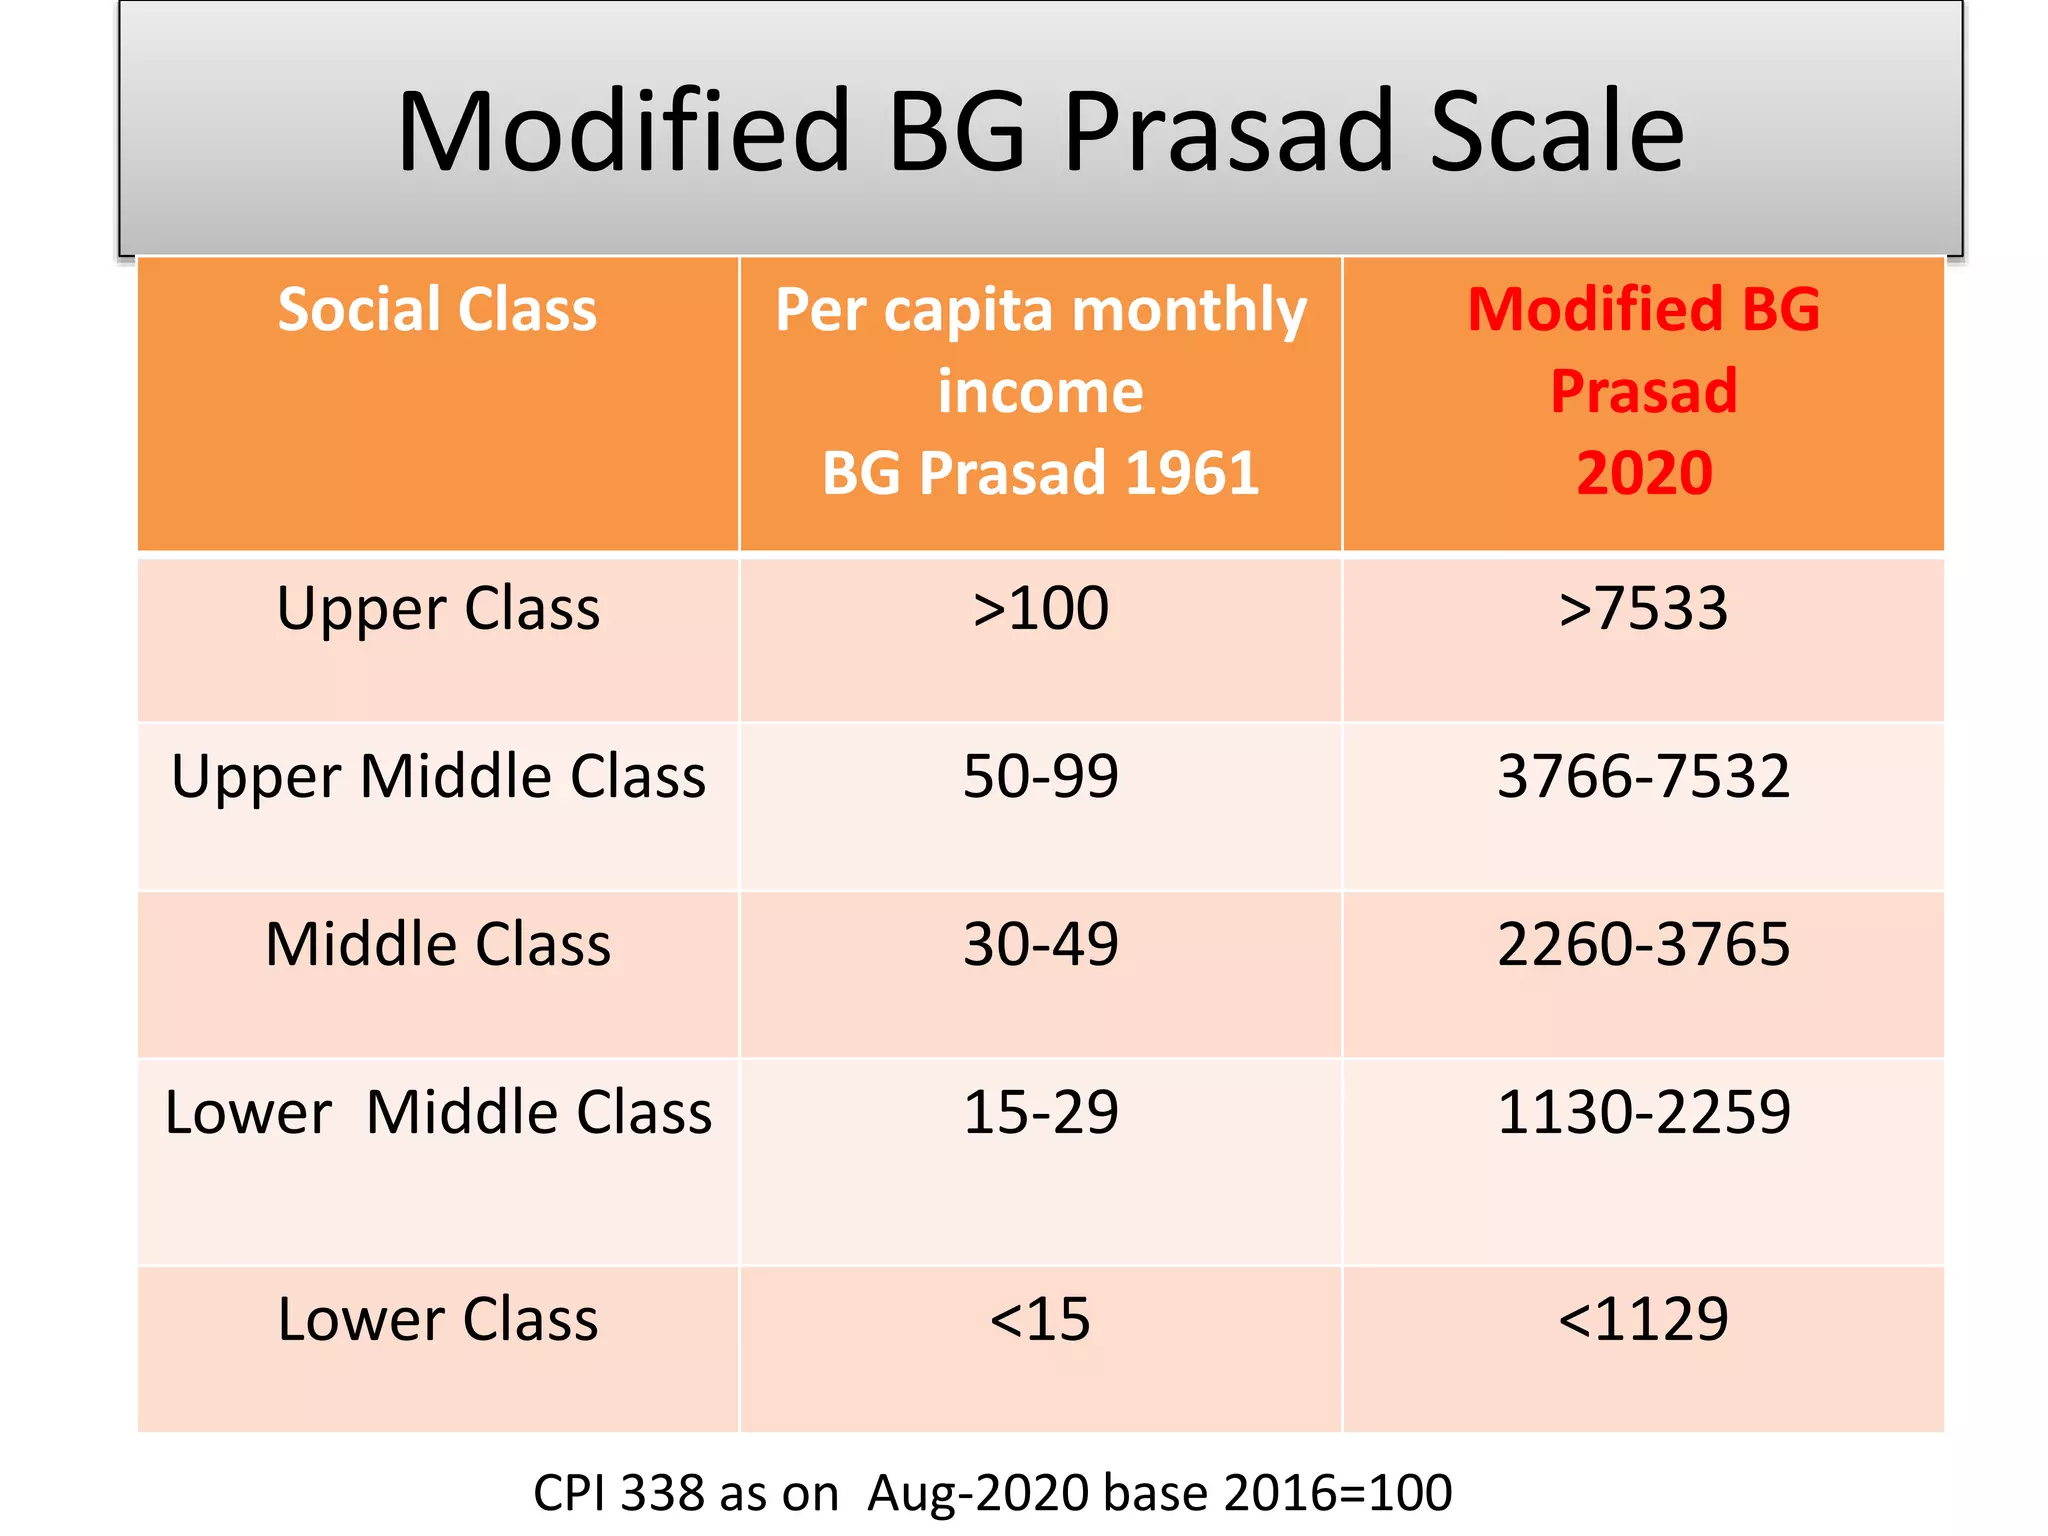
CPI 338 as on Aug-2020 base 2016=100](https://image.slidesharecdn.com/socio-economicstatusscales-210328094127/75/Socio-economic-status-scales-1-2048.jpg)
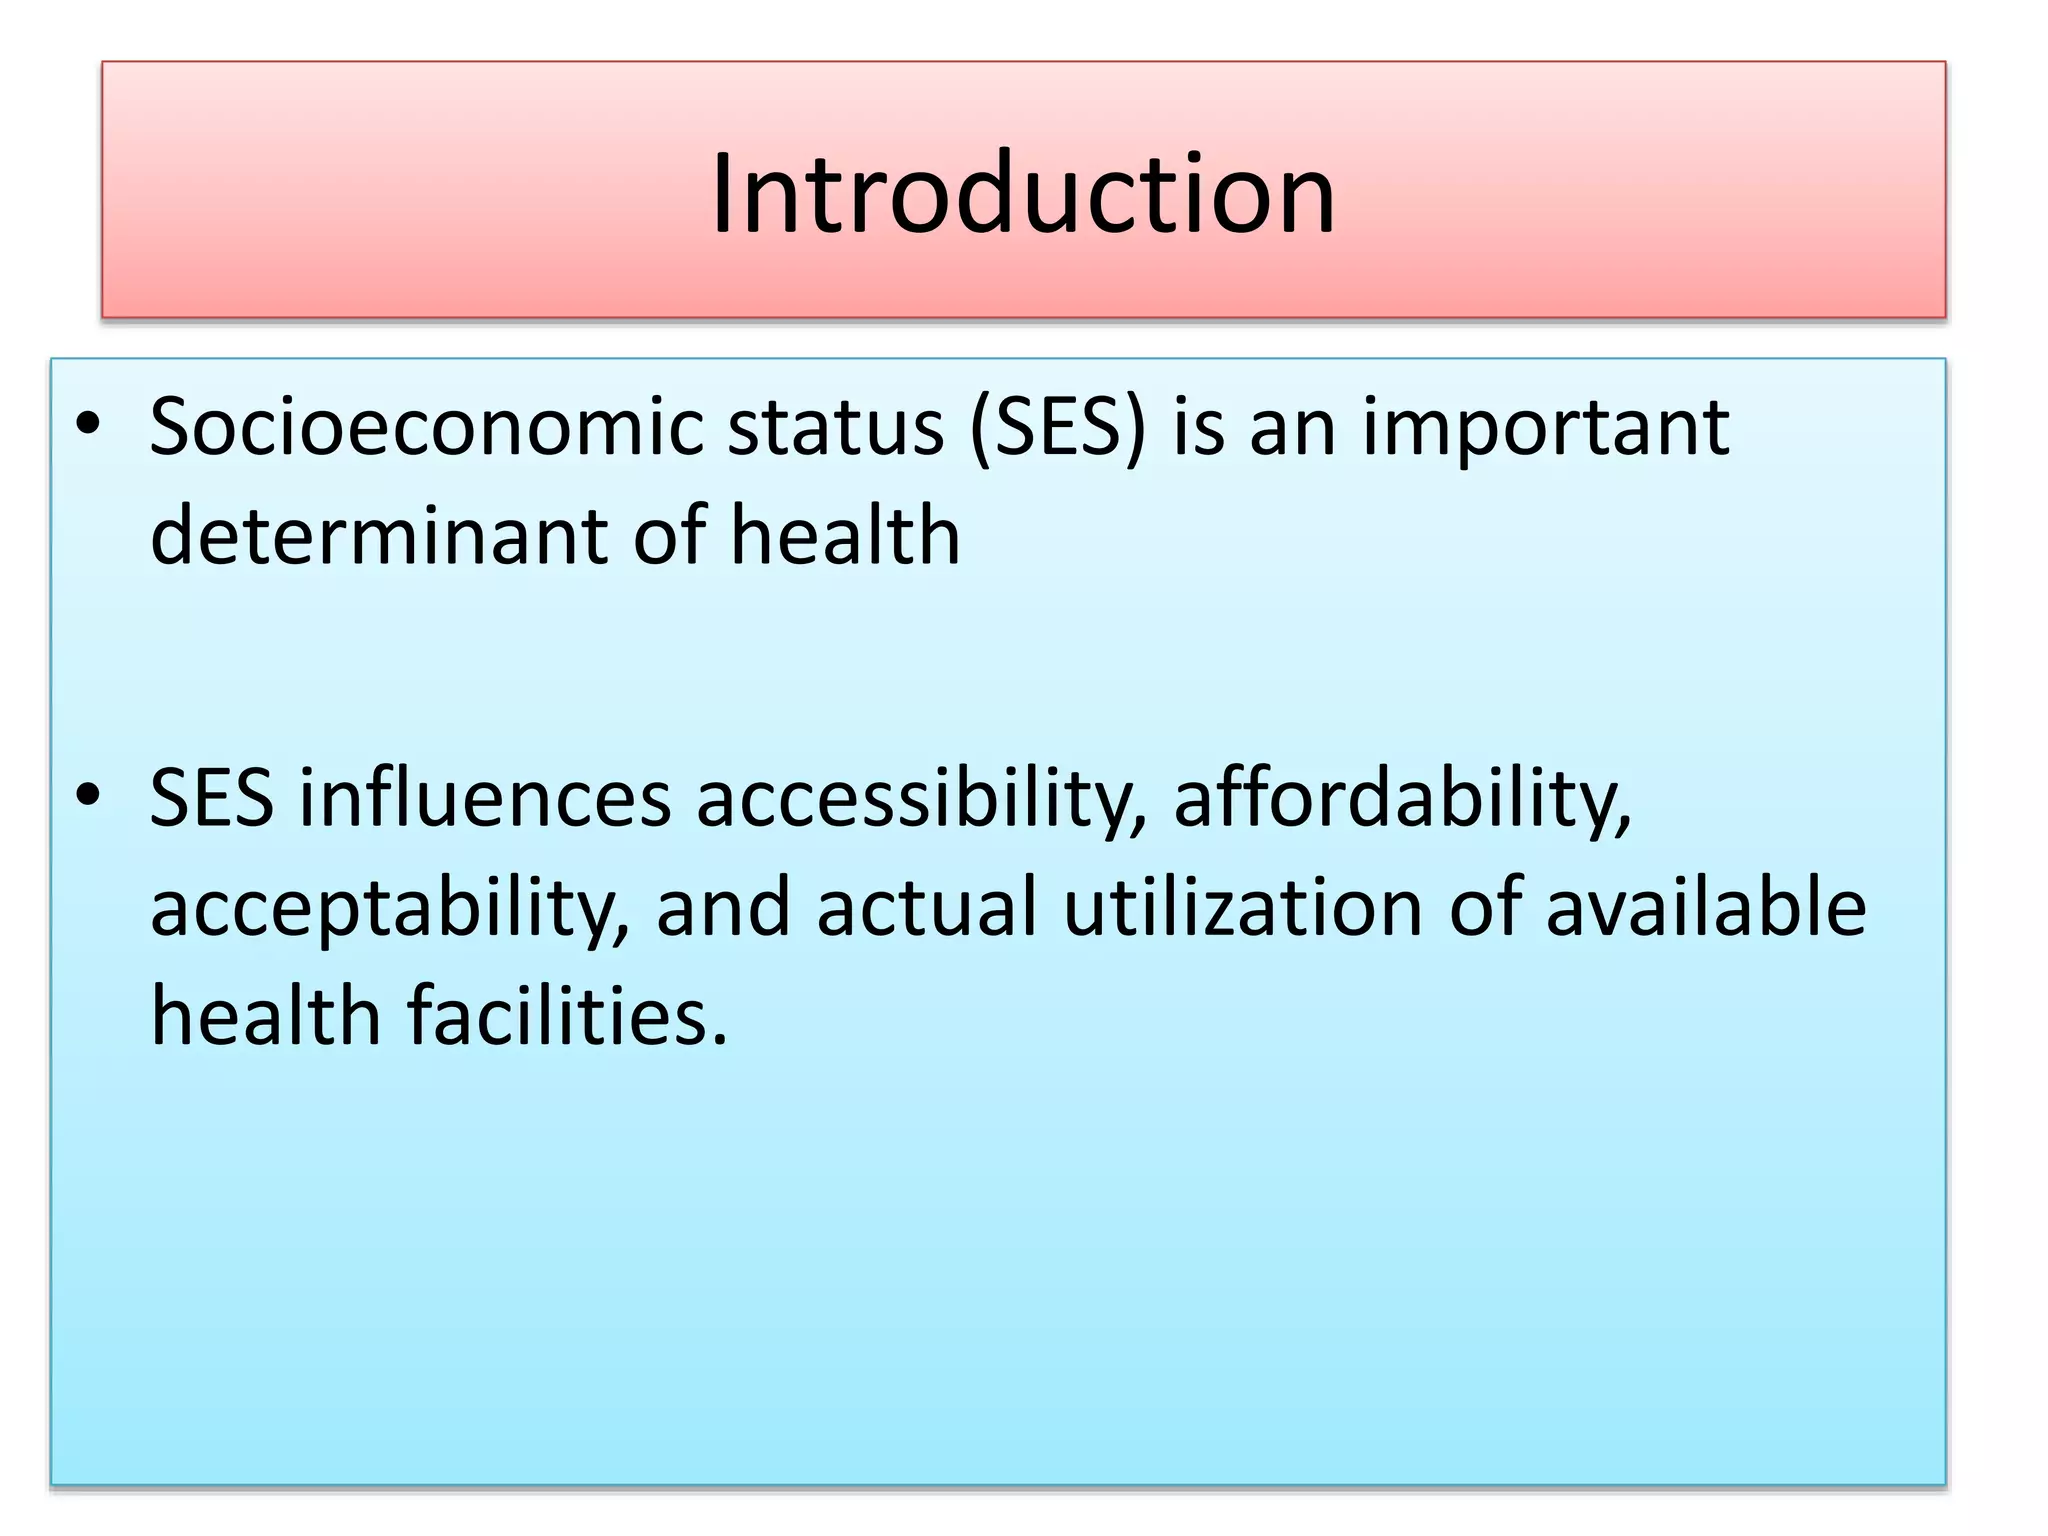

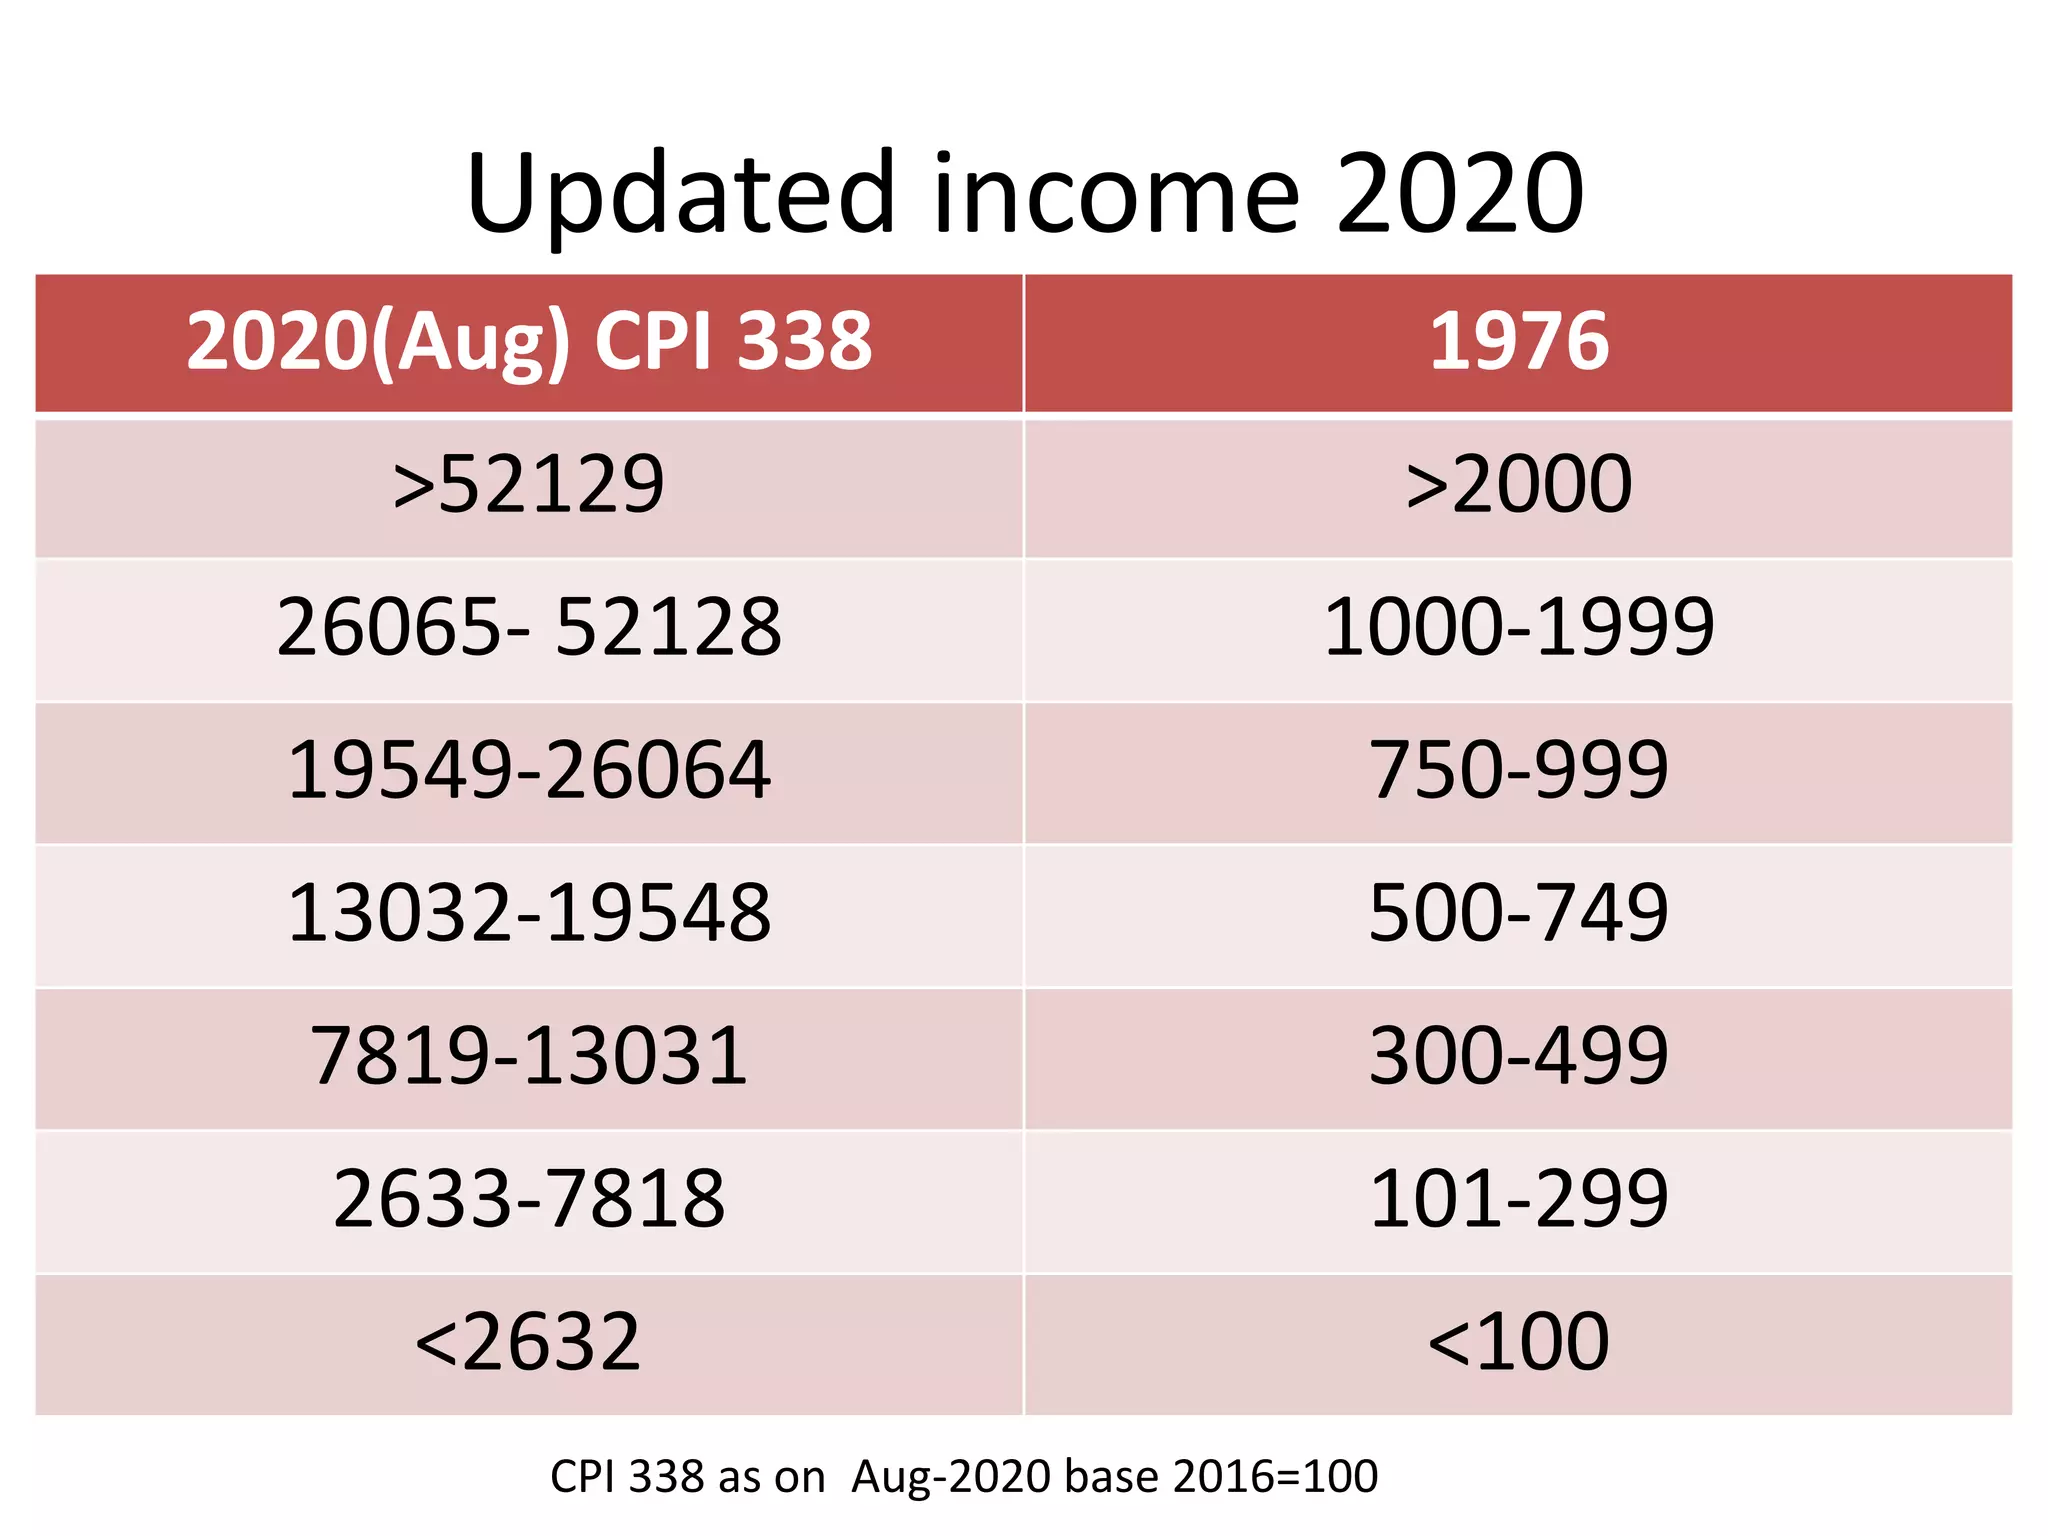
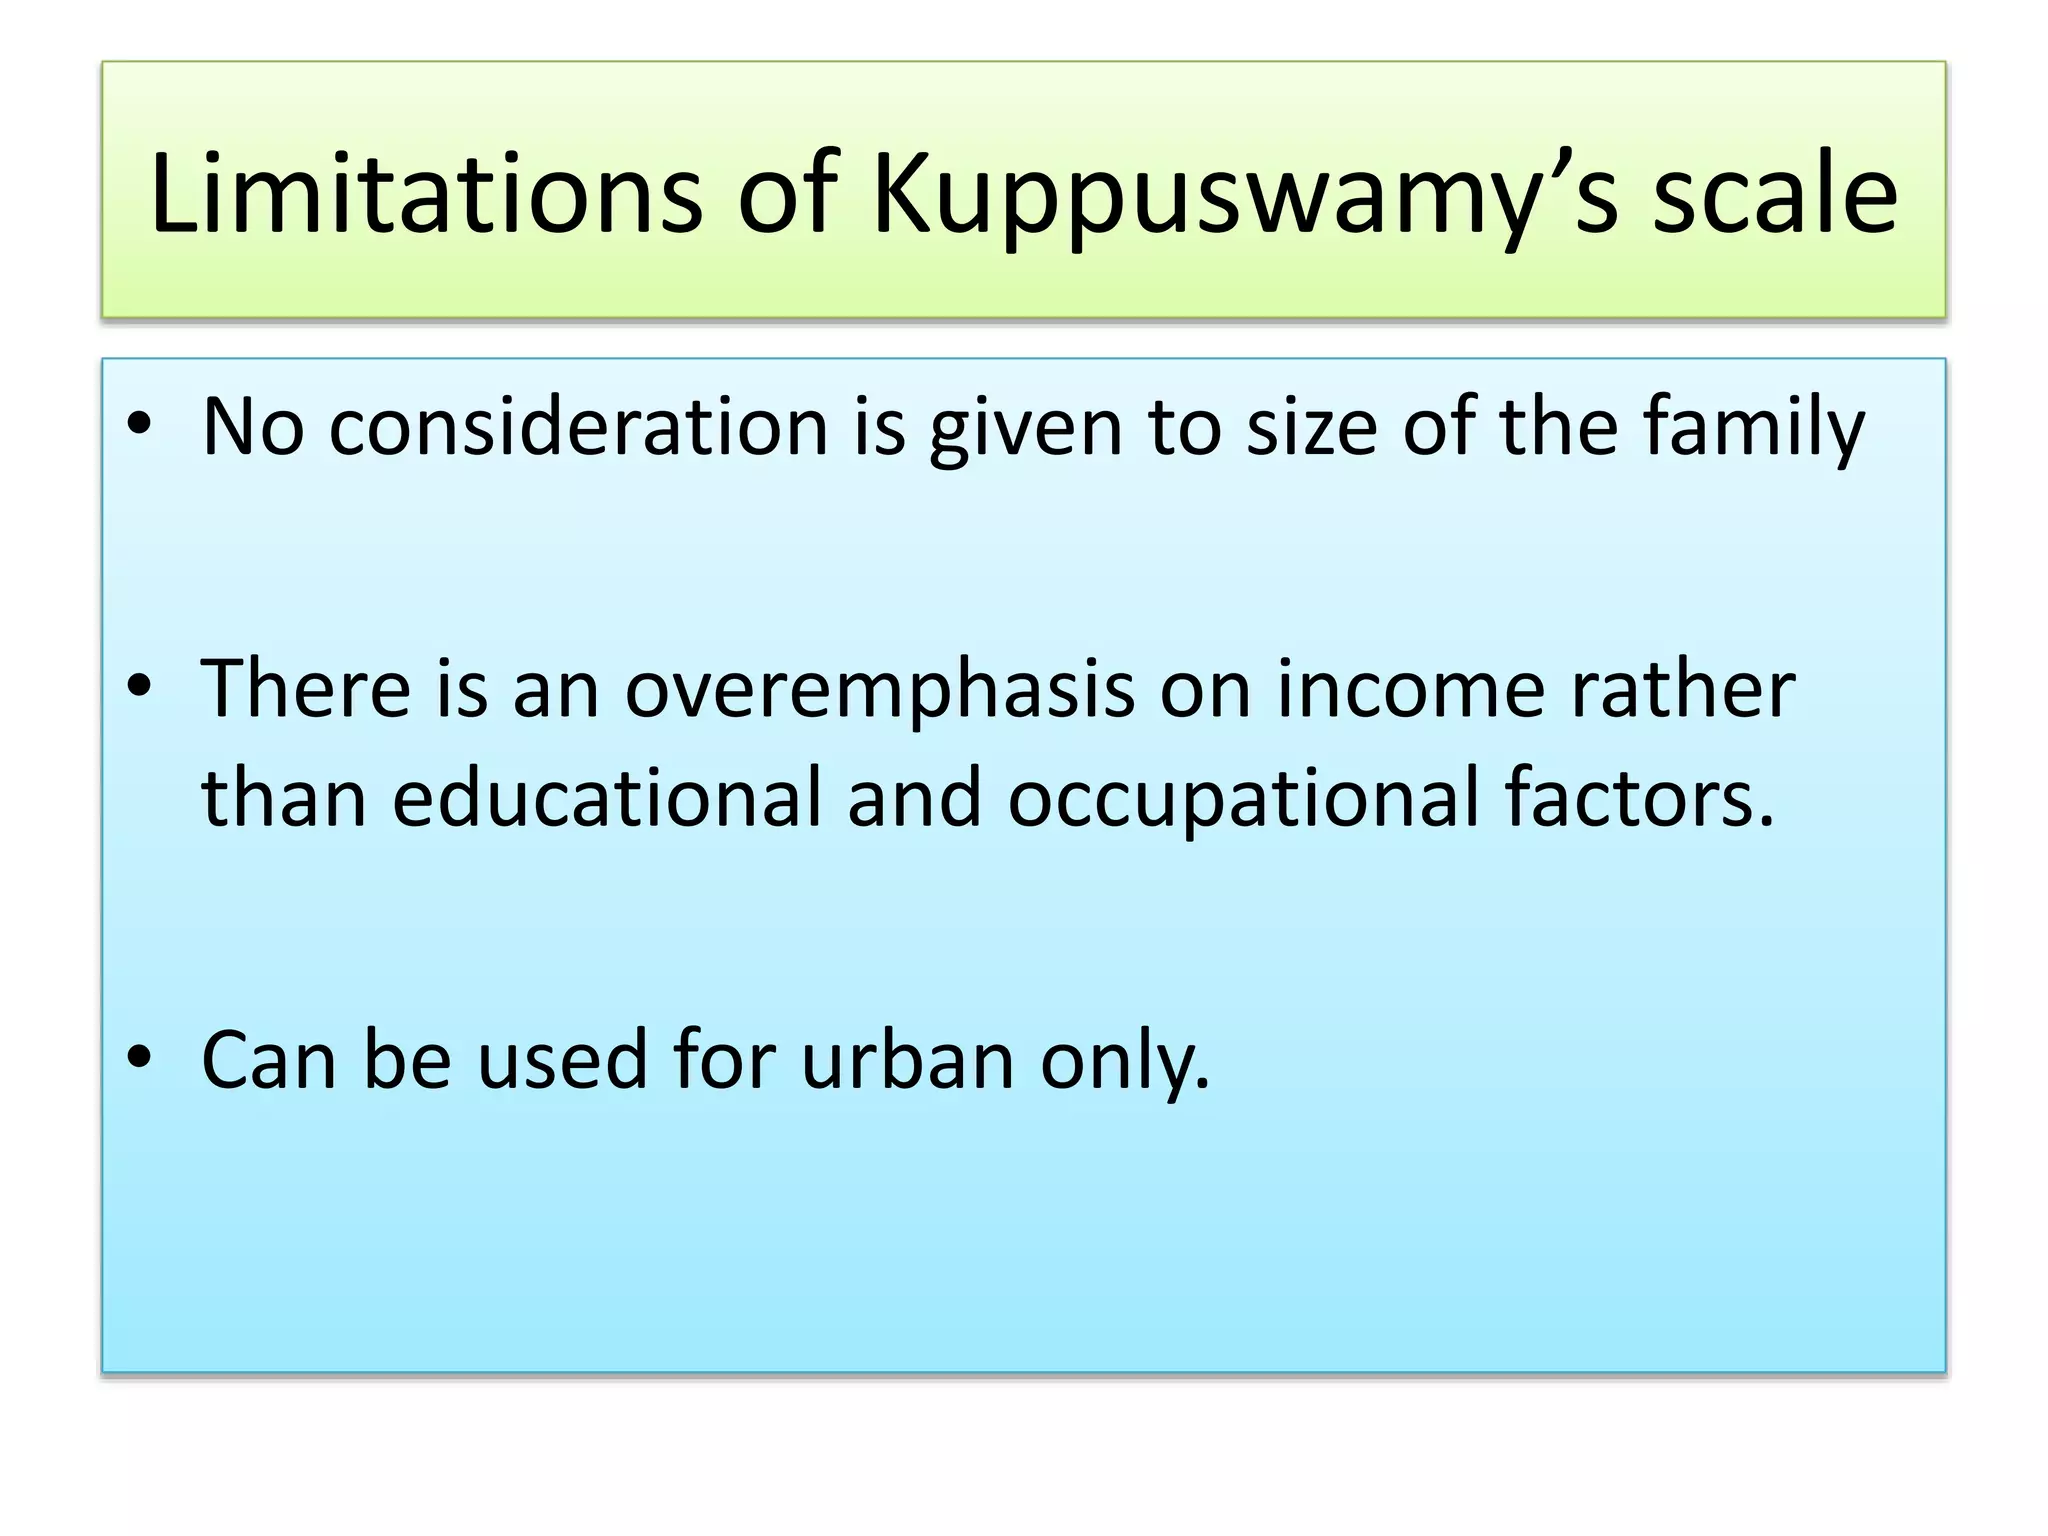
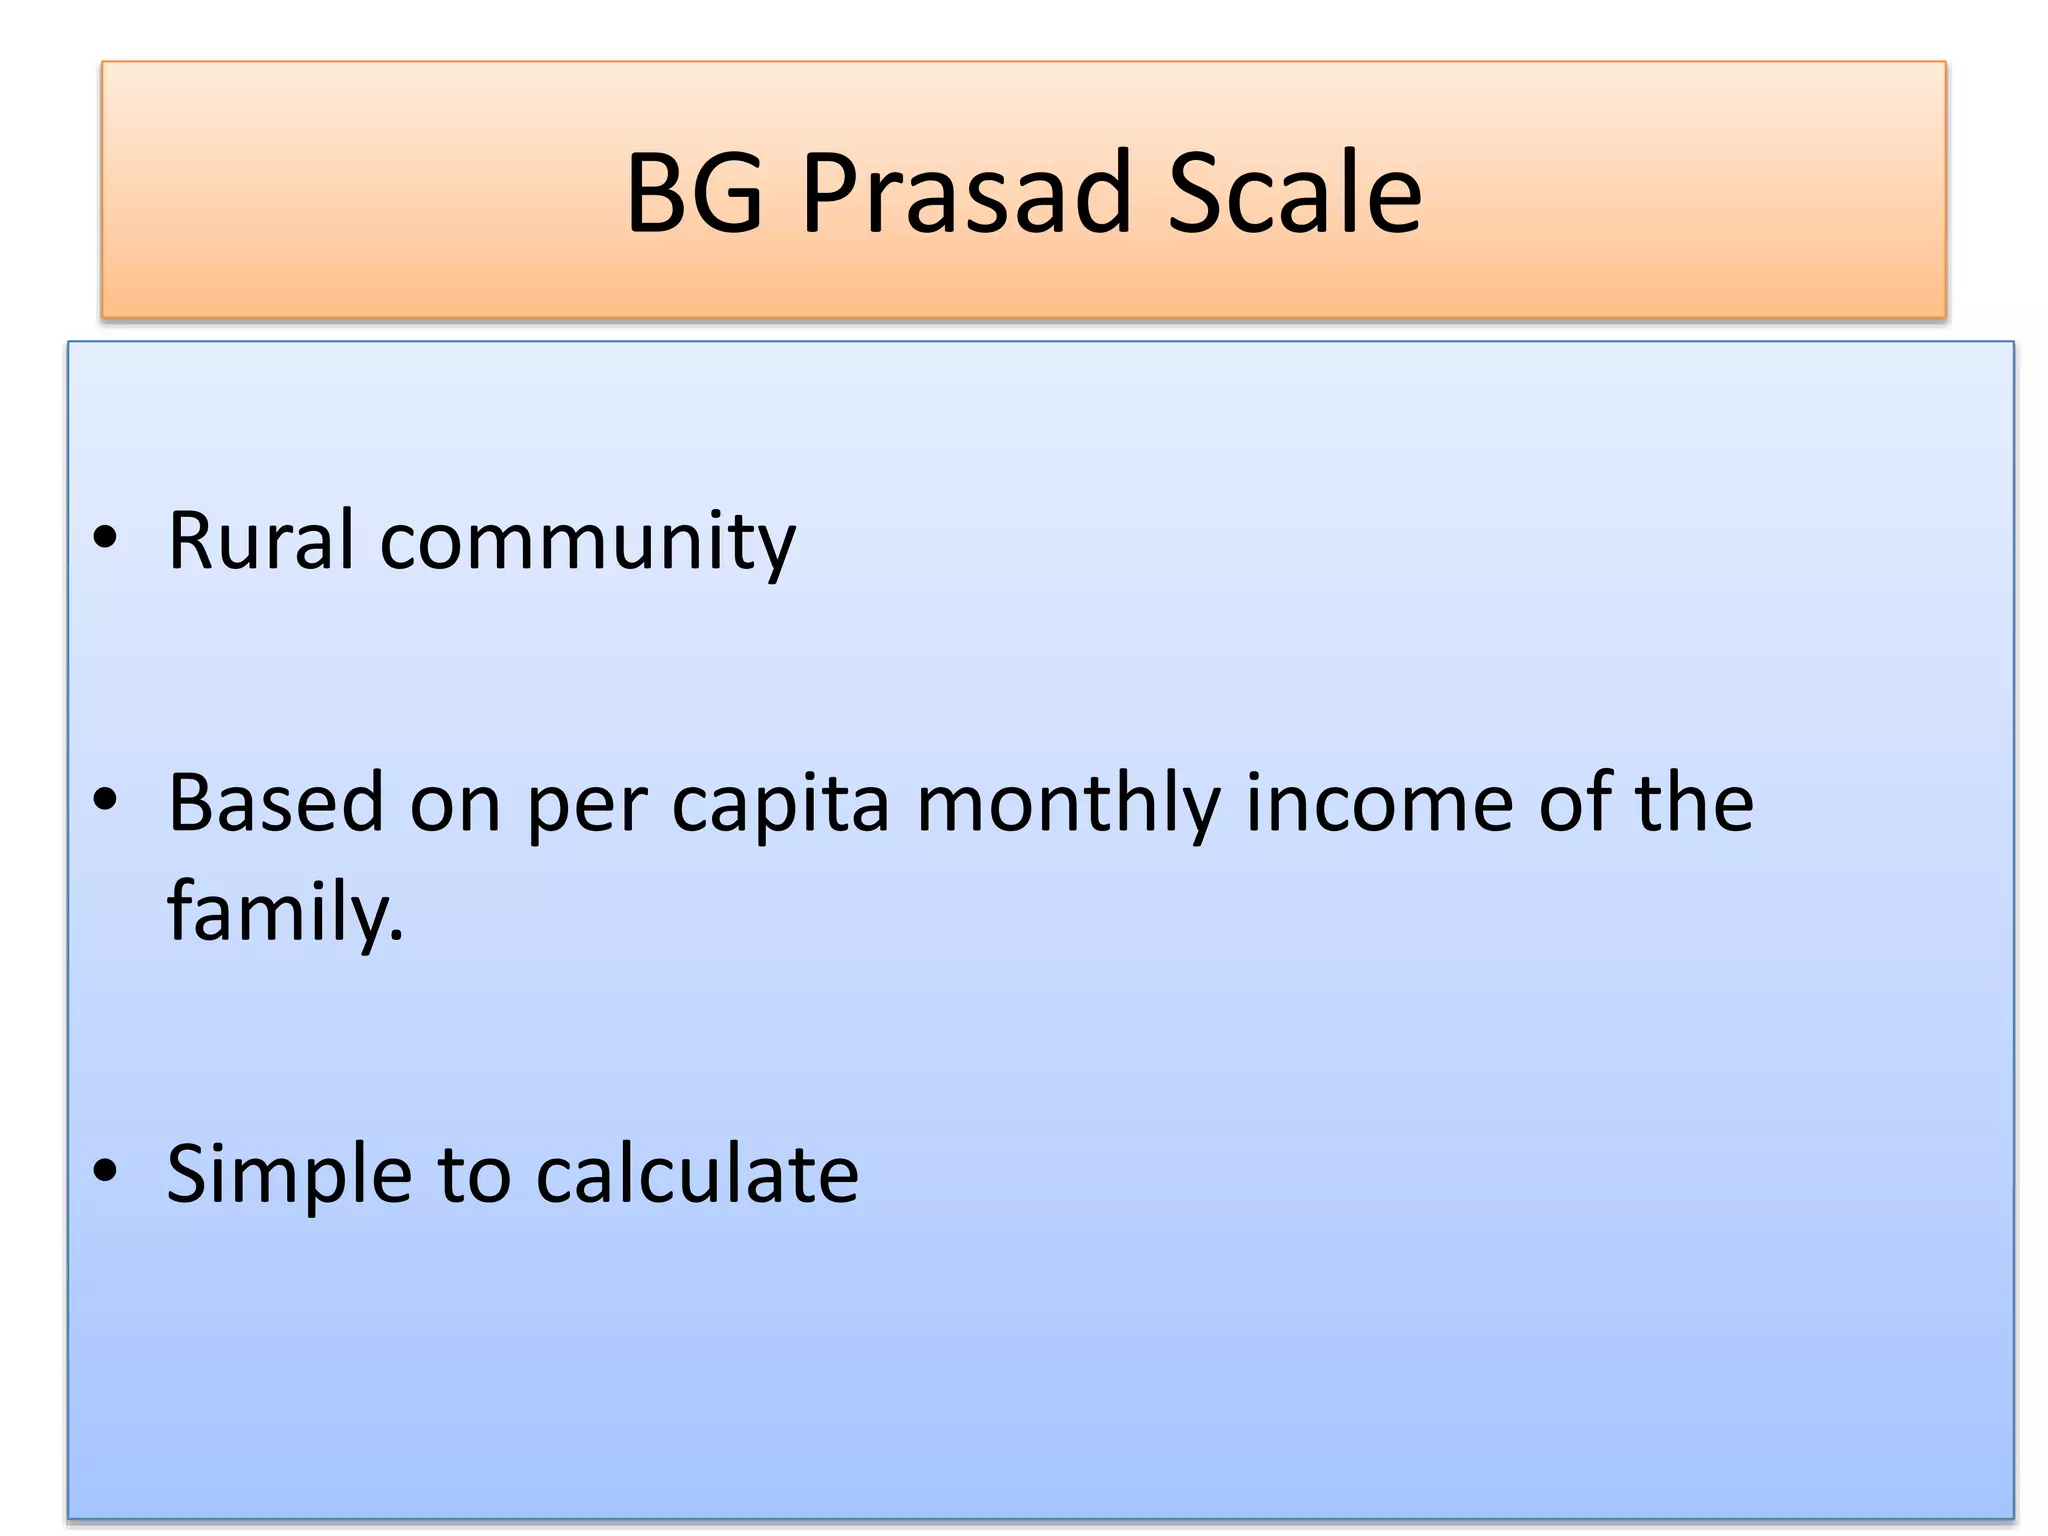

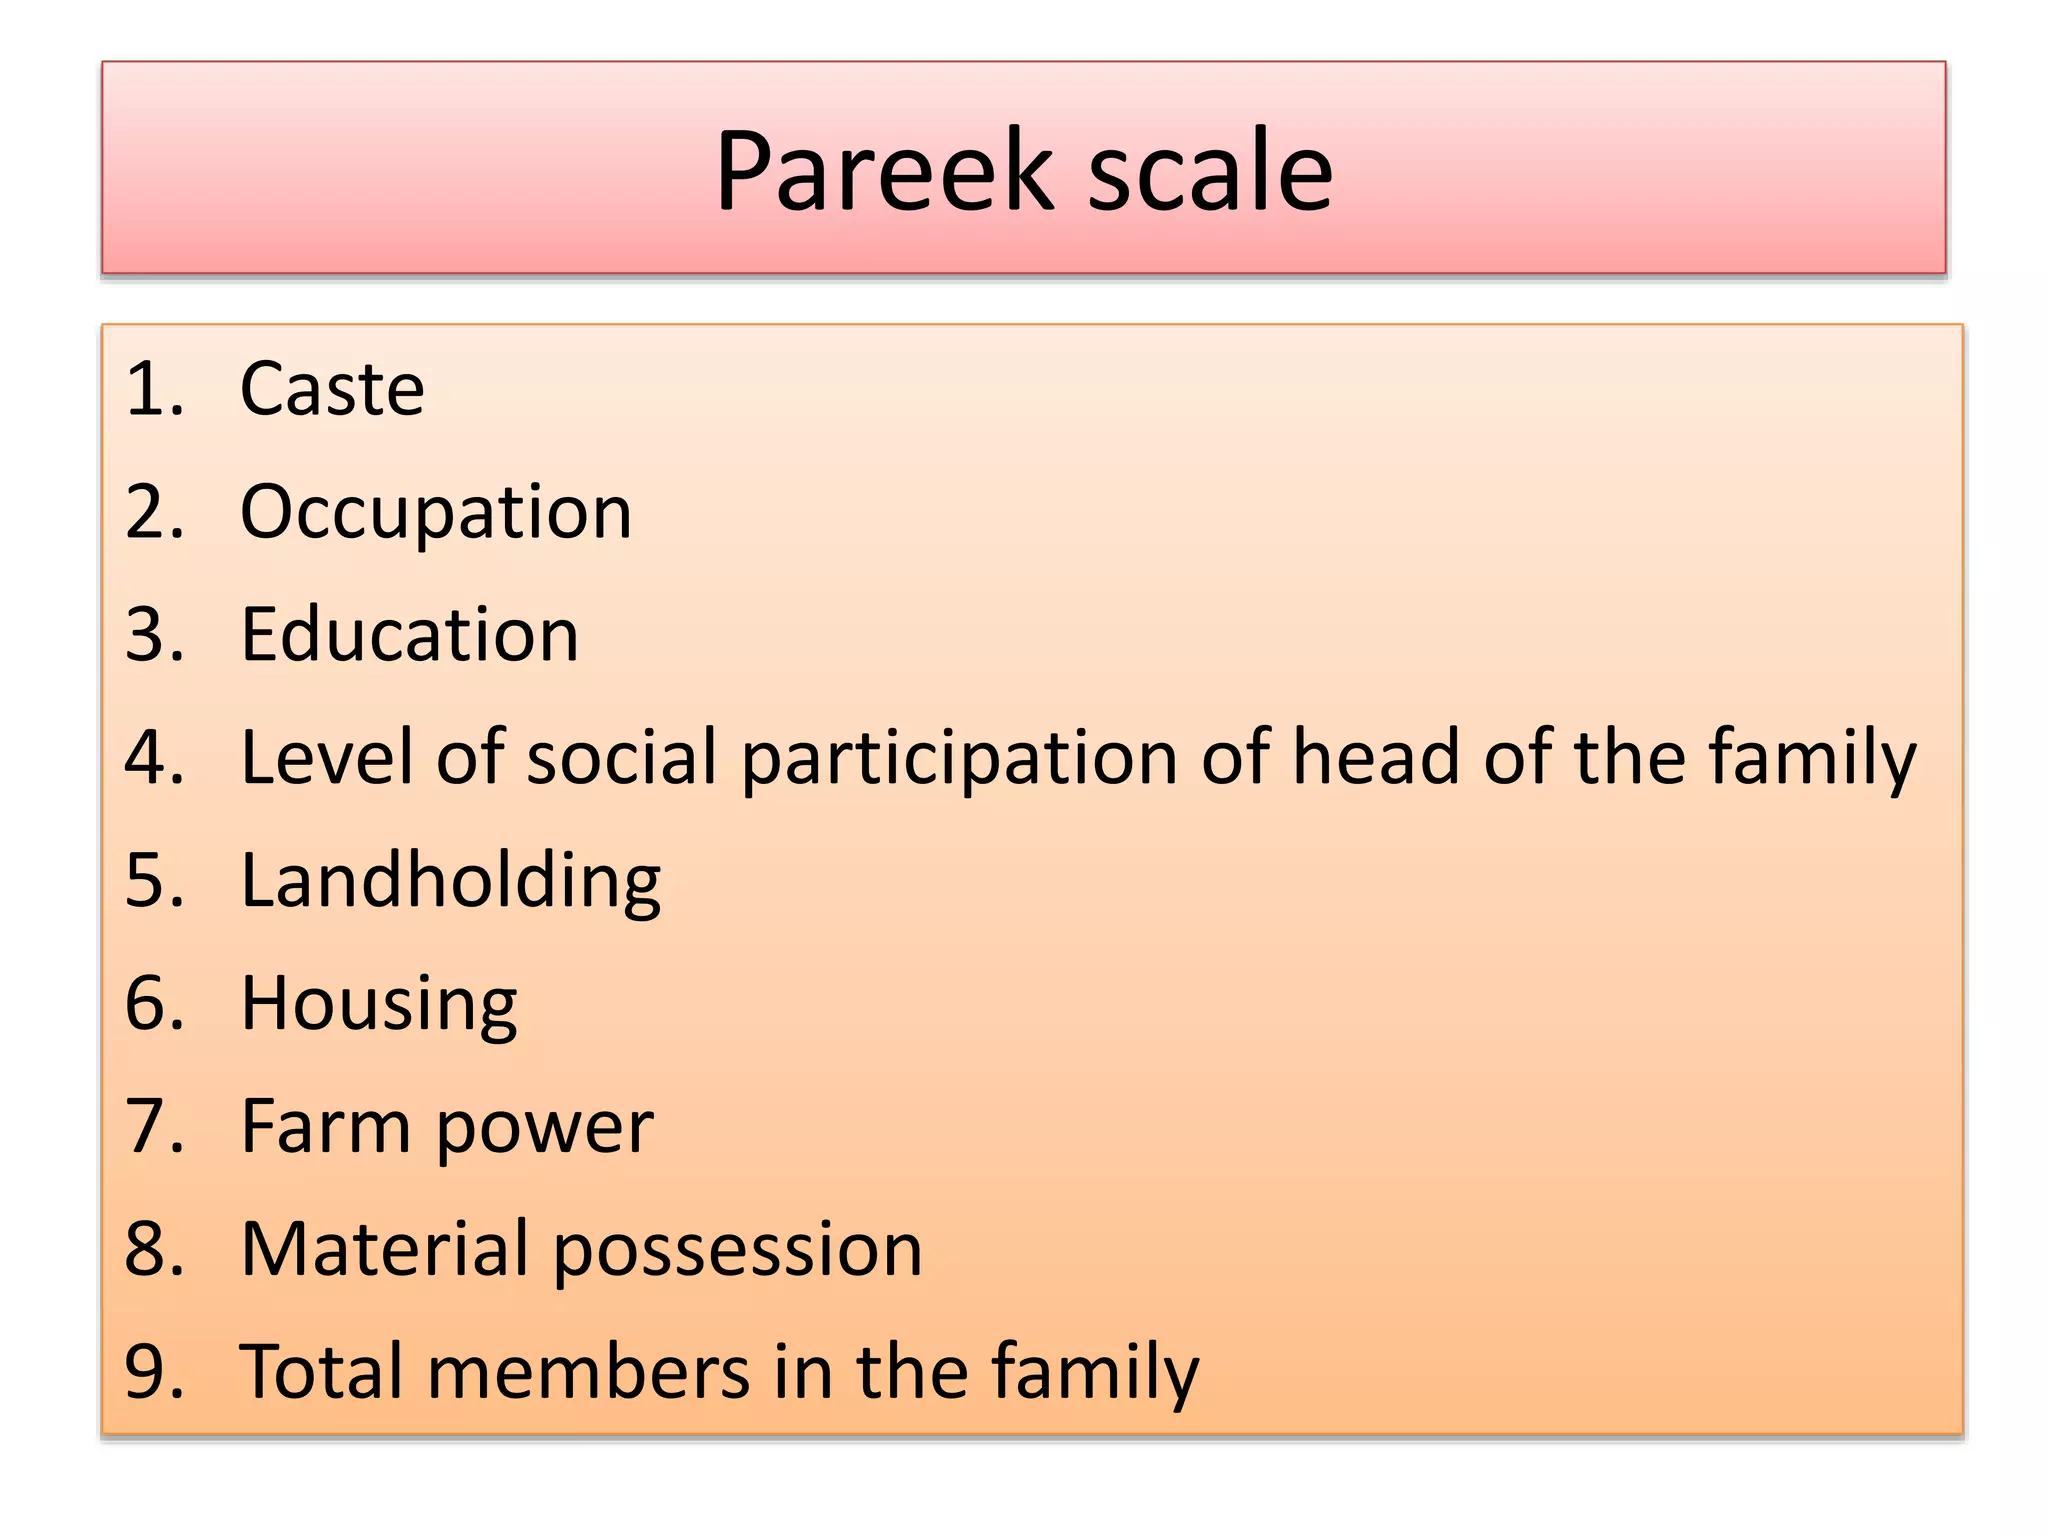
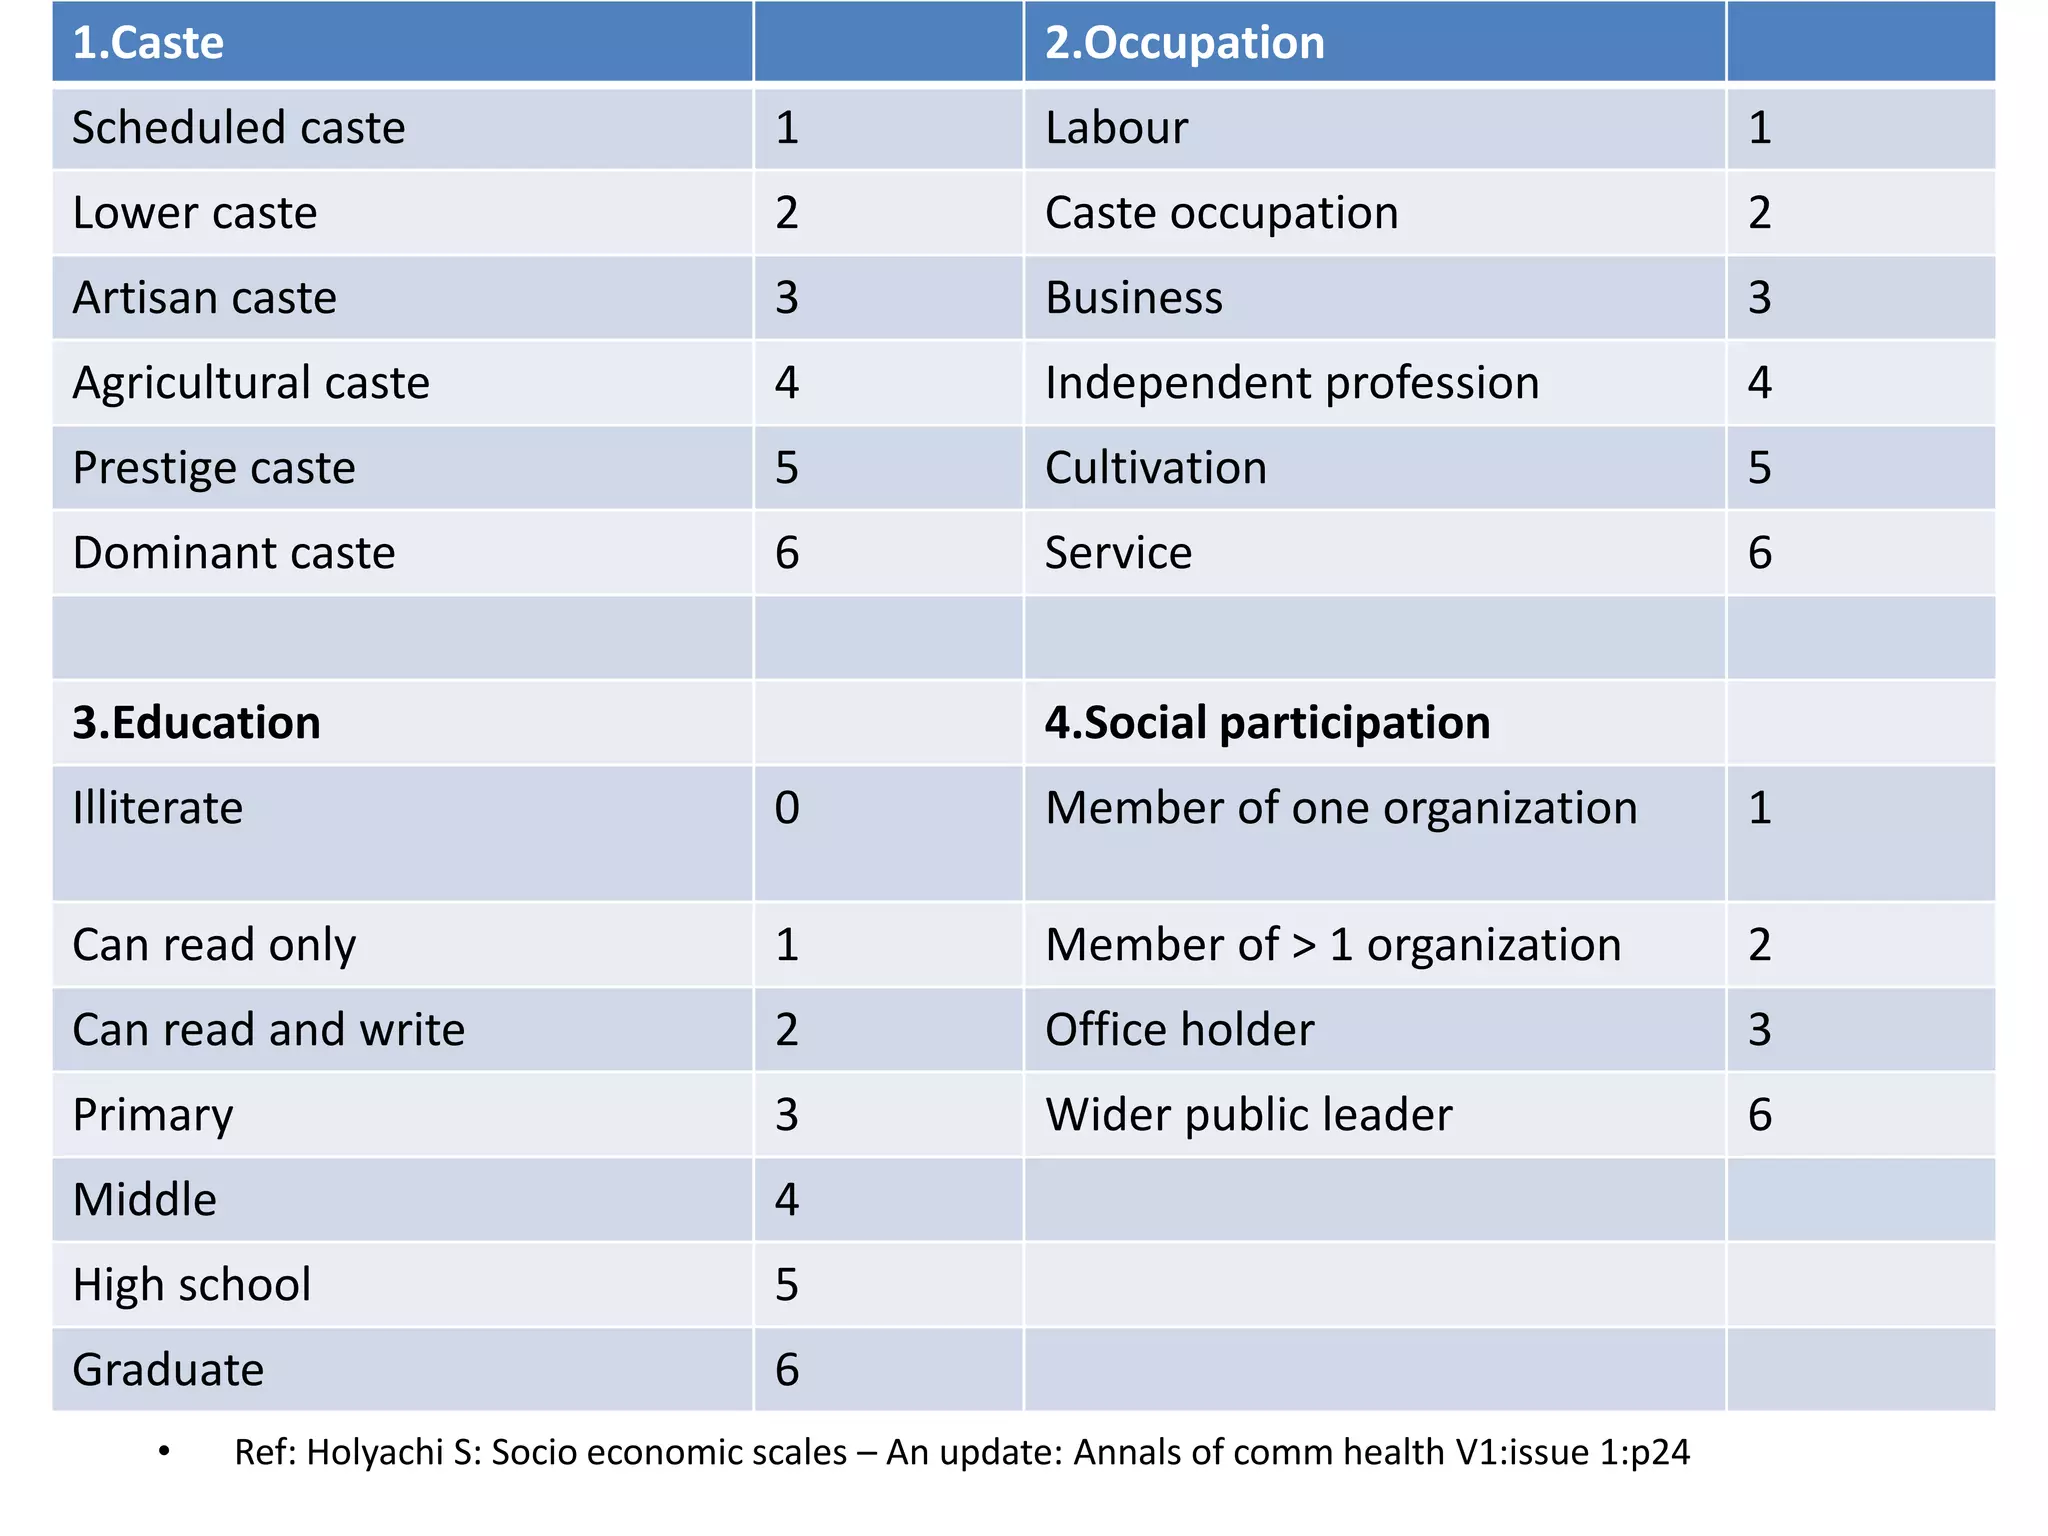
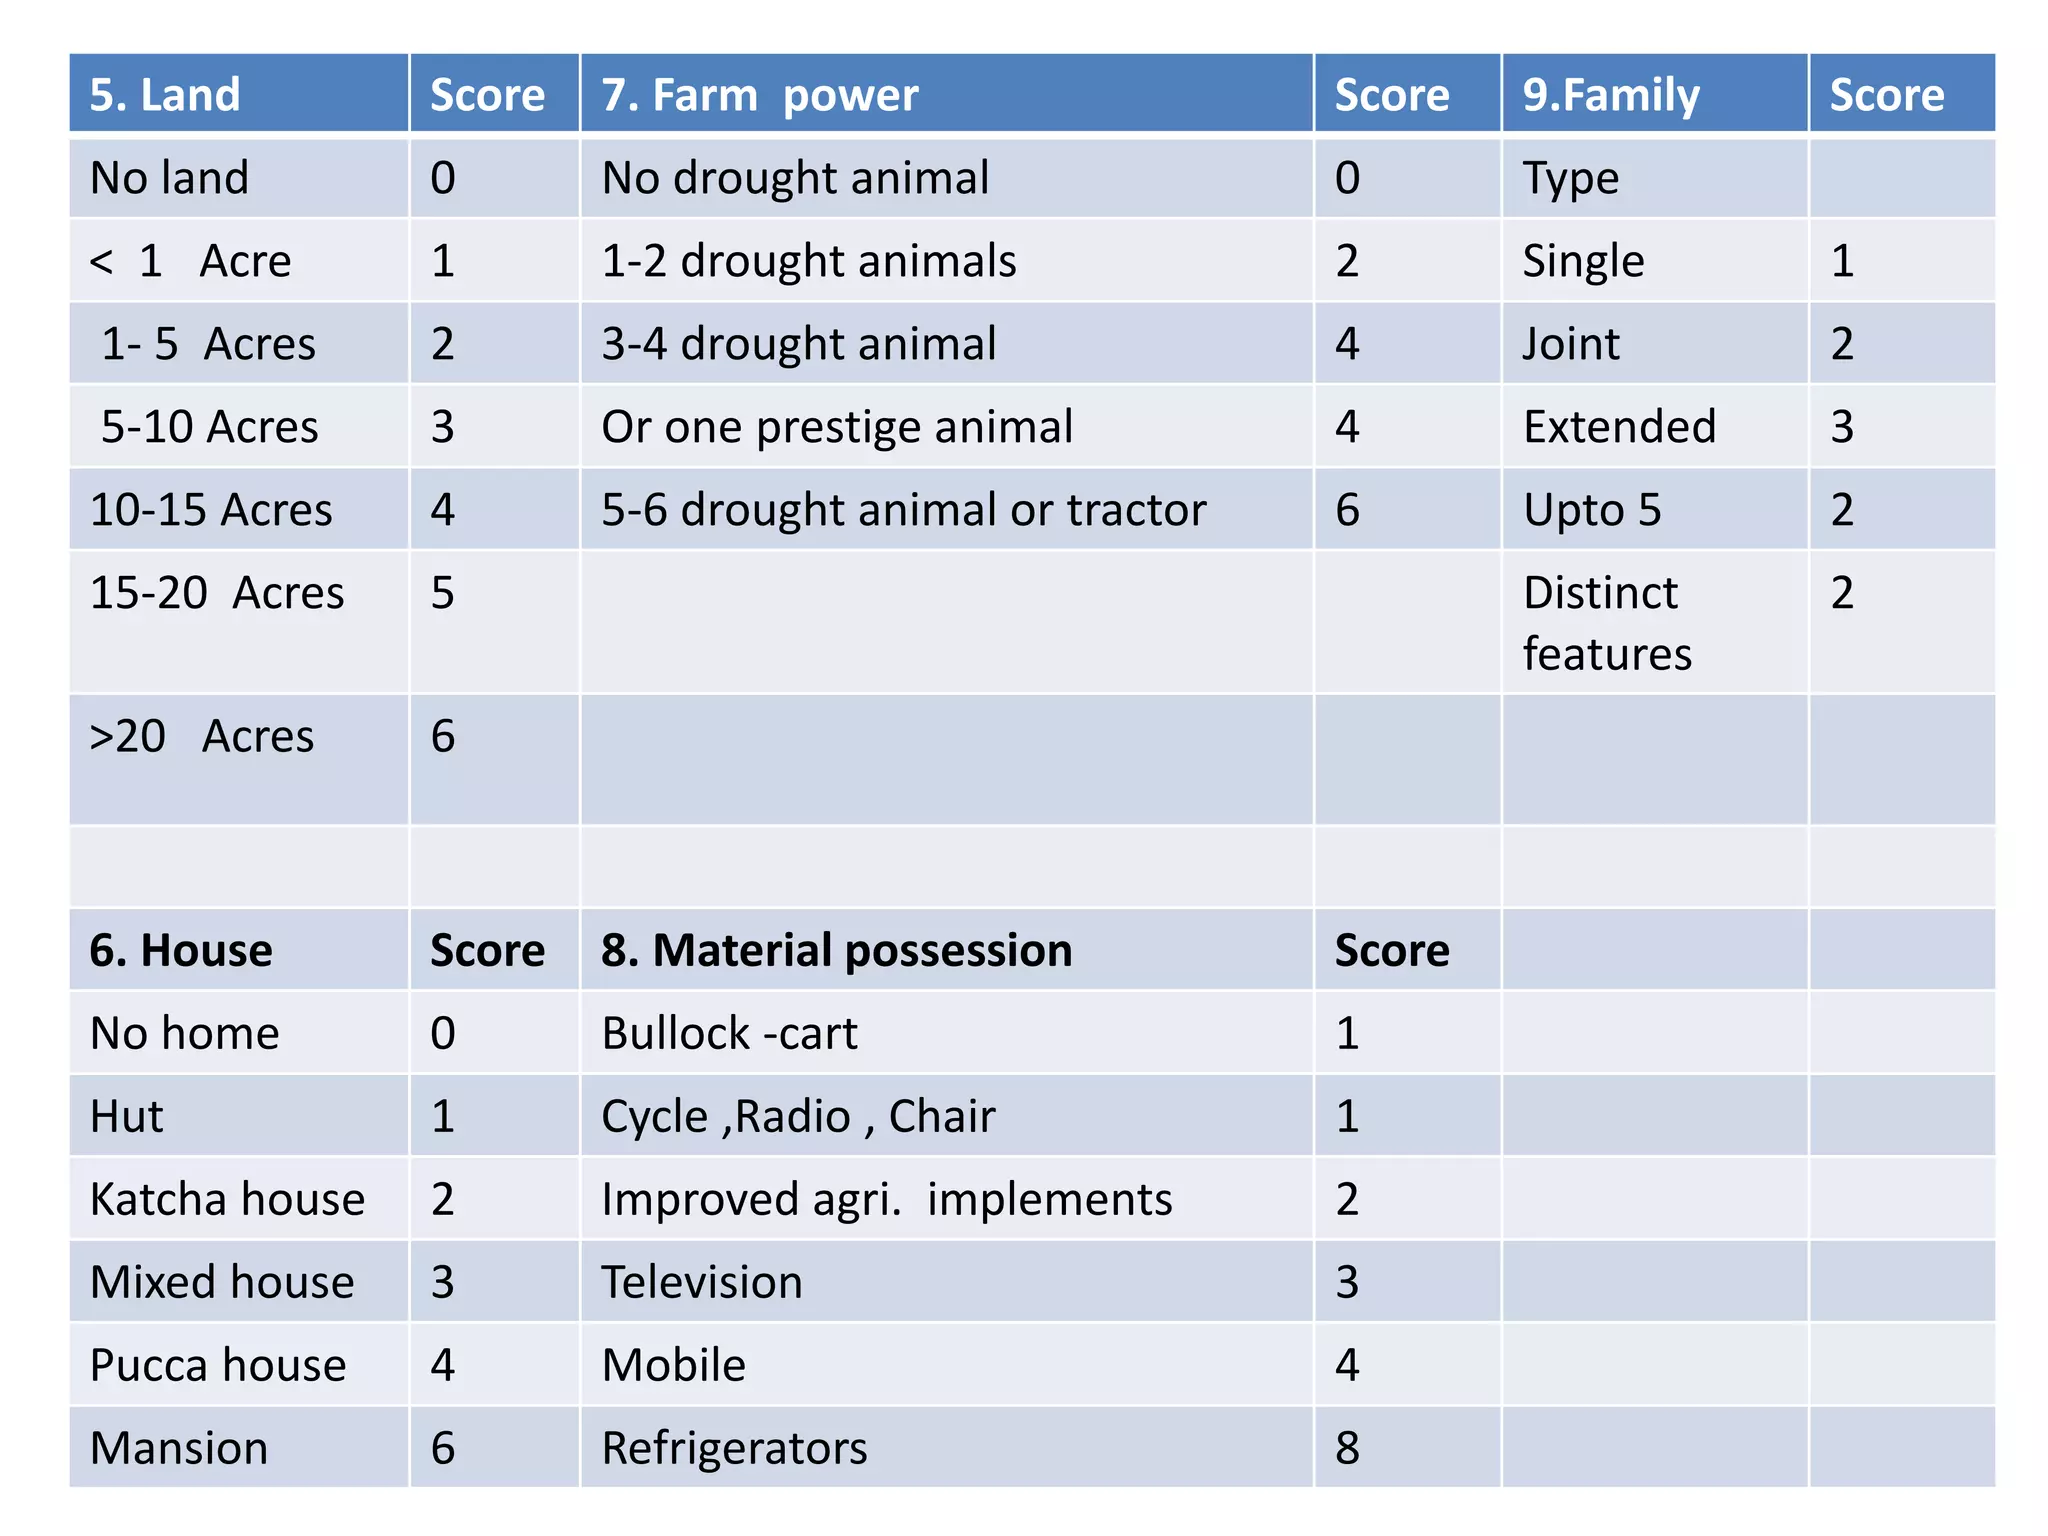
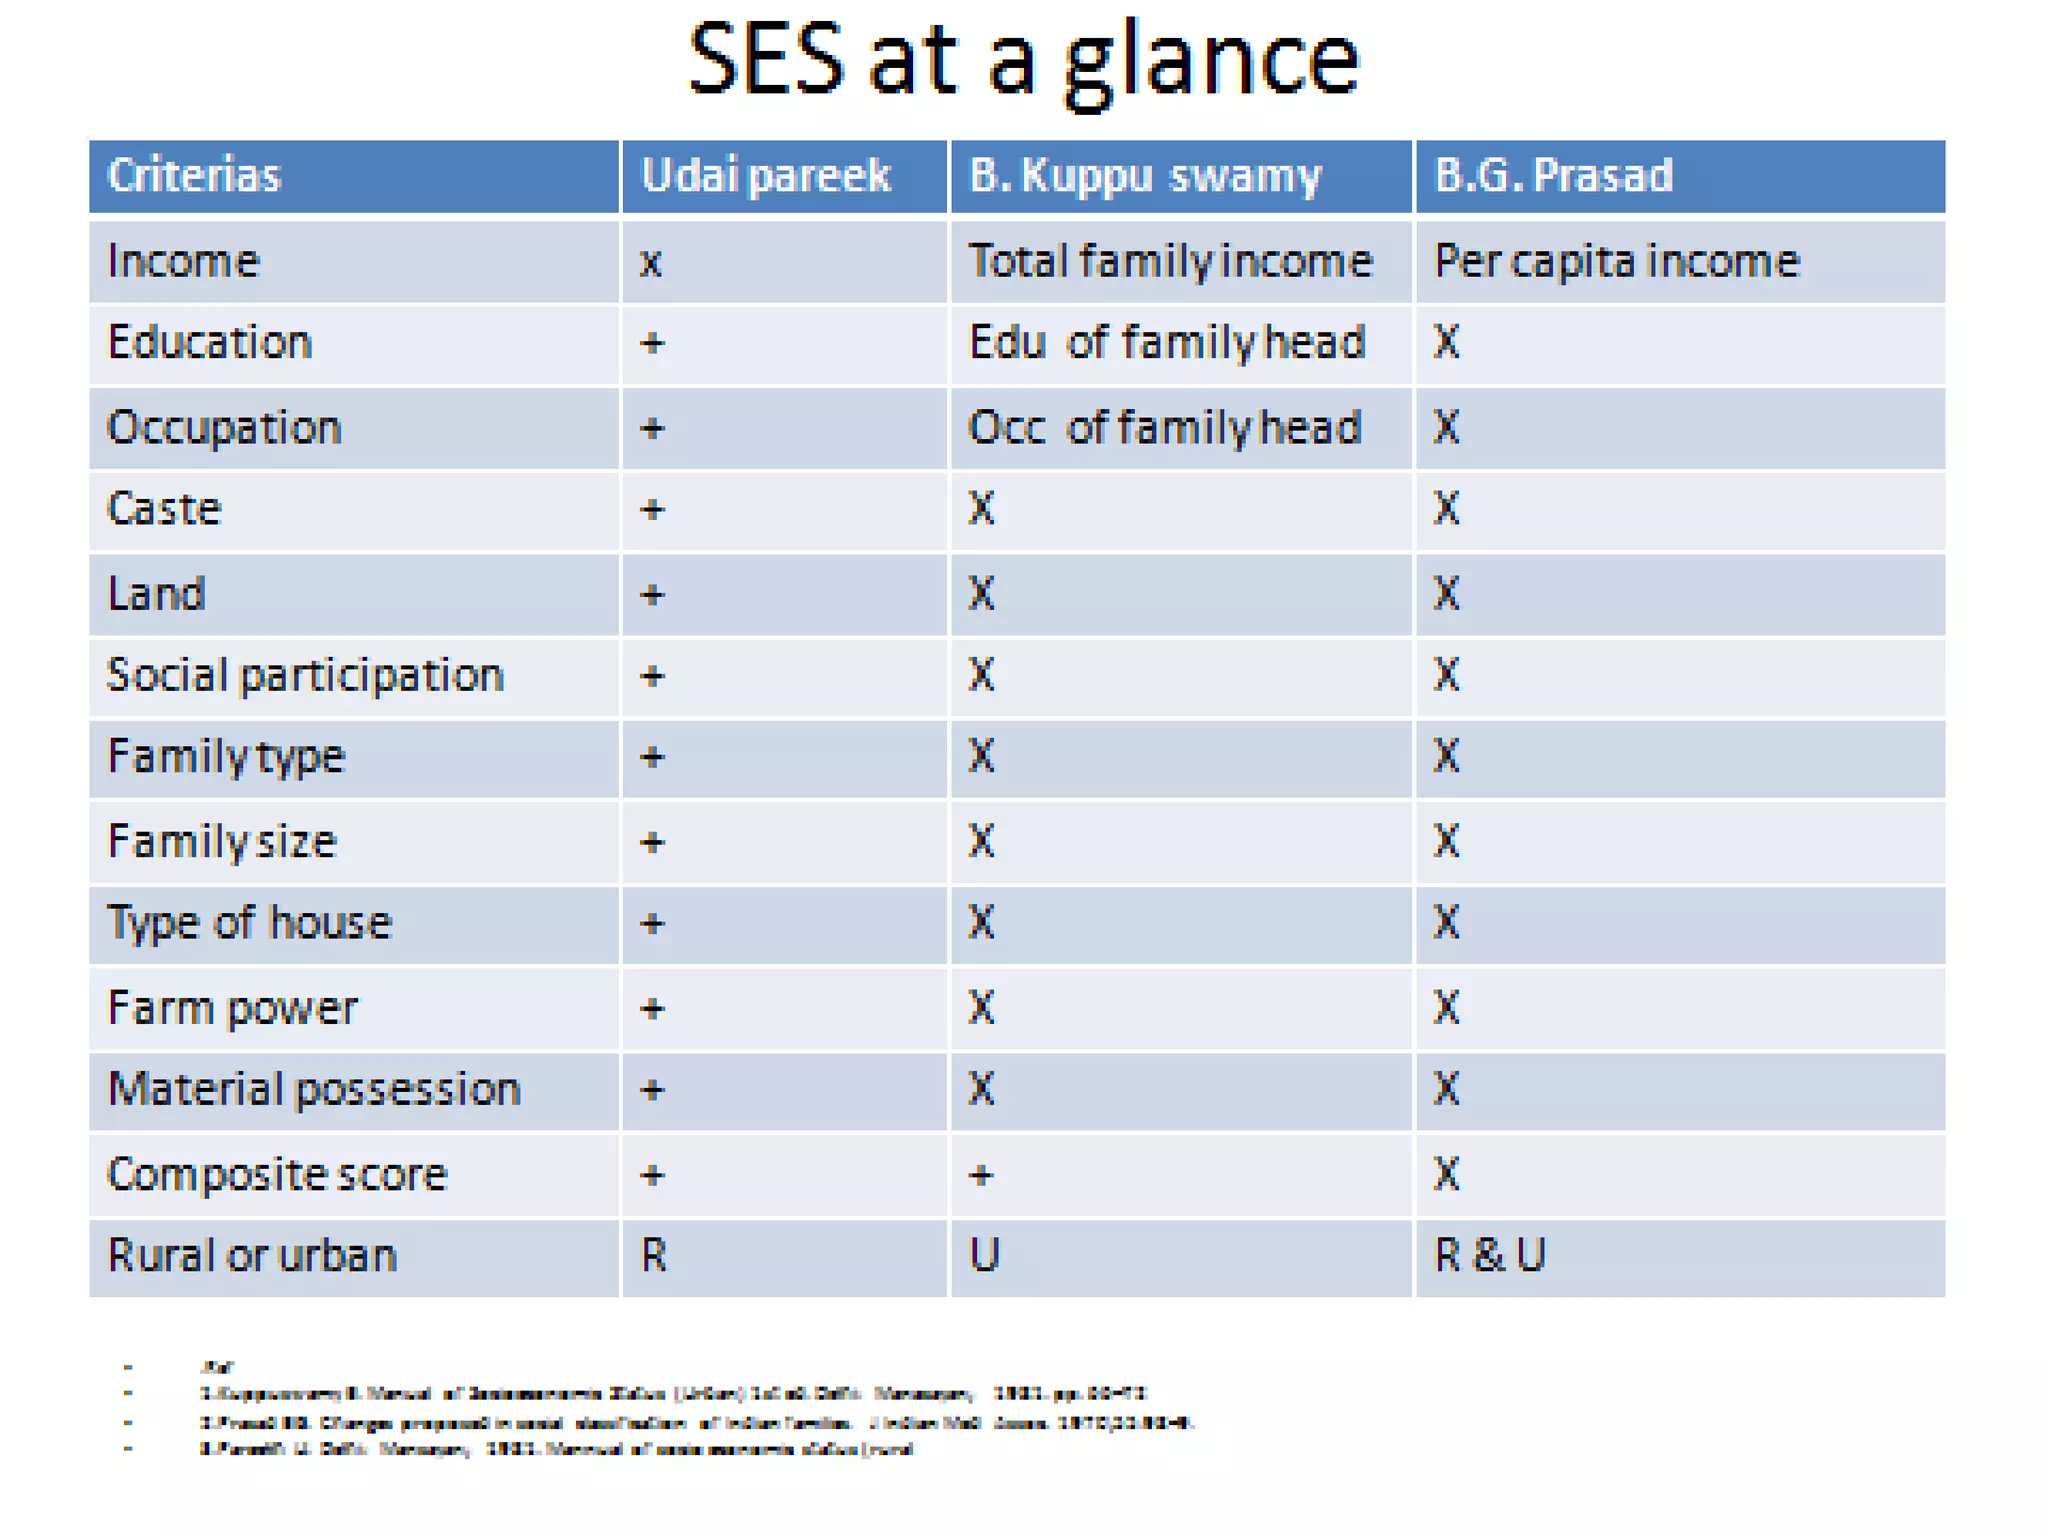
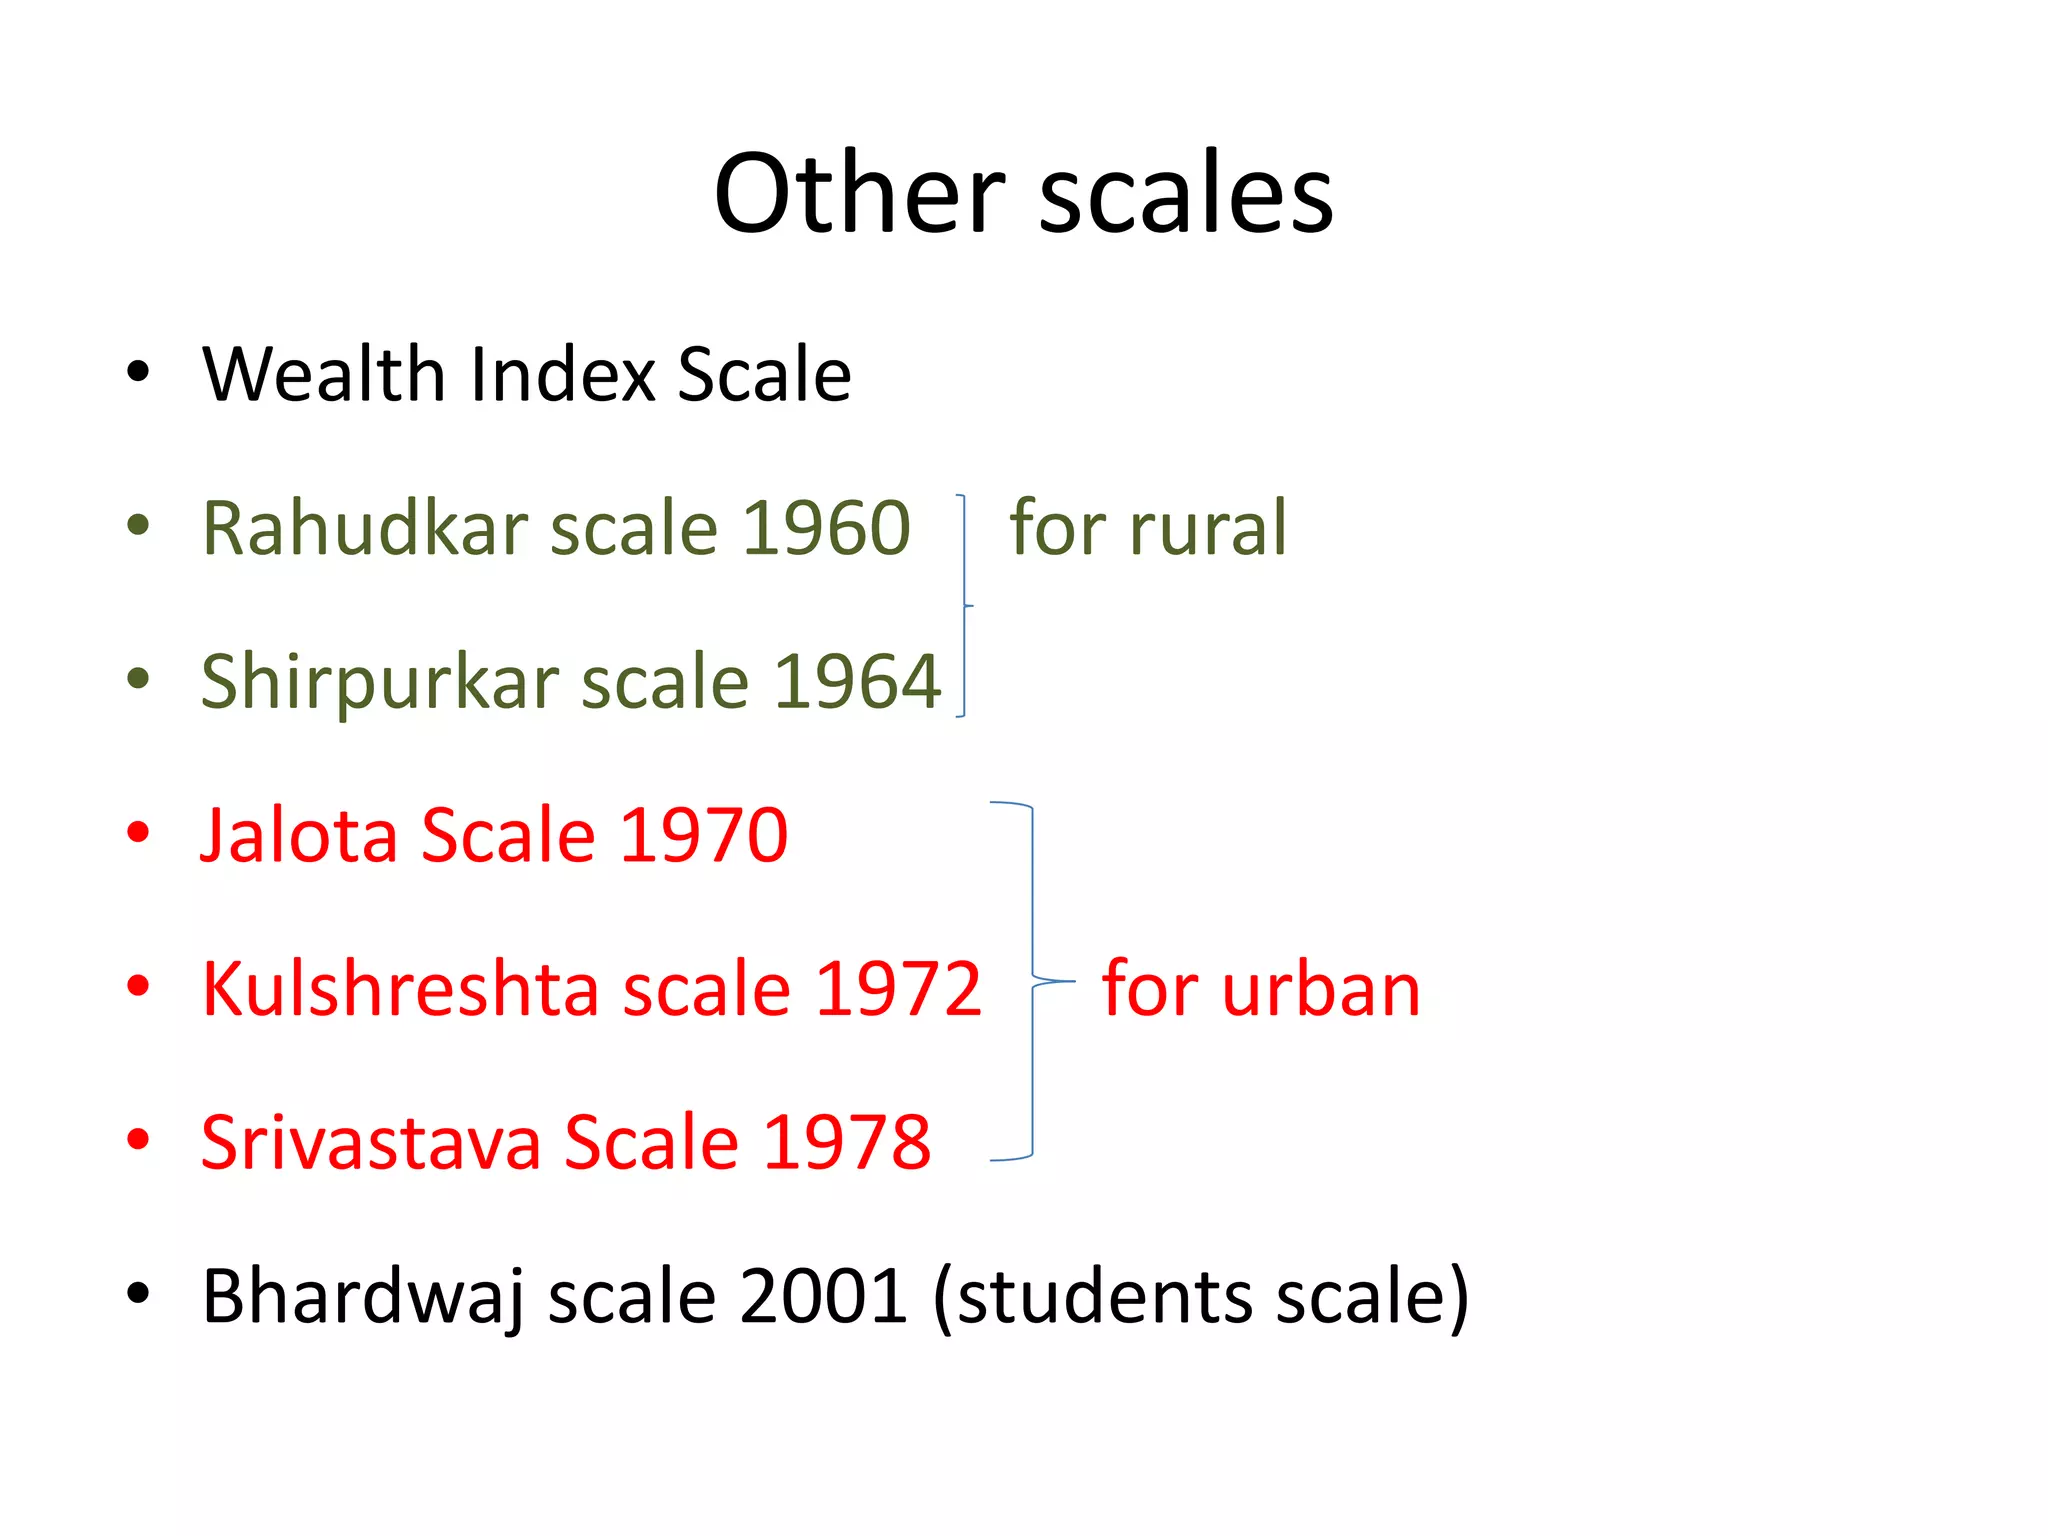
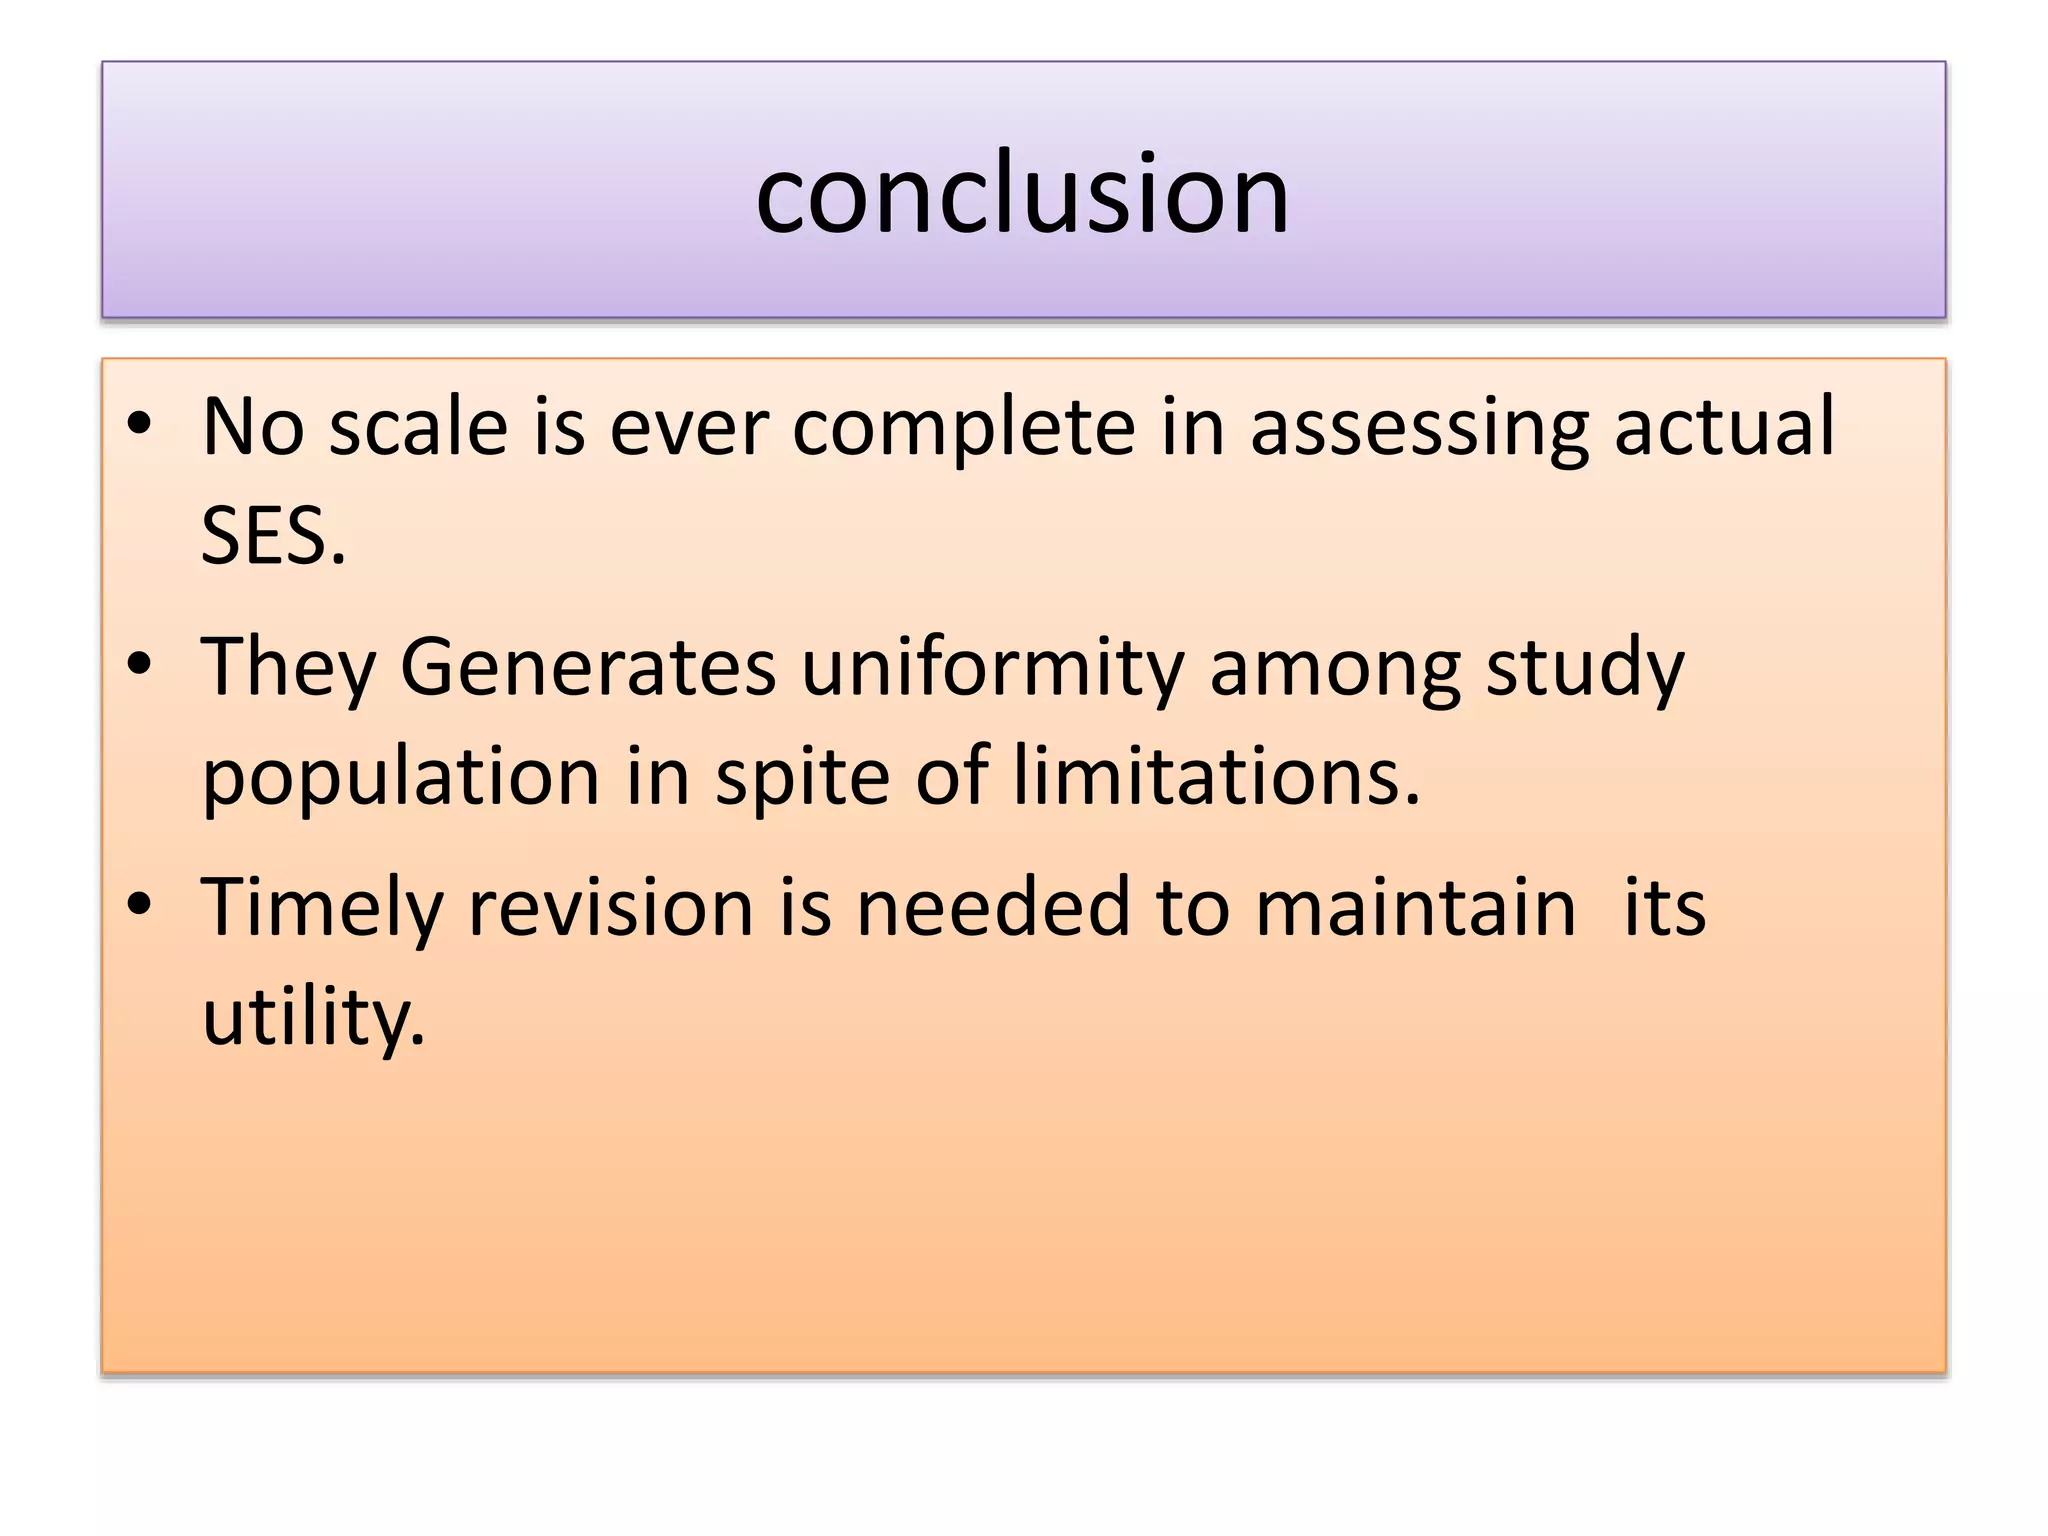


This document discusses various socioeconomic status (SES) scales used in India, including the Kuppuswamy scale, BG Prasad scale, and Pareek scale. It explains how each scale measures SES based on factors like education, occupation, income, and provides updated income thresholds based on the 2020 Consumer Price Index. The limitations of the Kuppuswamy scale are discussed. The document concludes that while no SES scale is complete, they provide uniformity among study populations despite limitations, and timely revisions are needed to maintain their utility.


