This document discusses several key economic indicators that affect commodity prices, including:
- Consumer confidence index, consumer price index, employment reports, GDP, and retail sales which measure economic activity and consumer spending.
- FOMC meetings and interest rate announcements which can impact inflation and currency valuations.
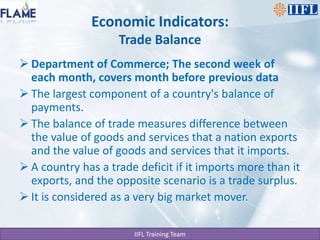
- Trade balance, current account, and durable goods orders which provide insights into international trade trends.
- Housing starts and industrial production which track business investment and manufacturing activity.
These economic indicators are closely watched globally as they can signal changes in commodity demand and supply.