Download as PDF, PPTX


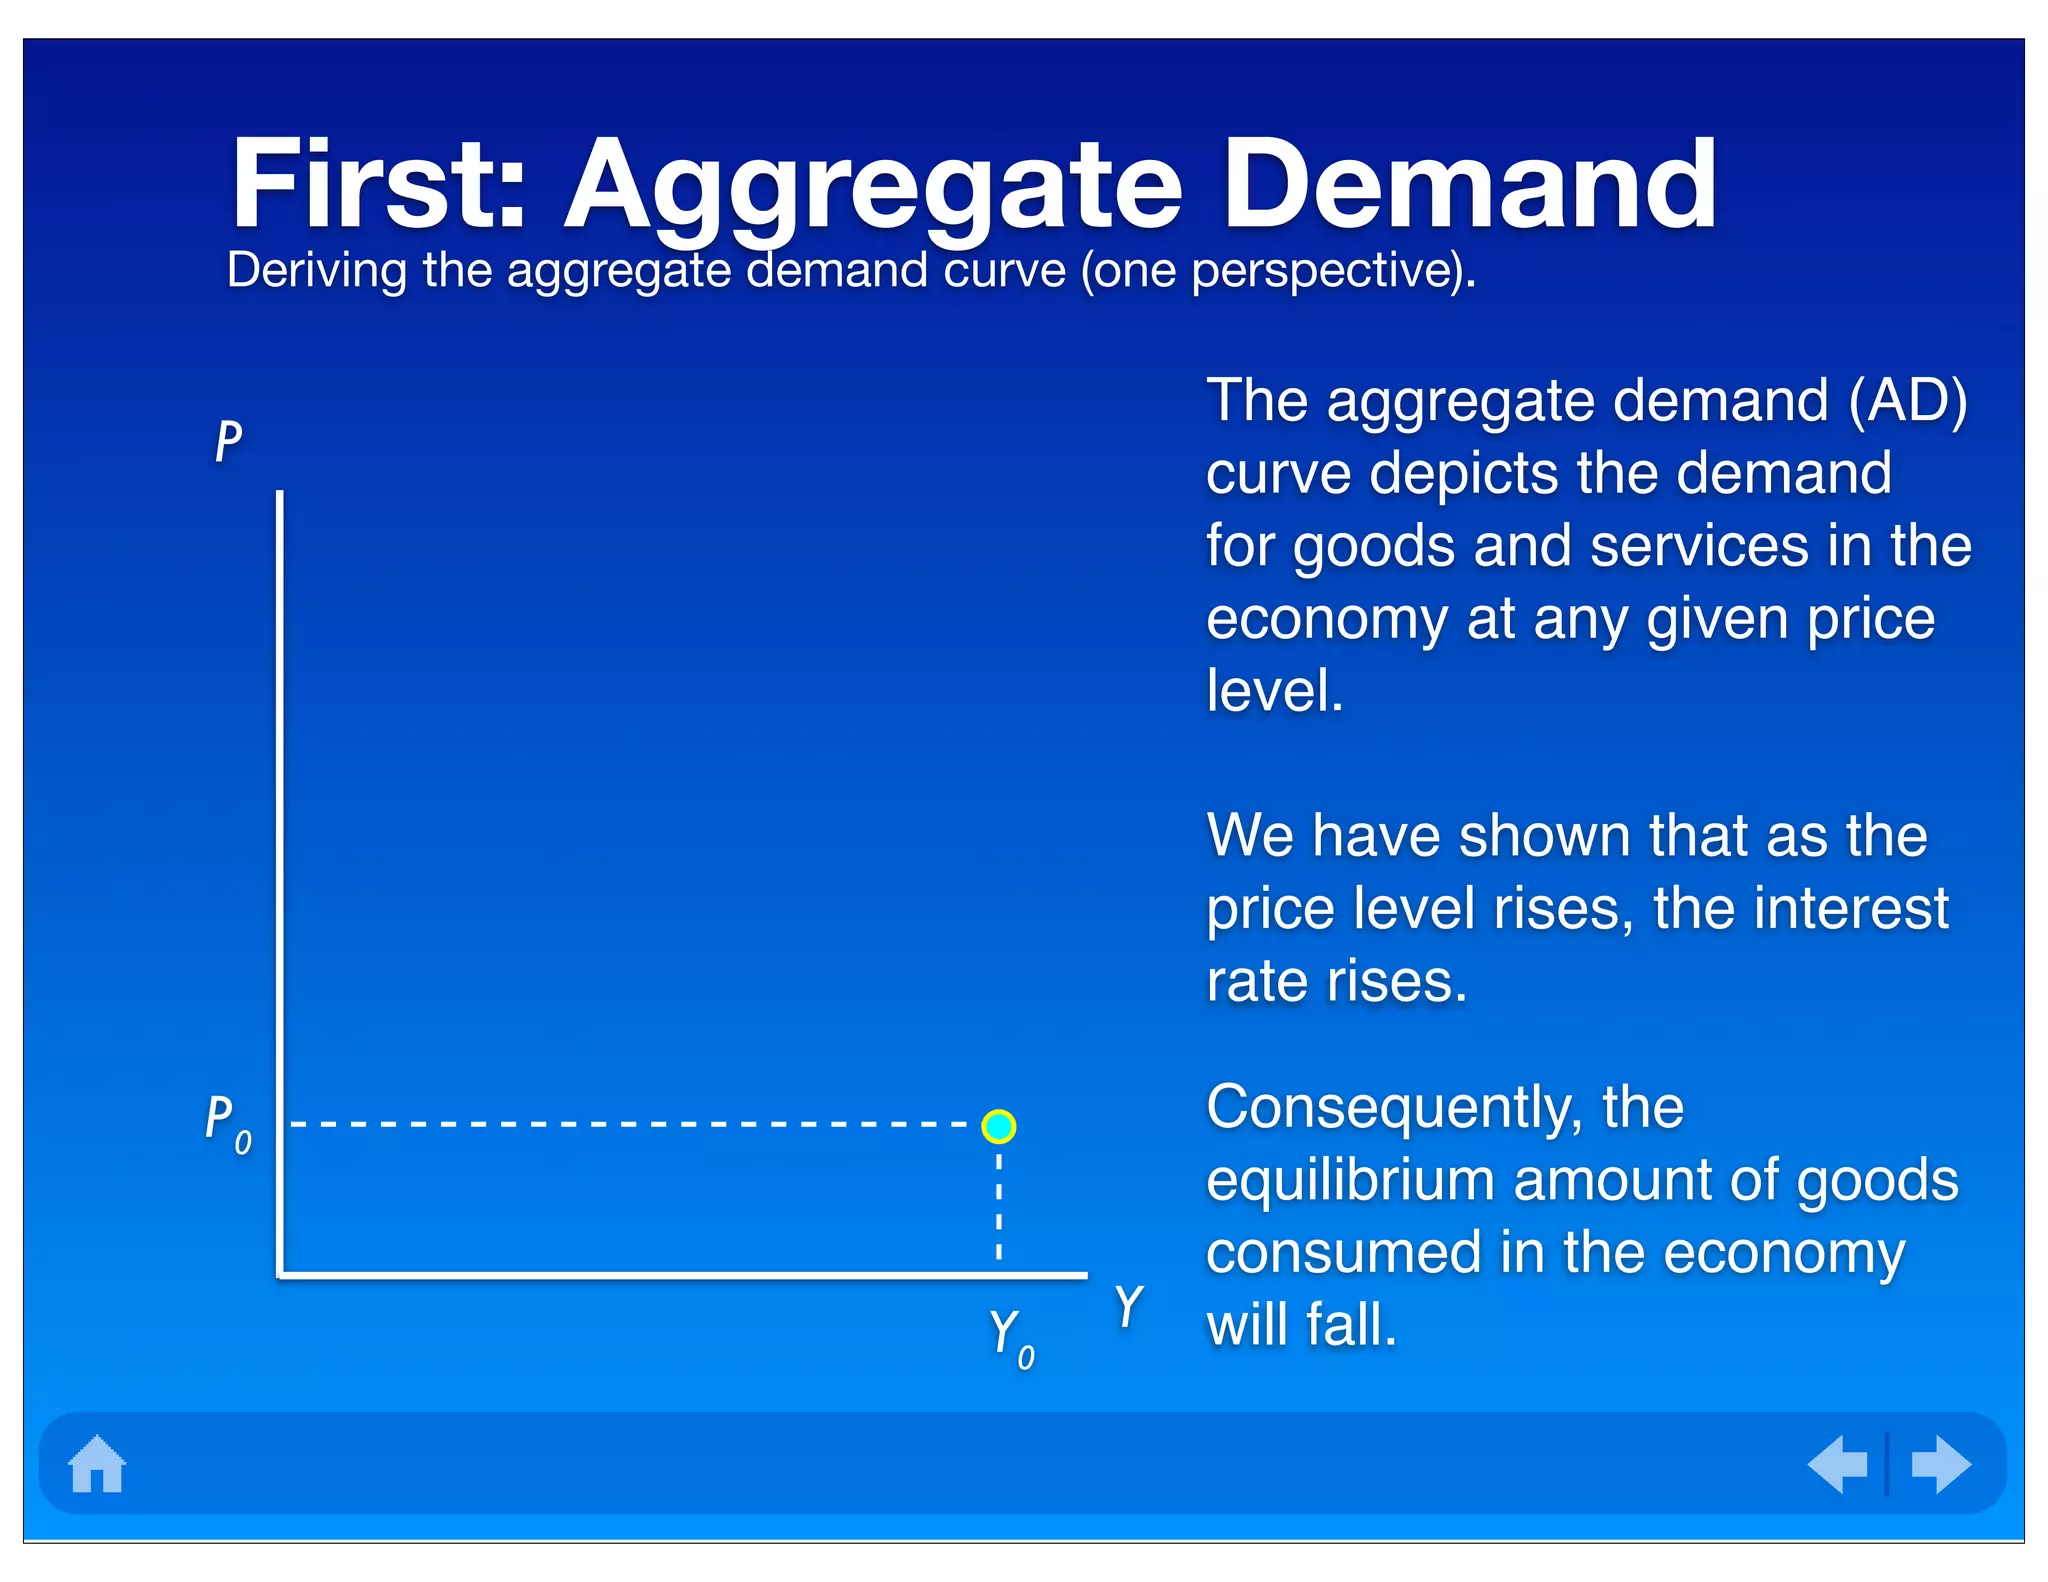
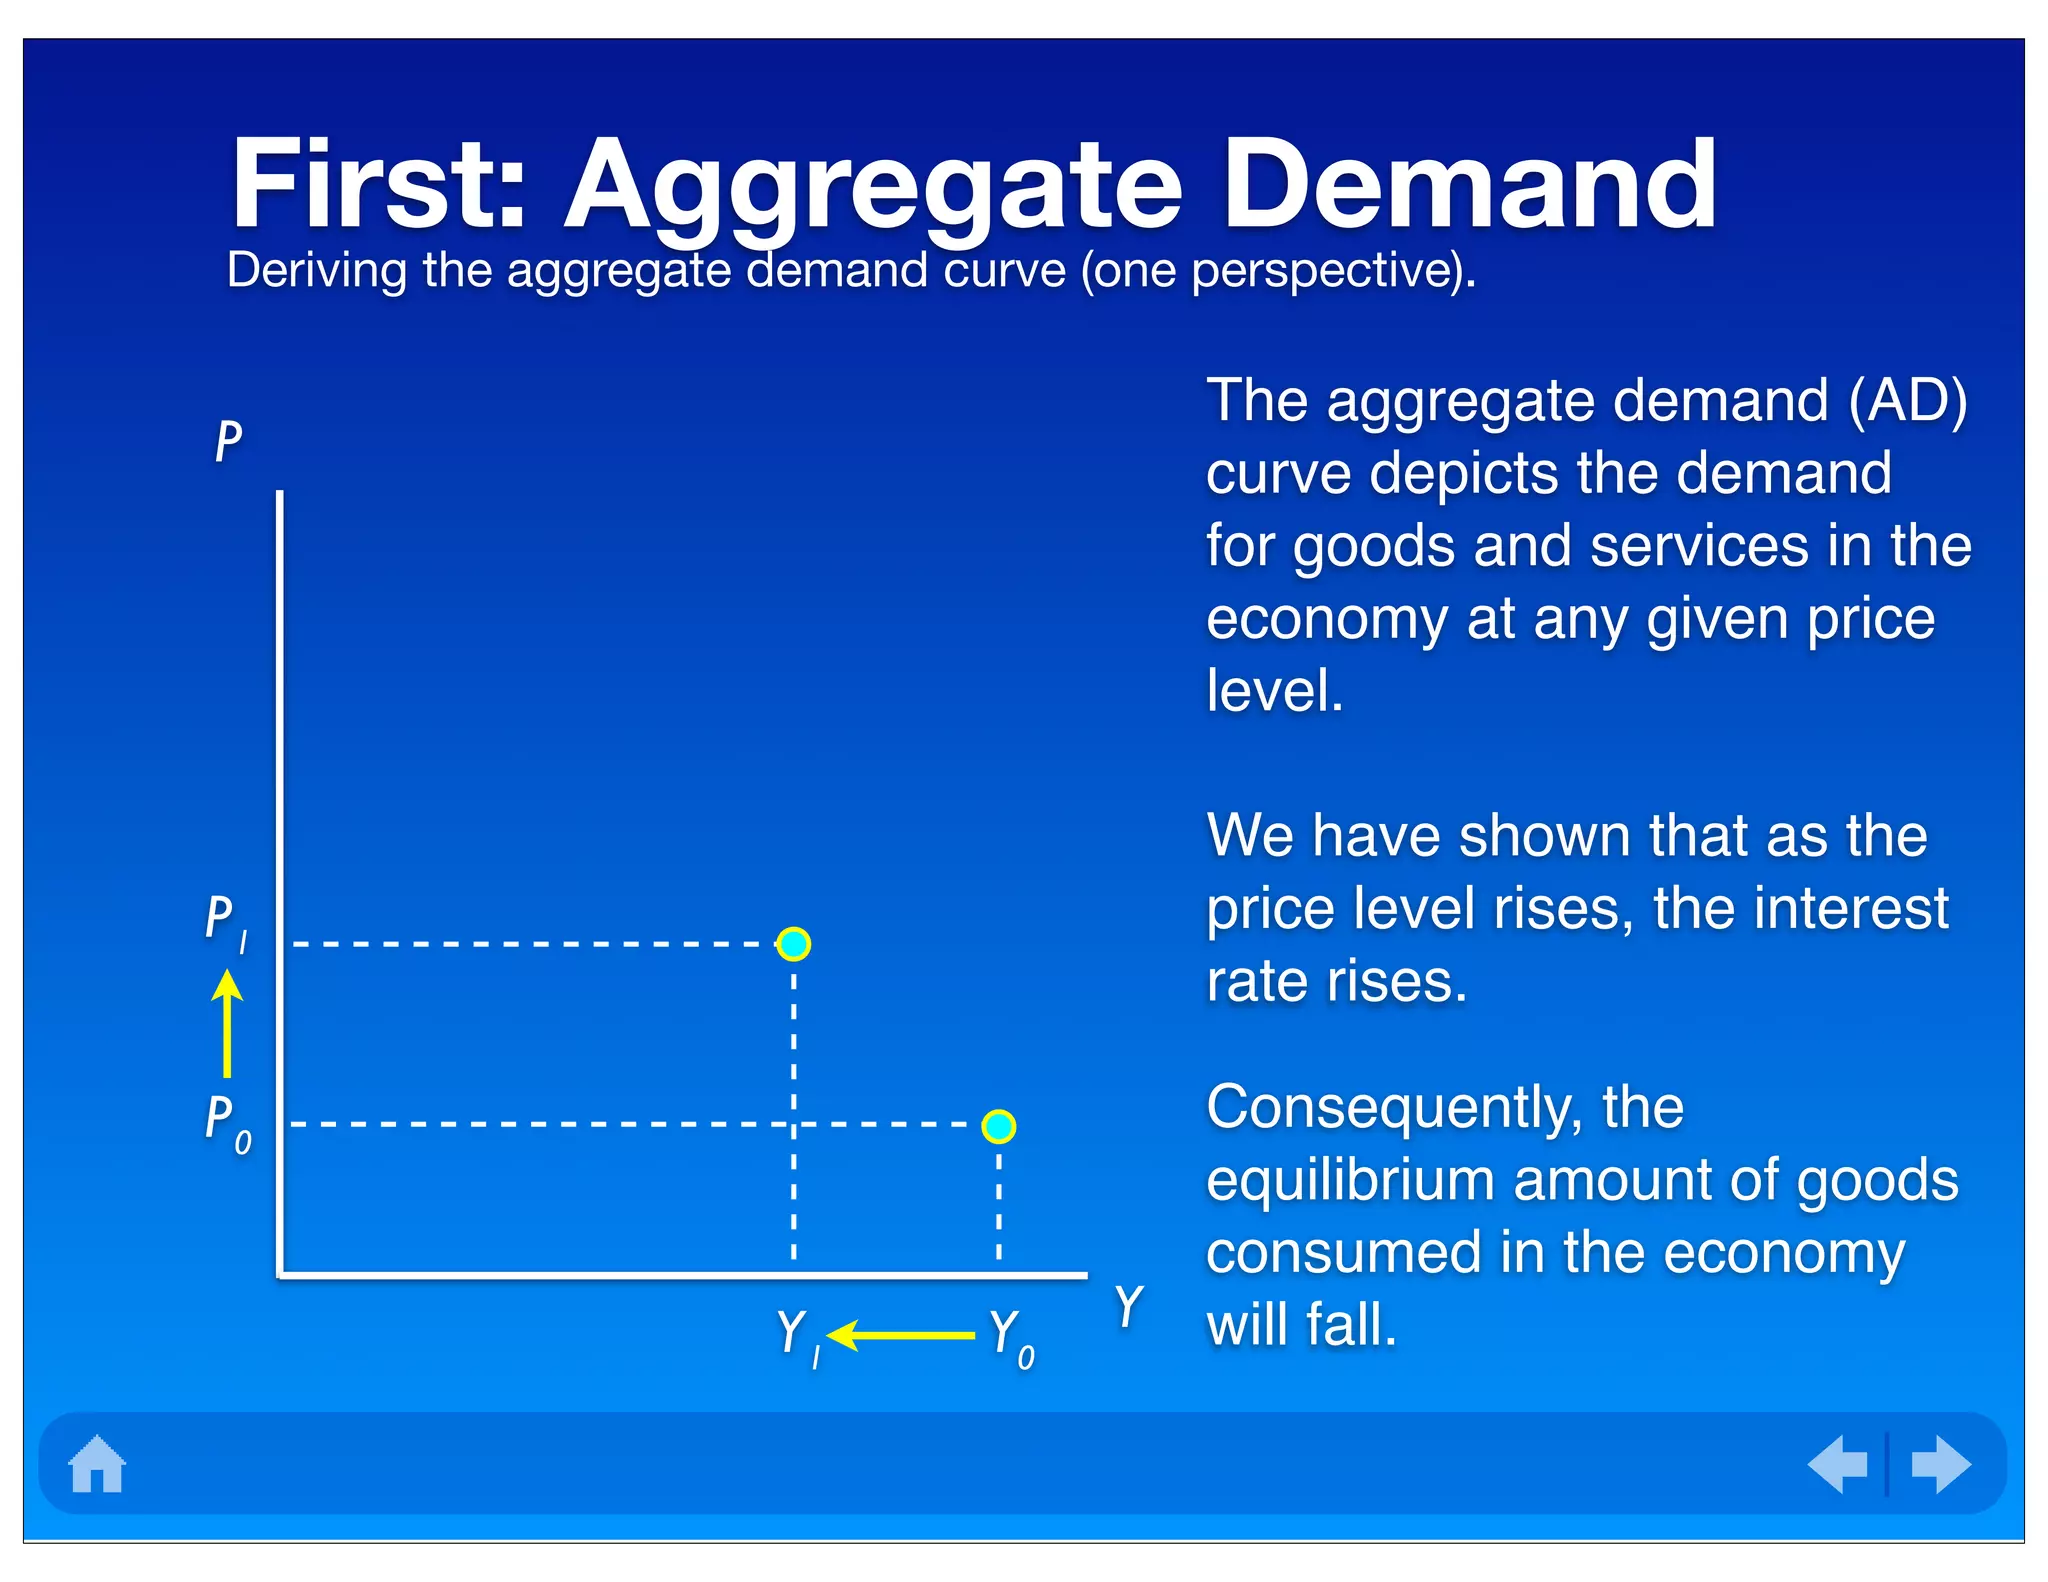
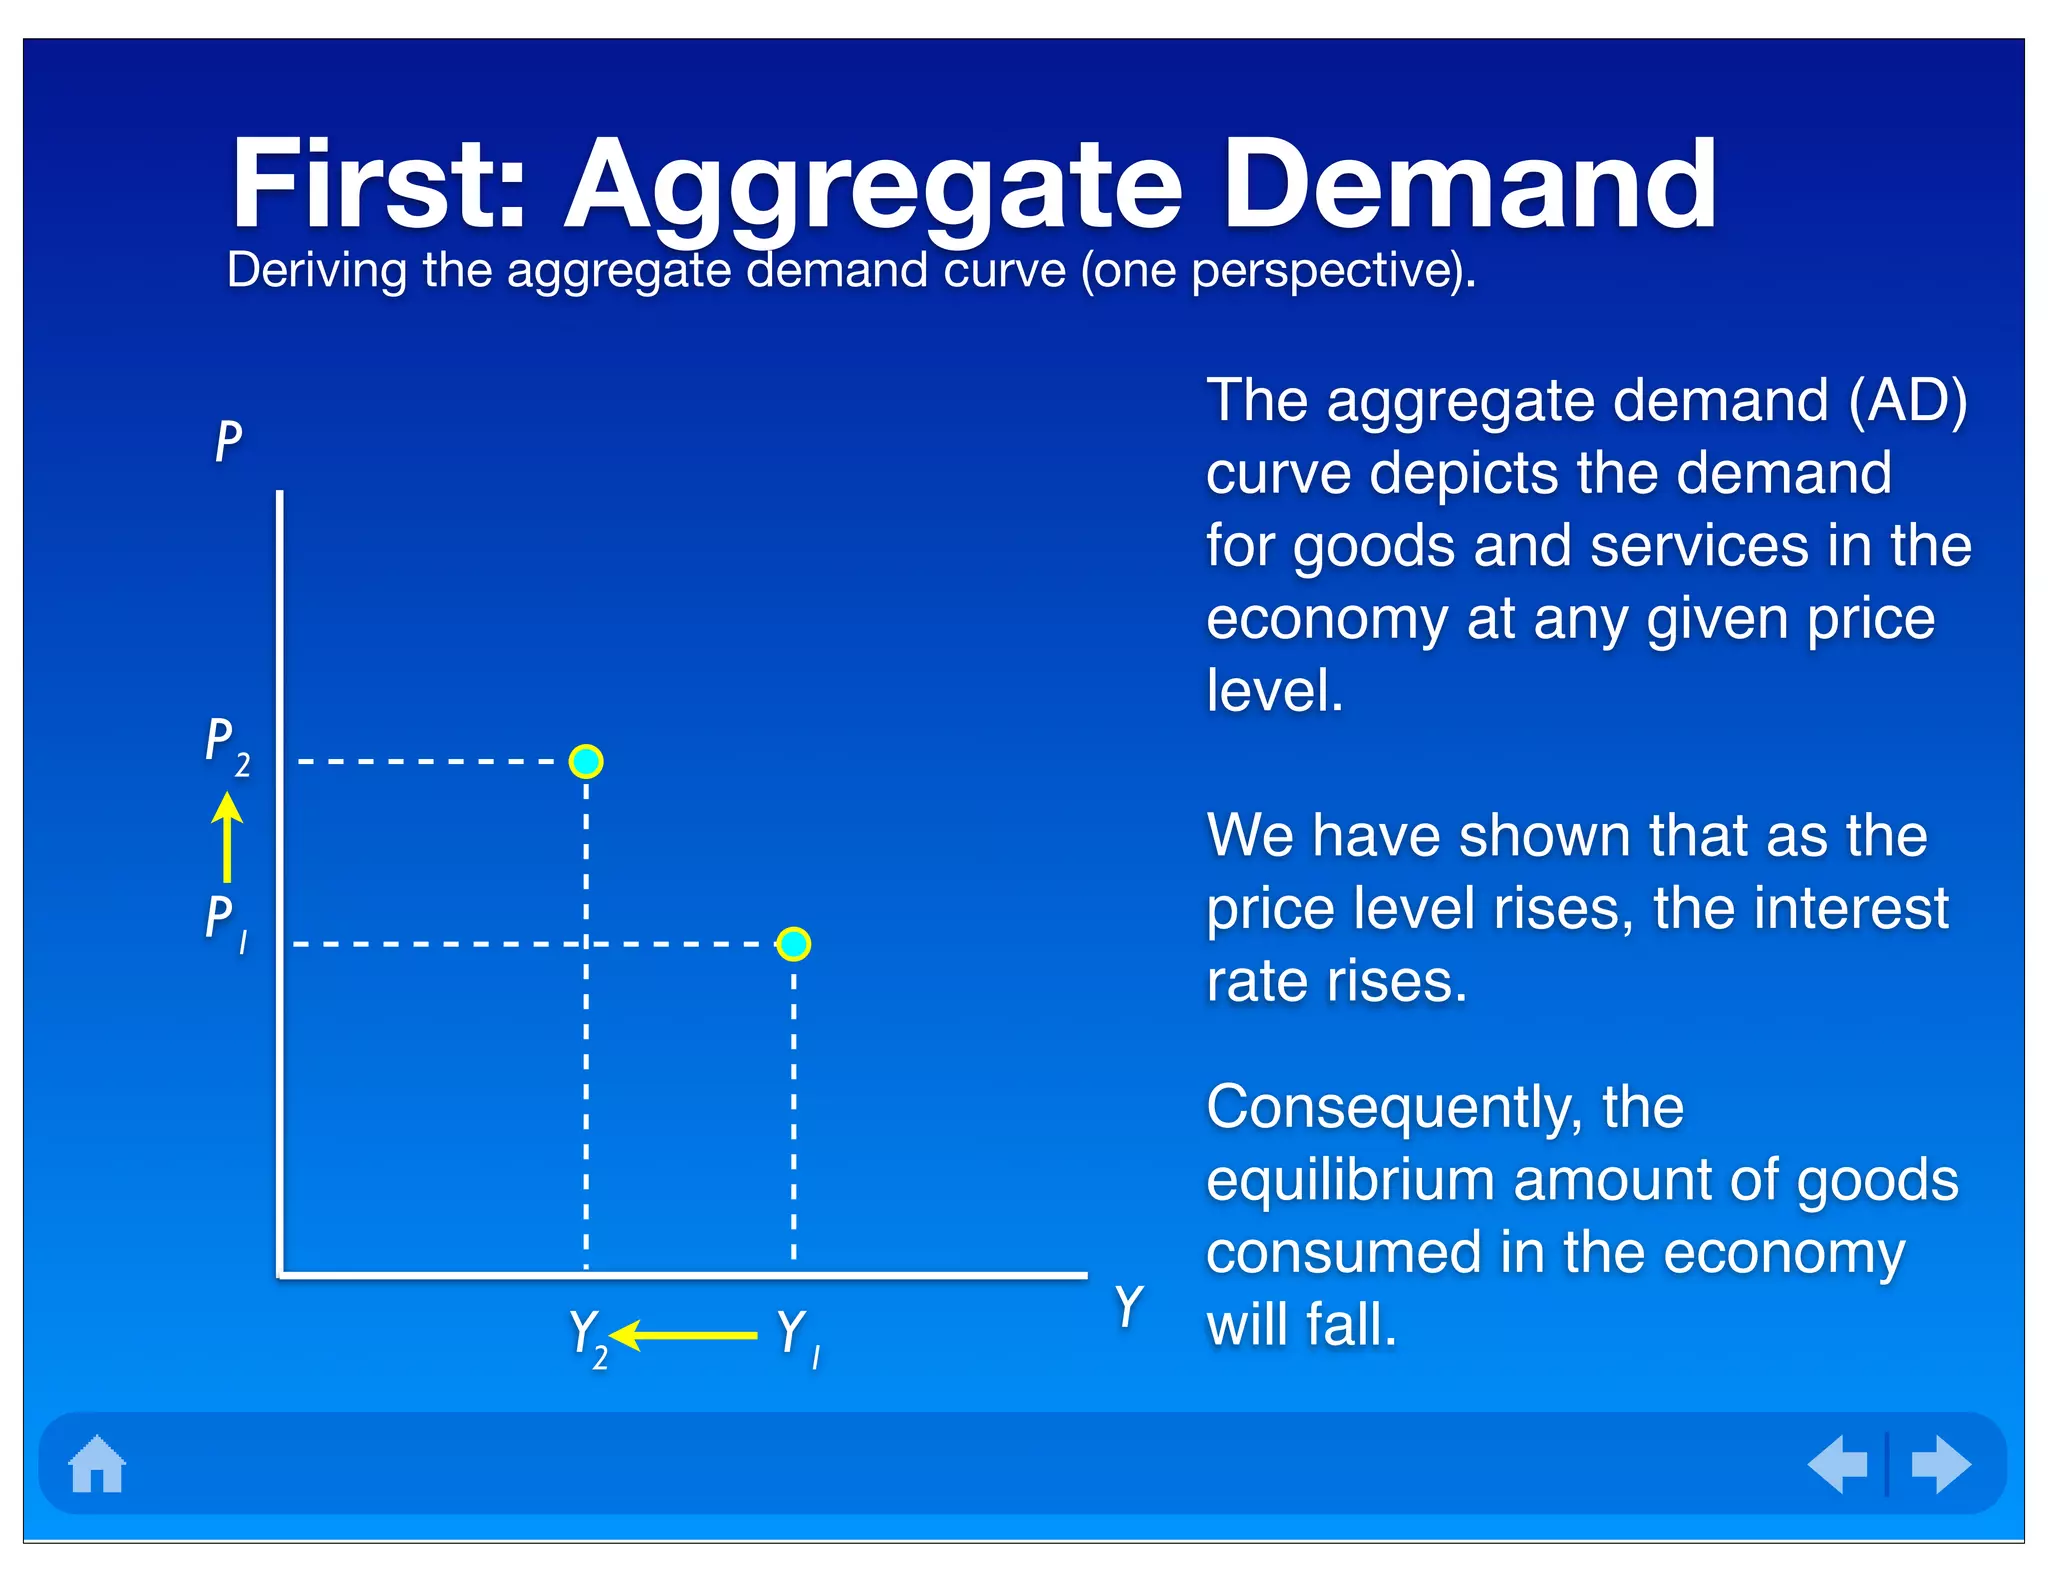
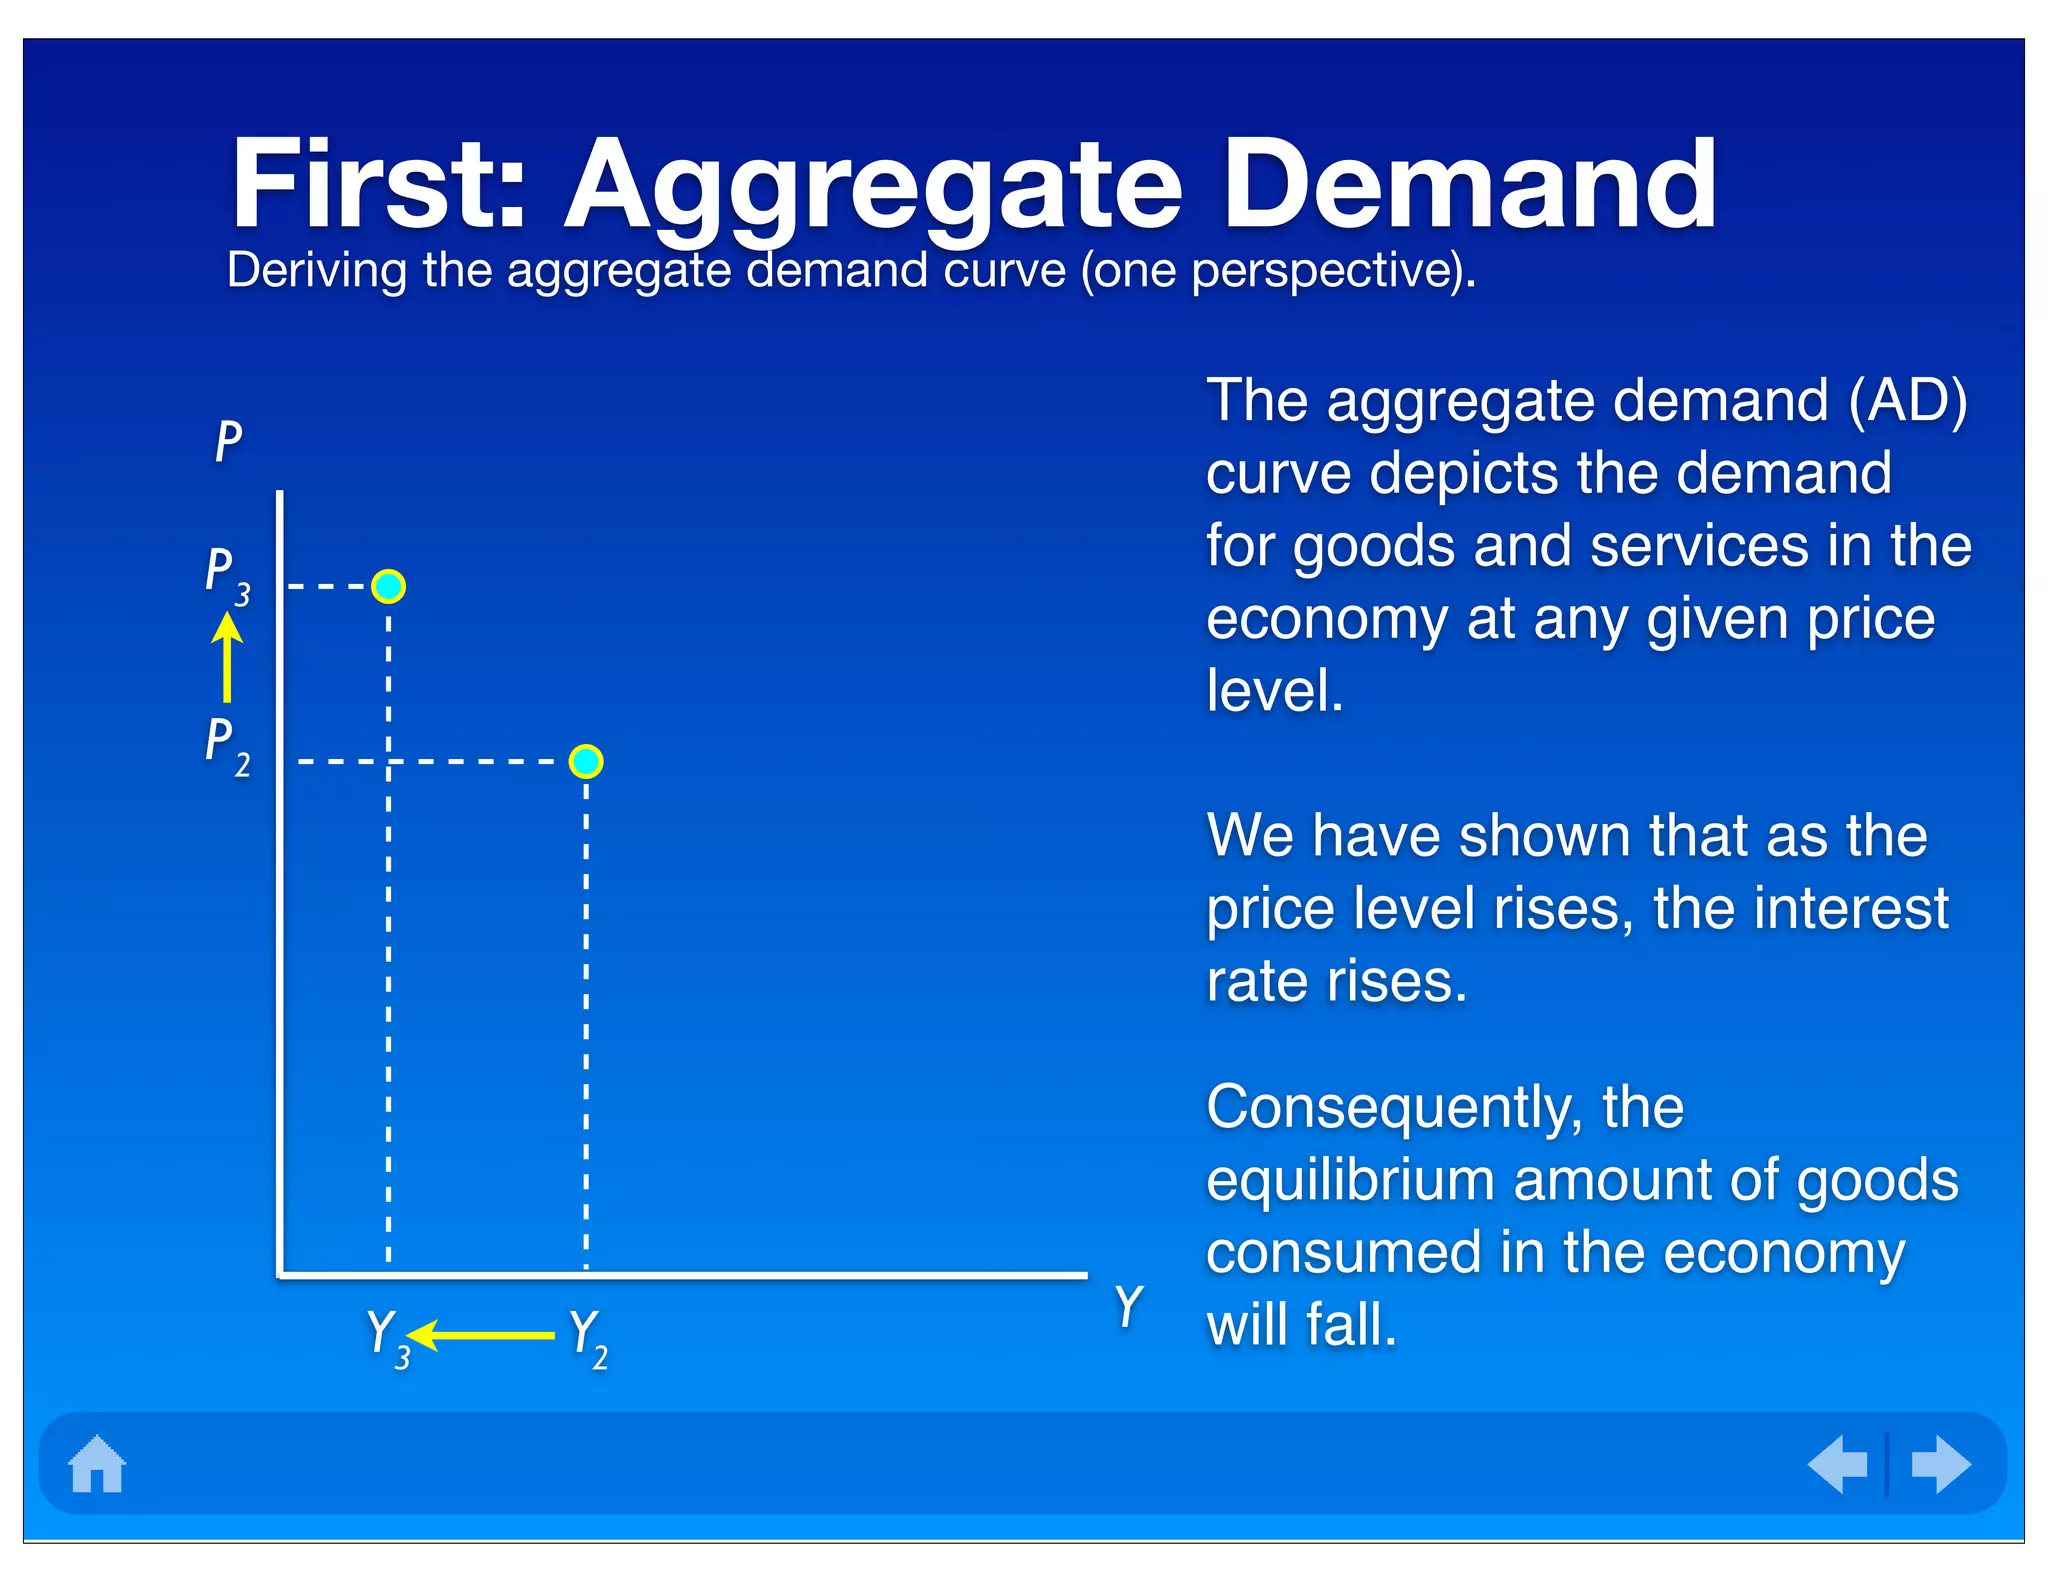

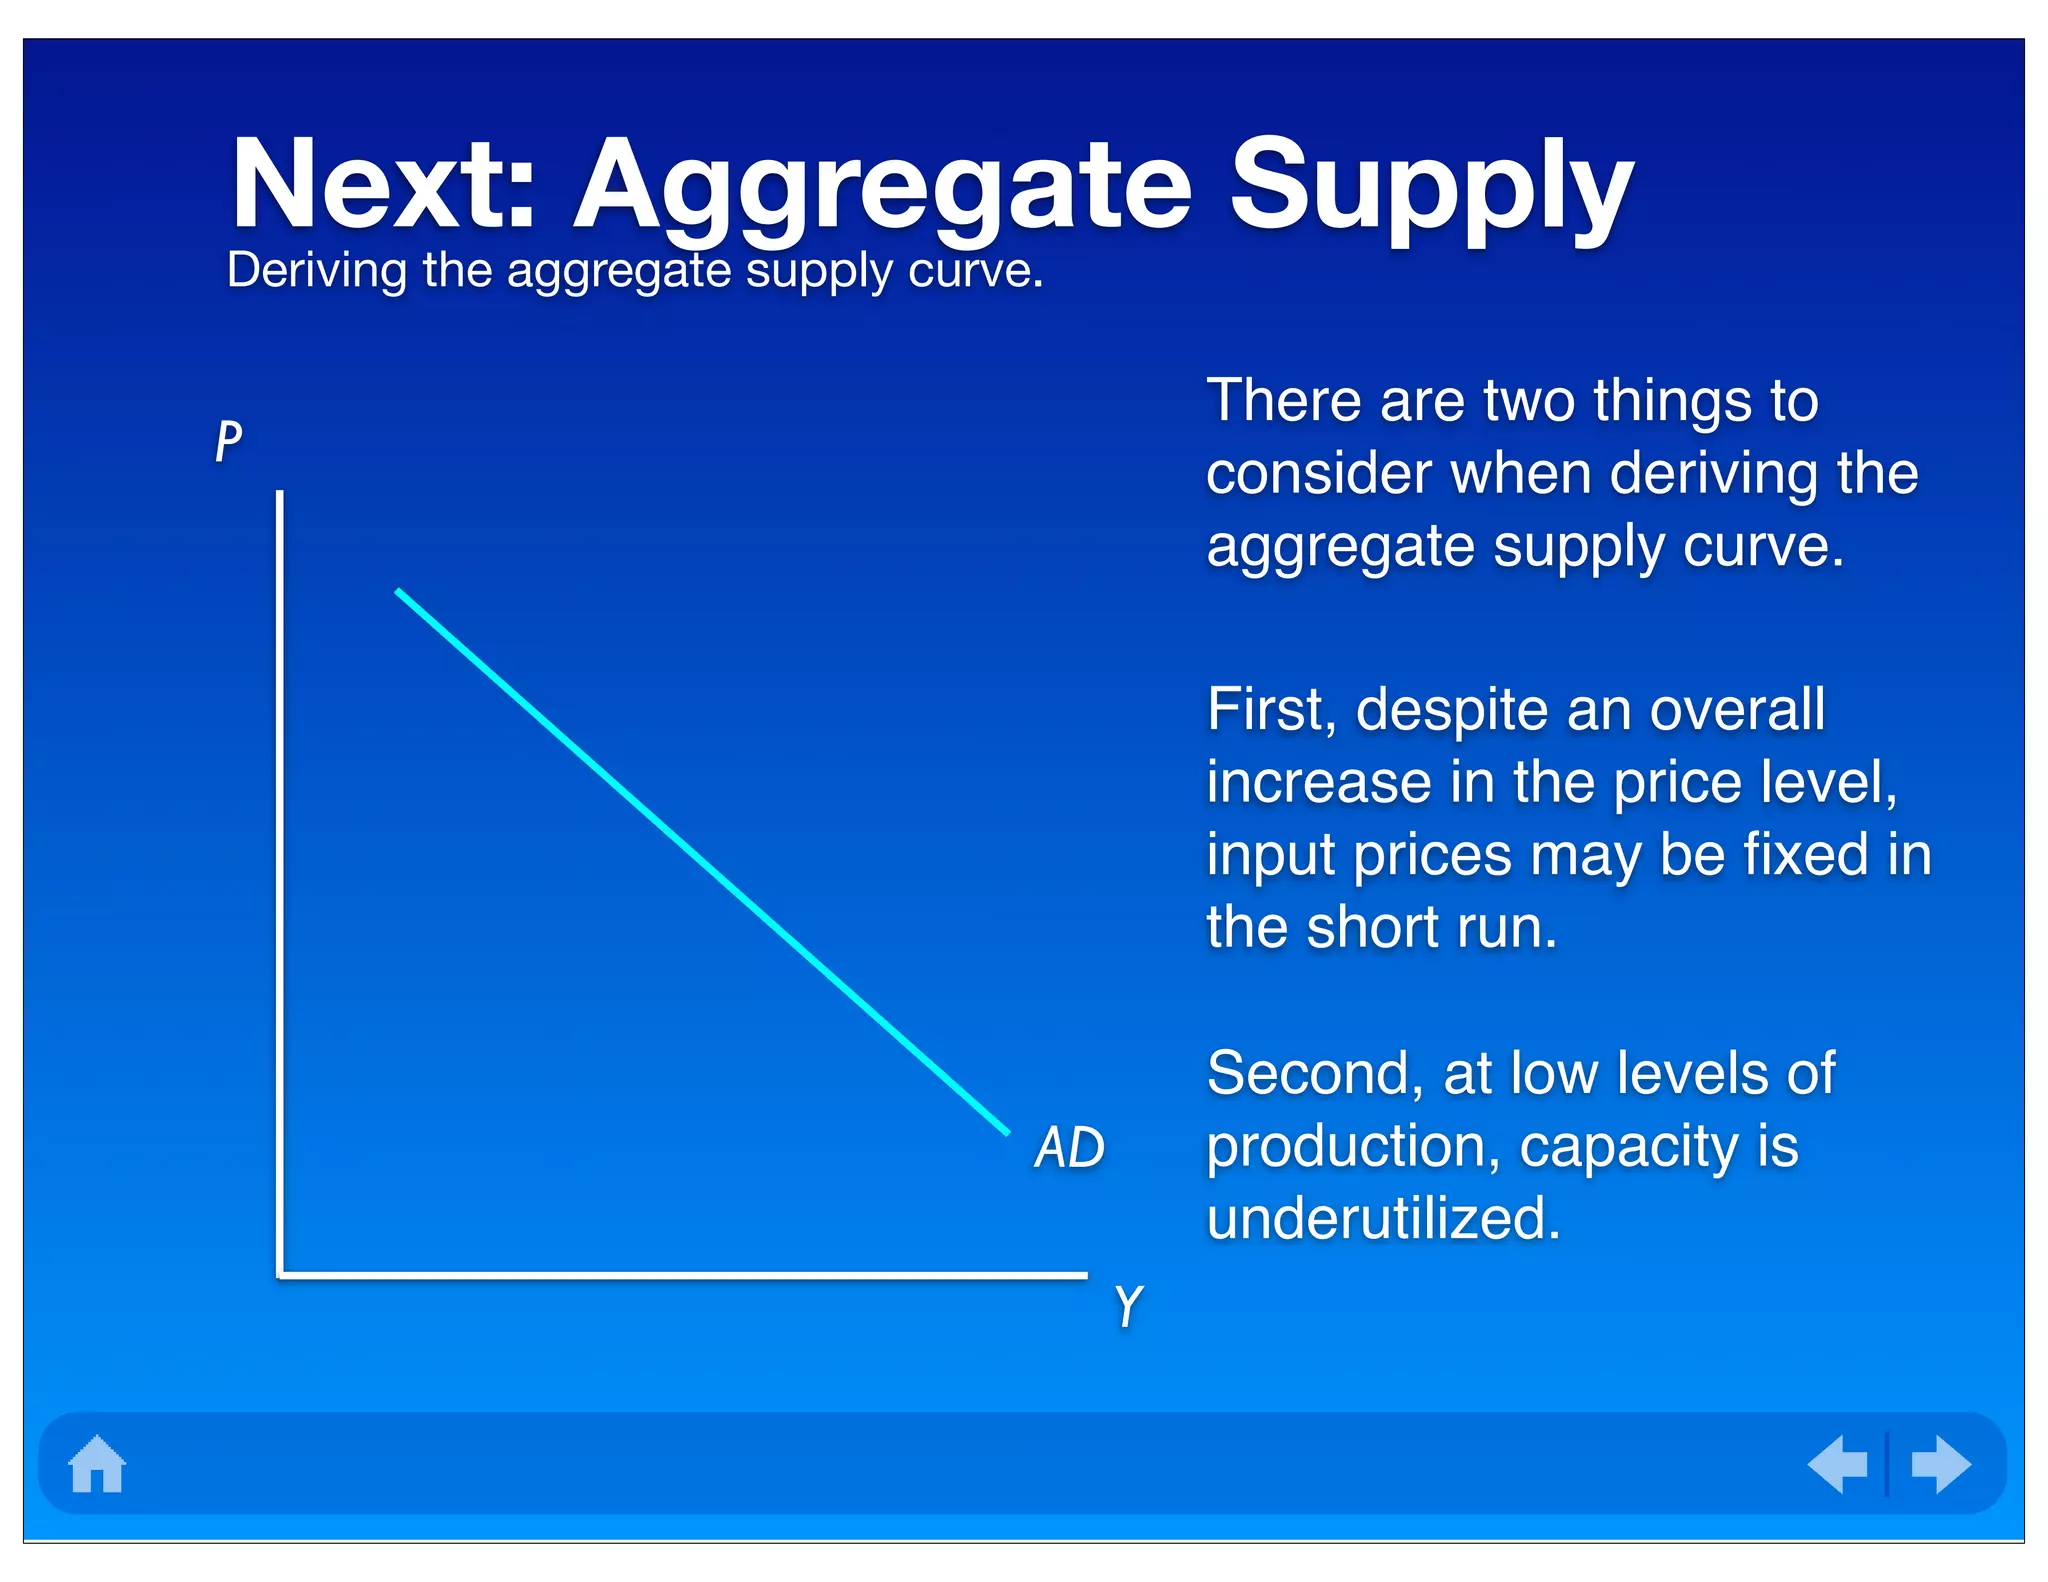
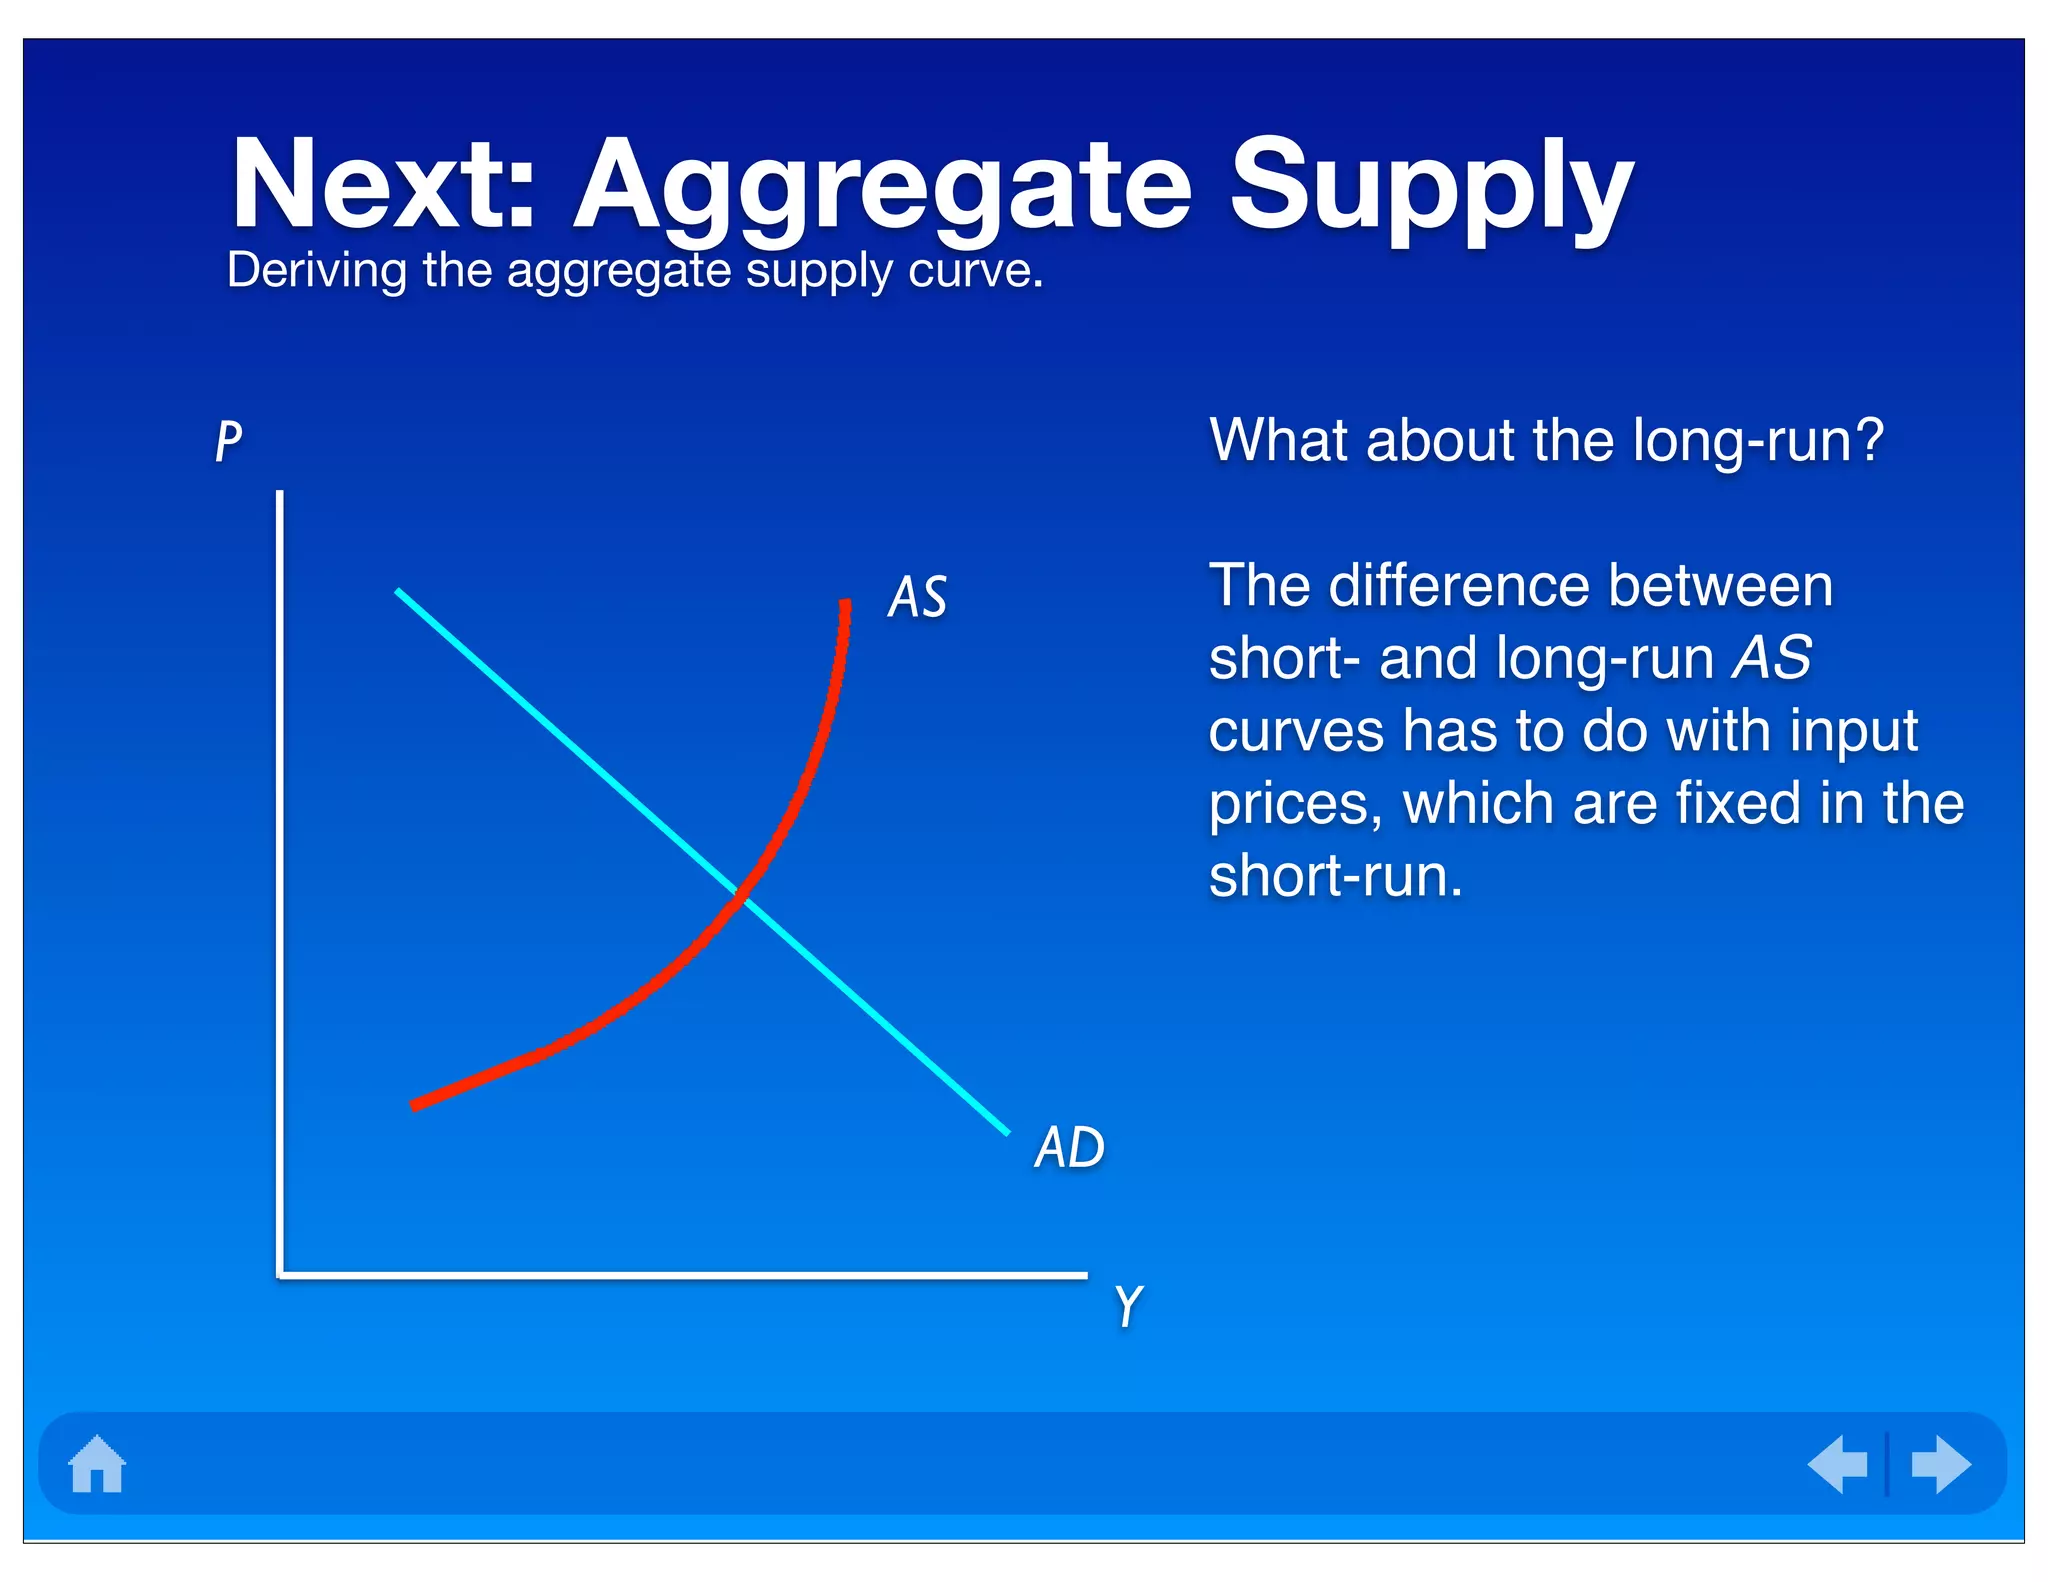

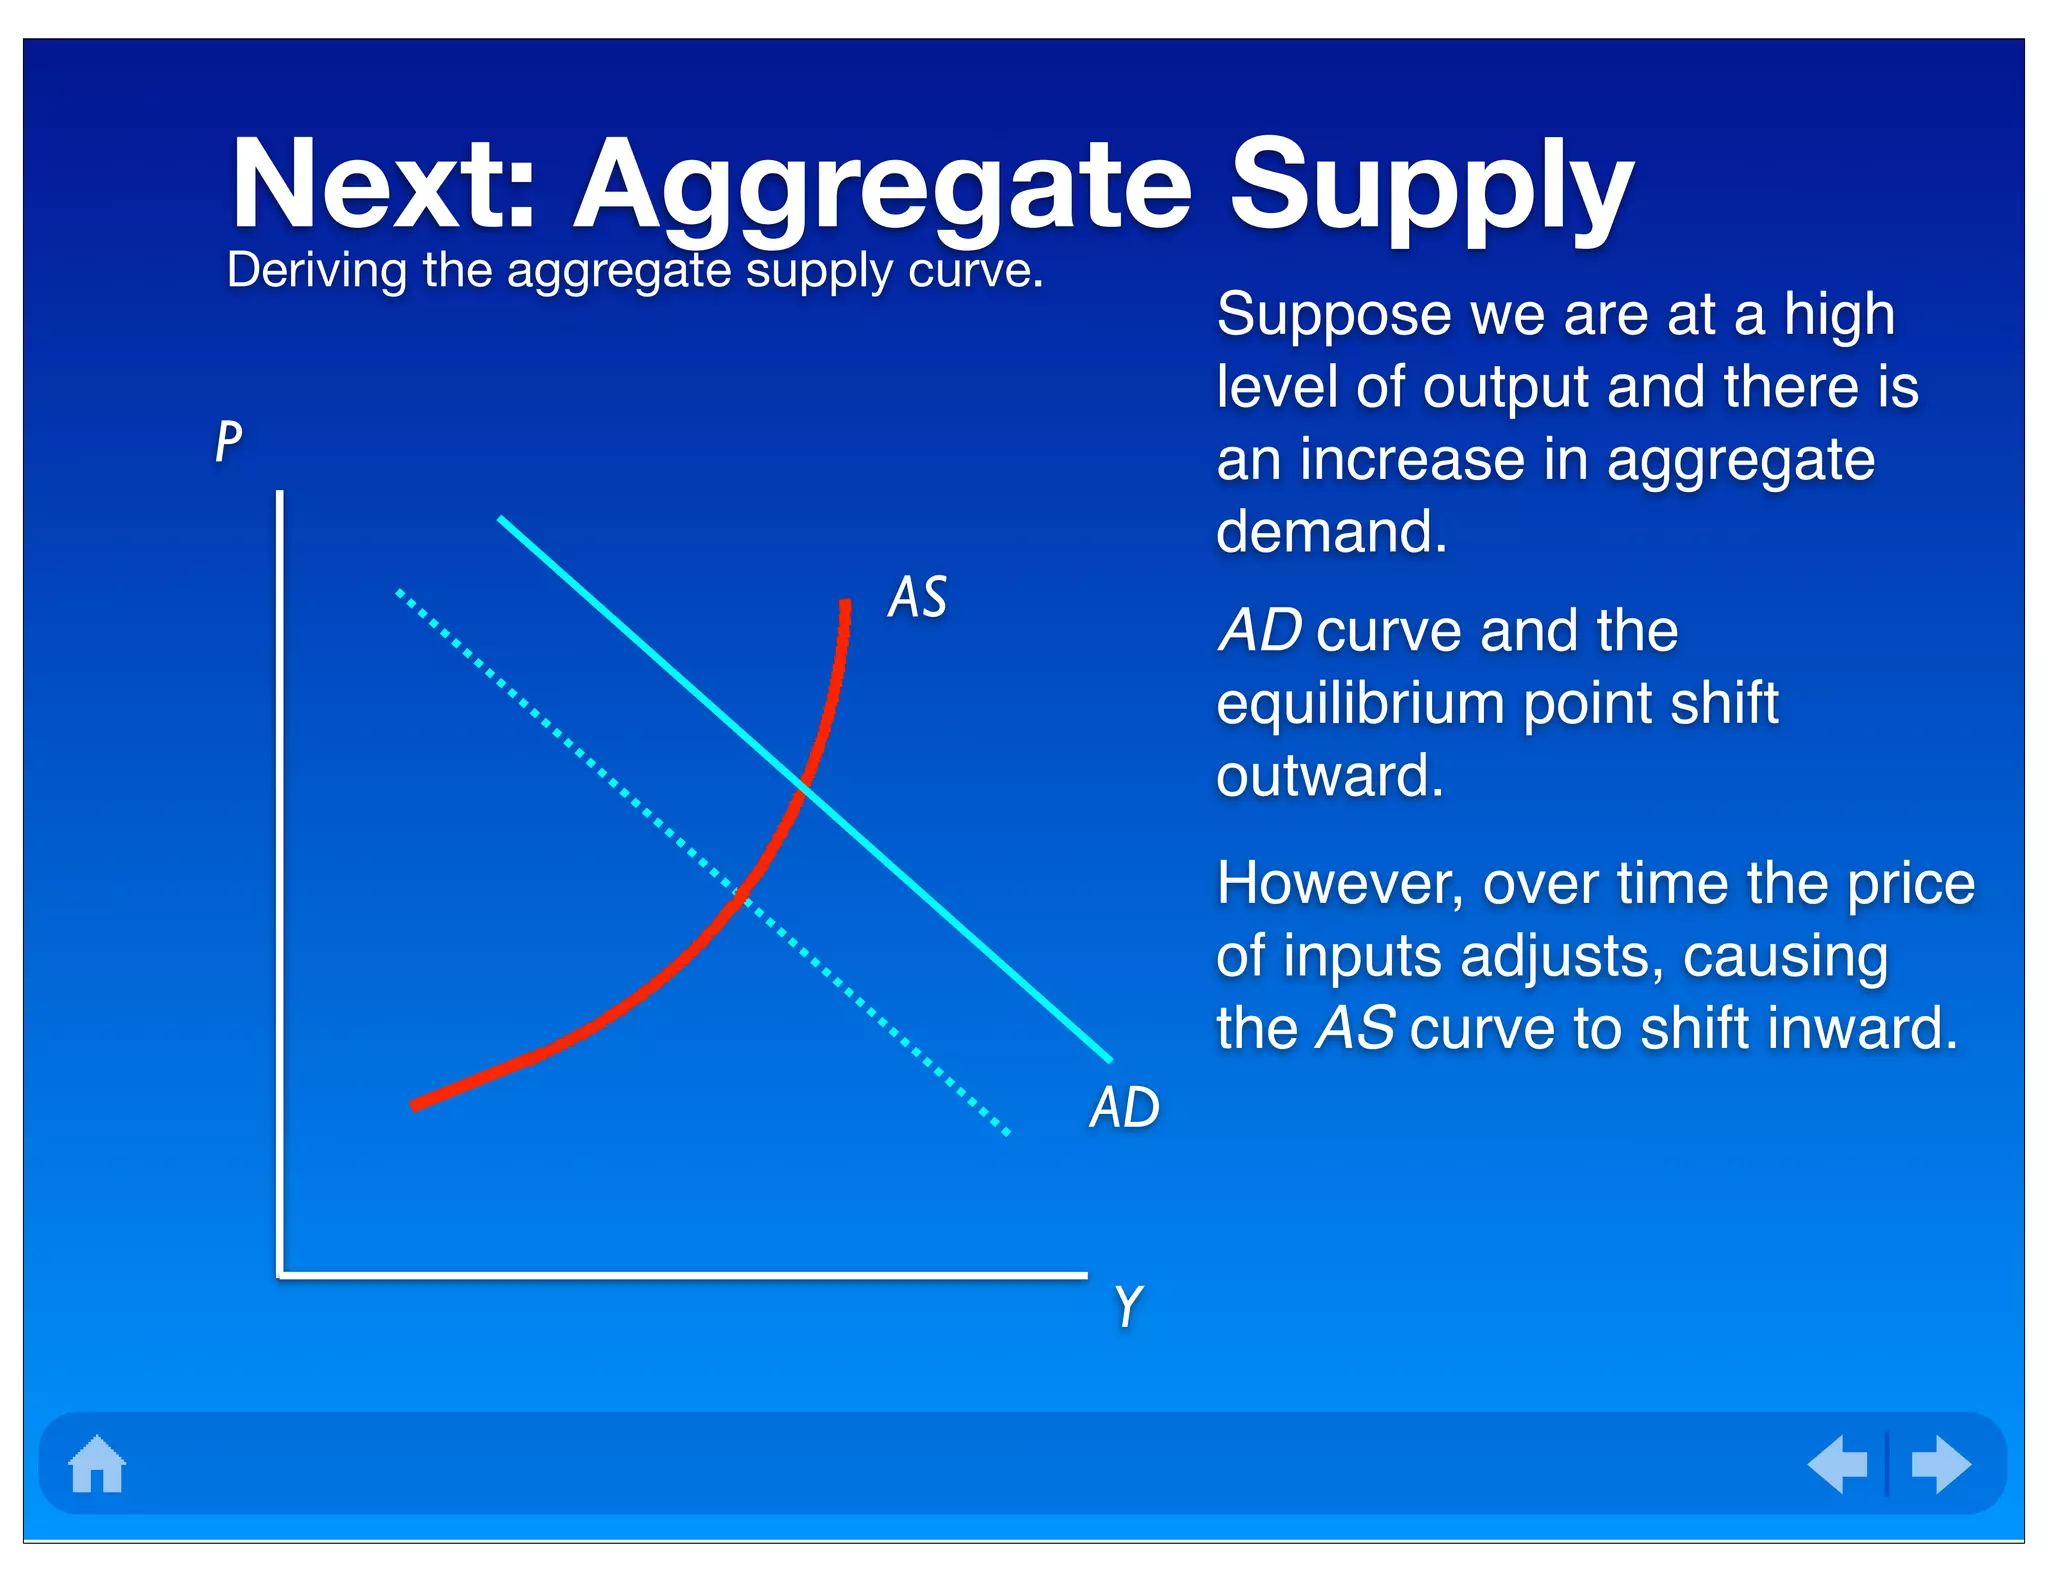

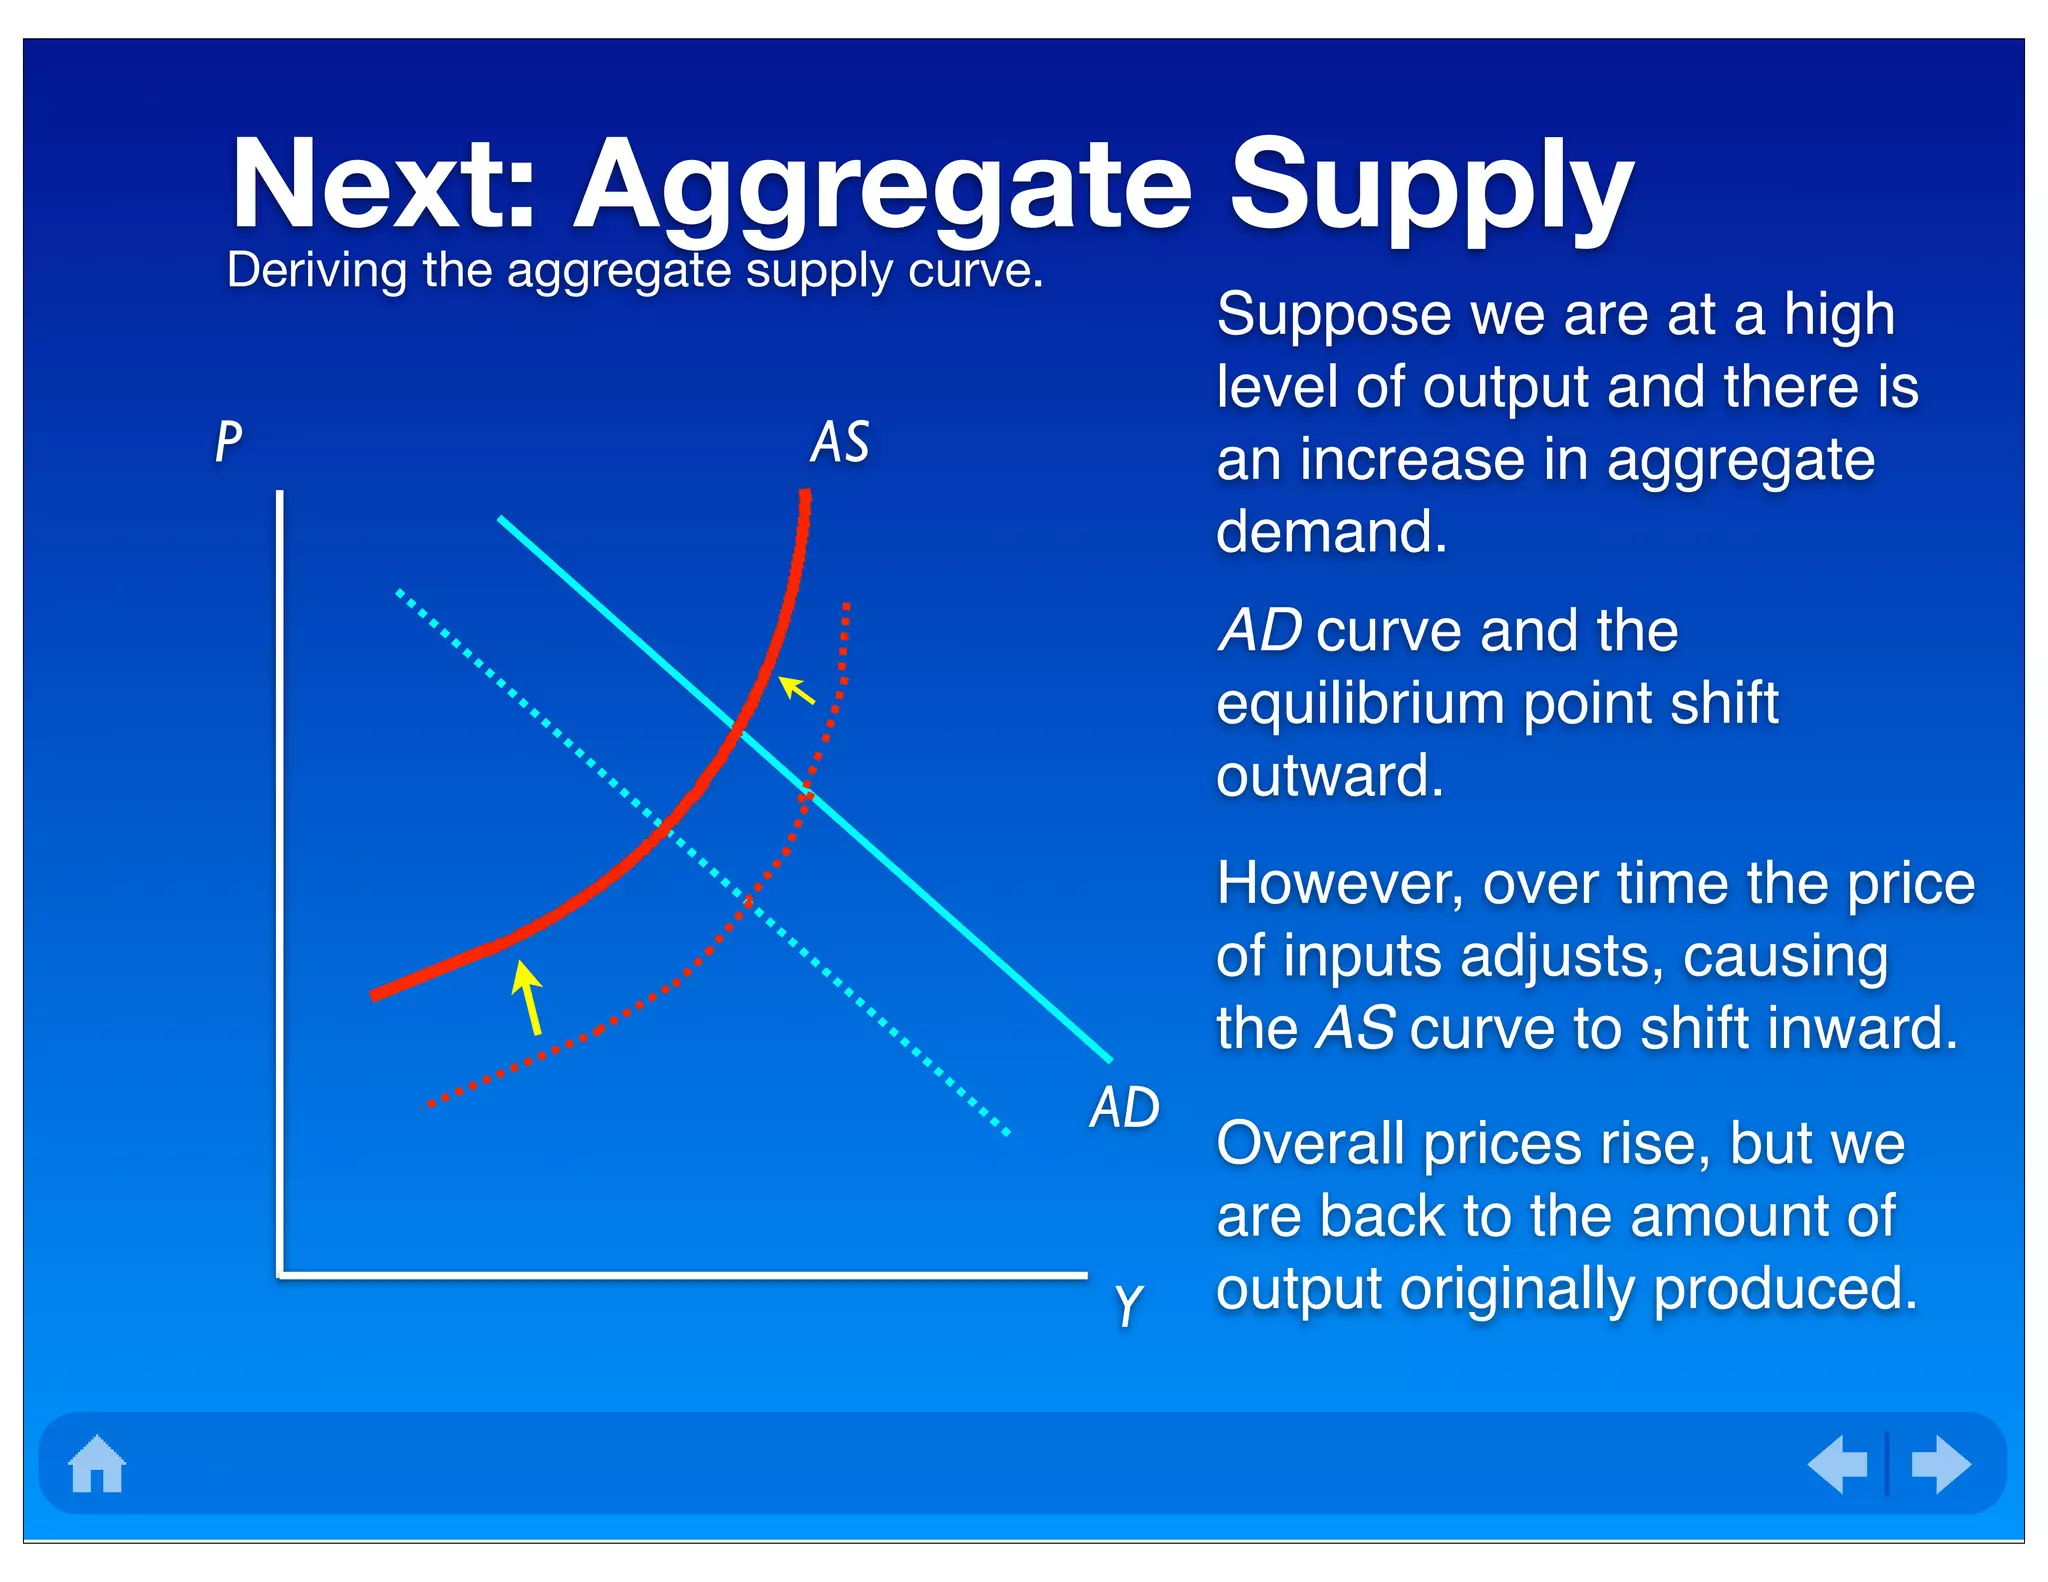

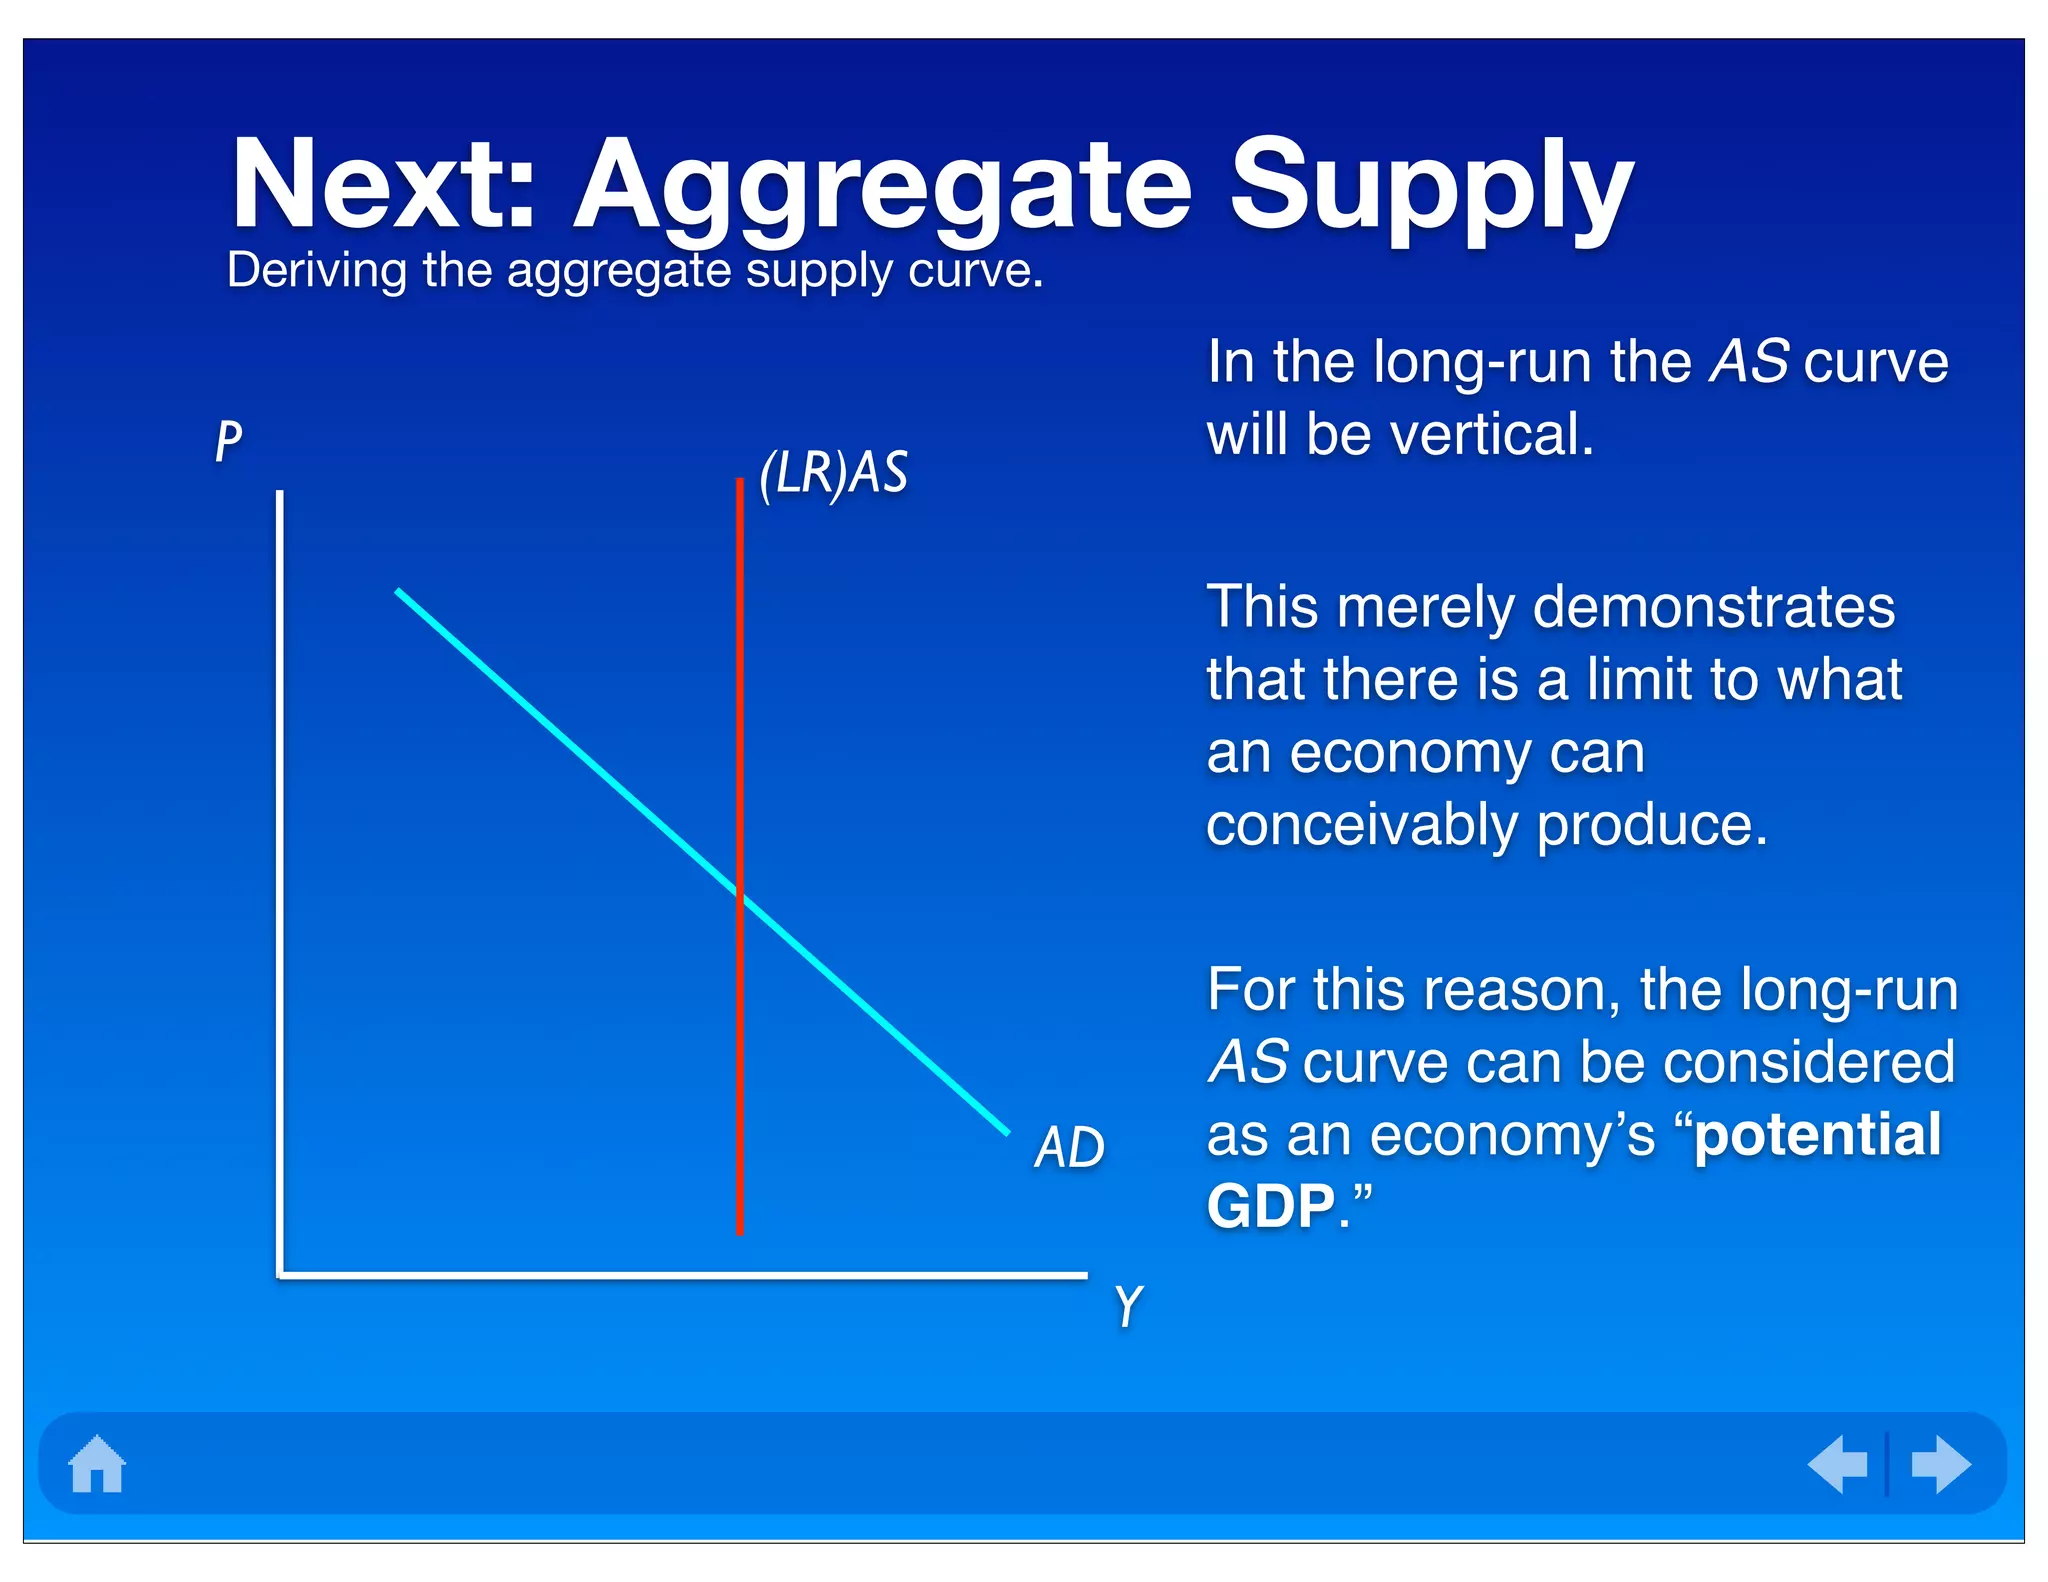
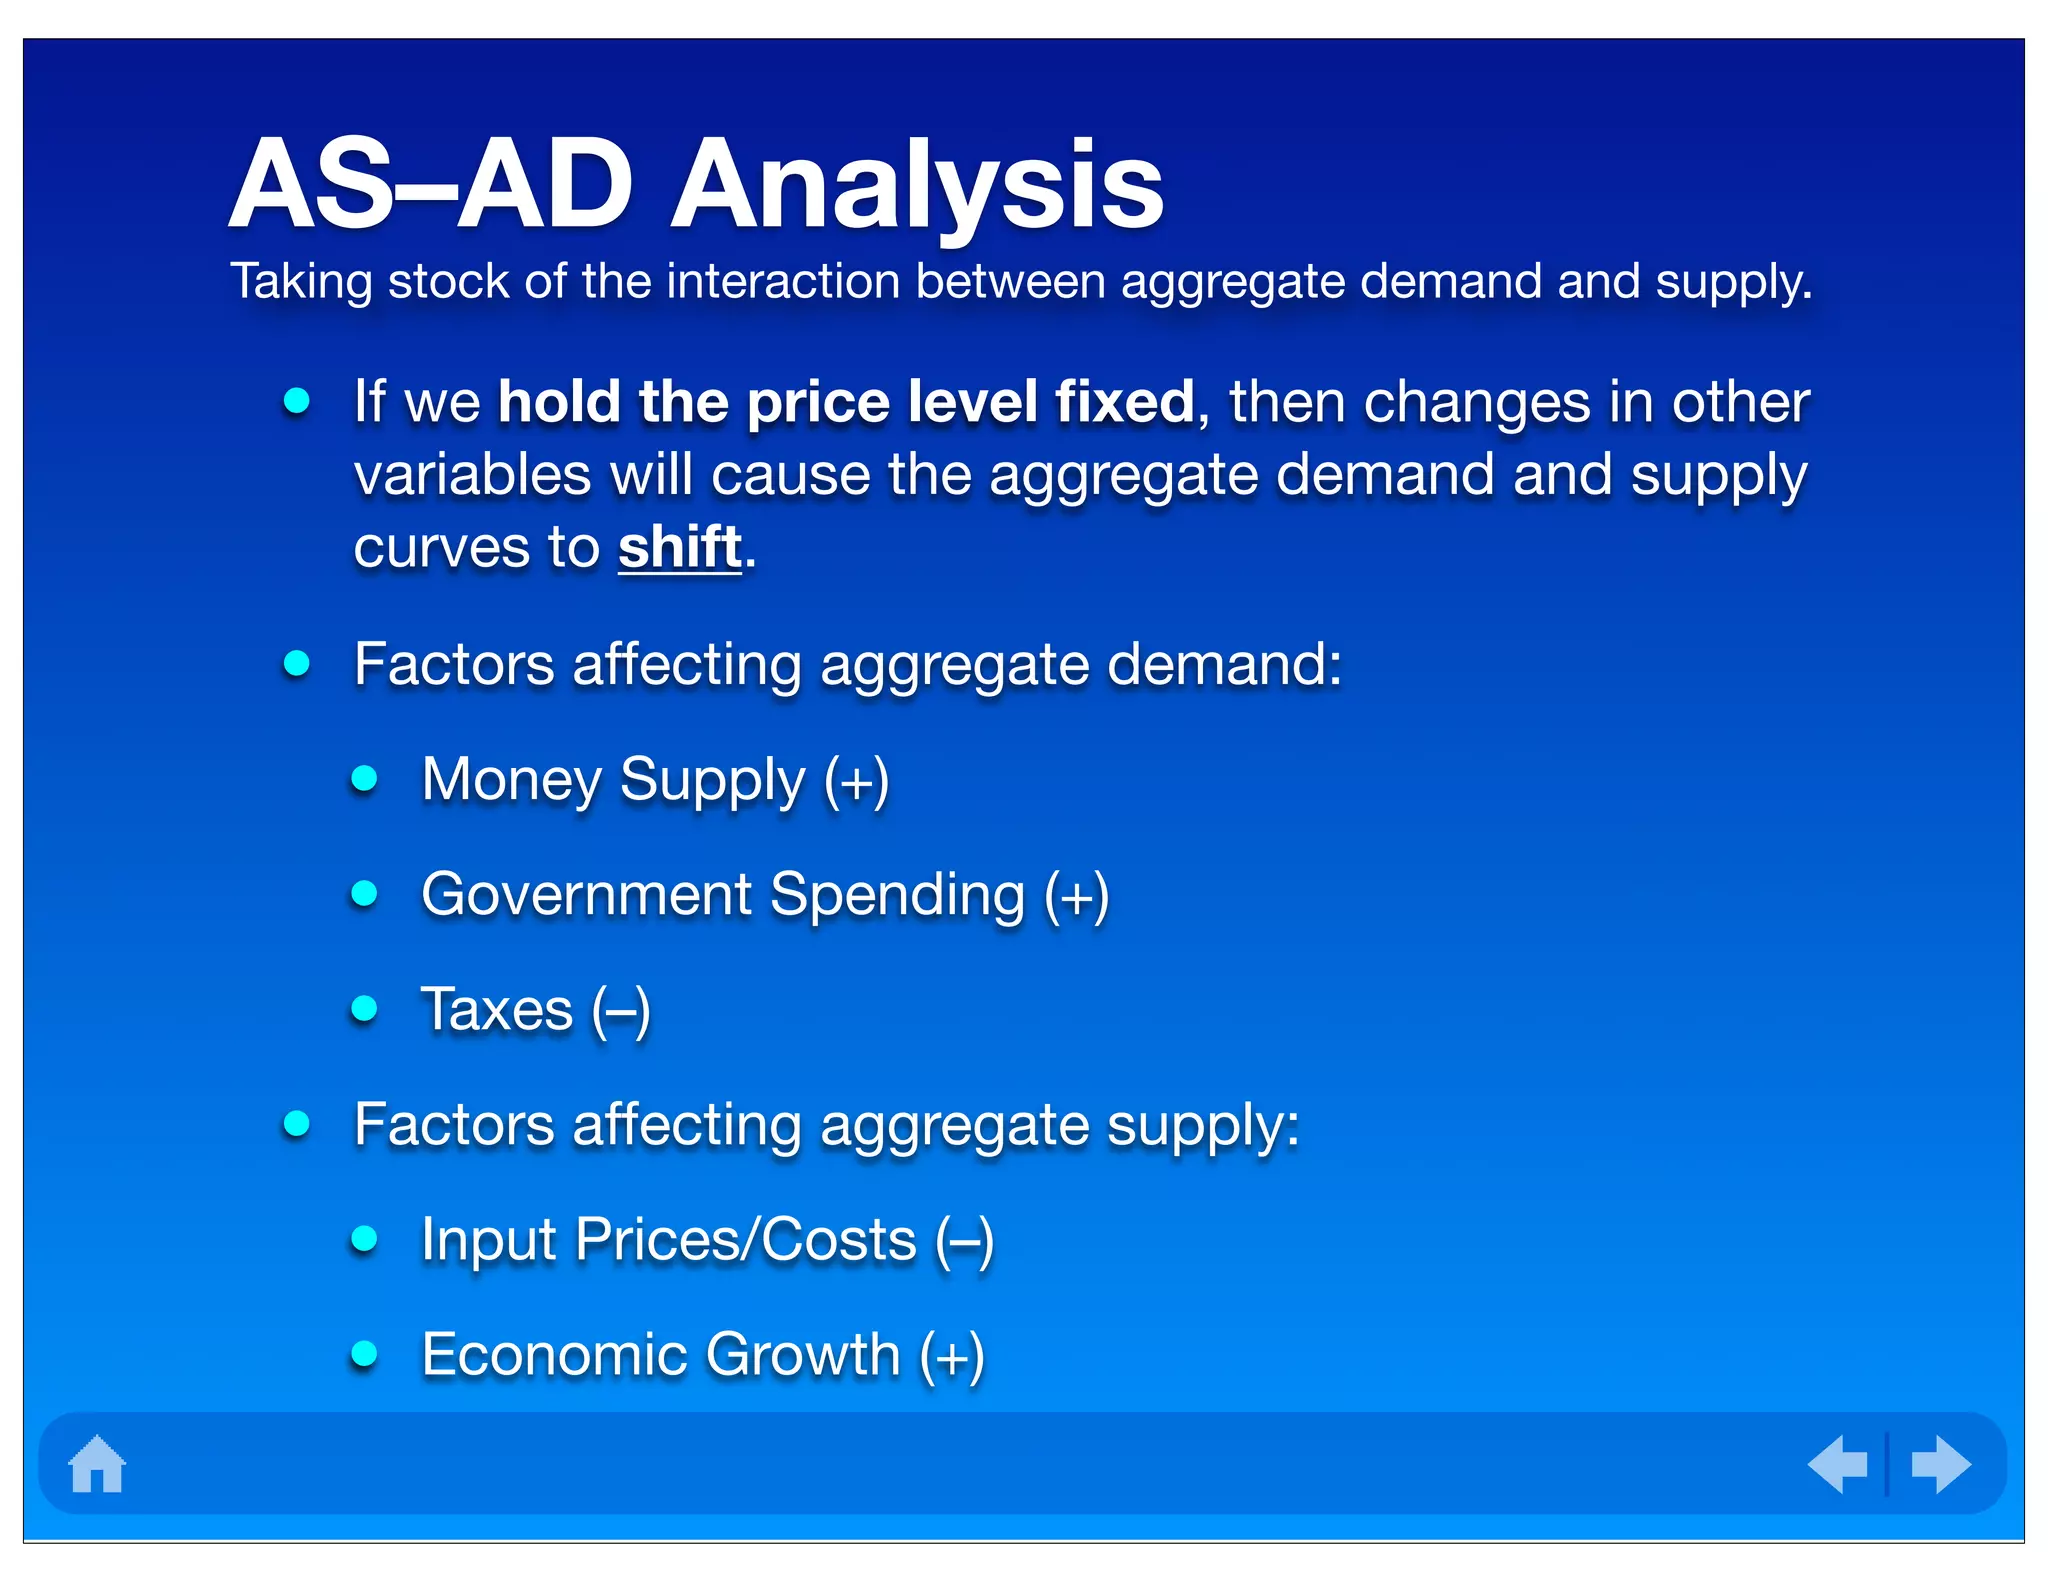
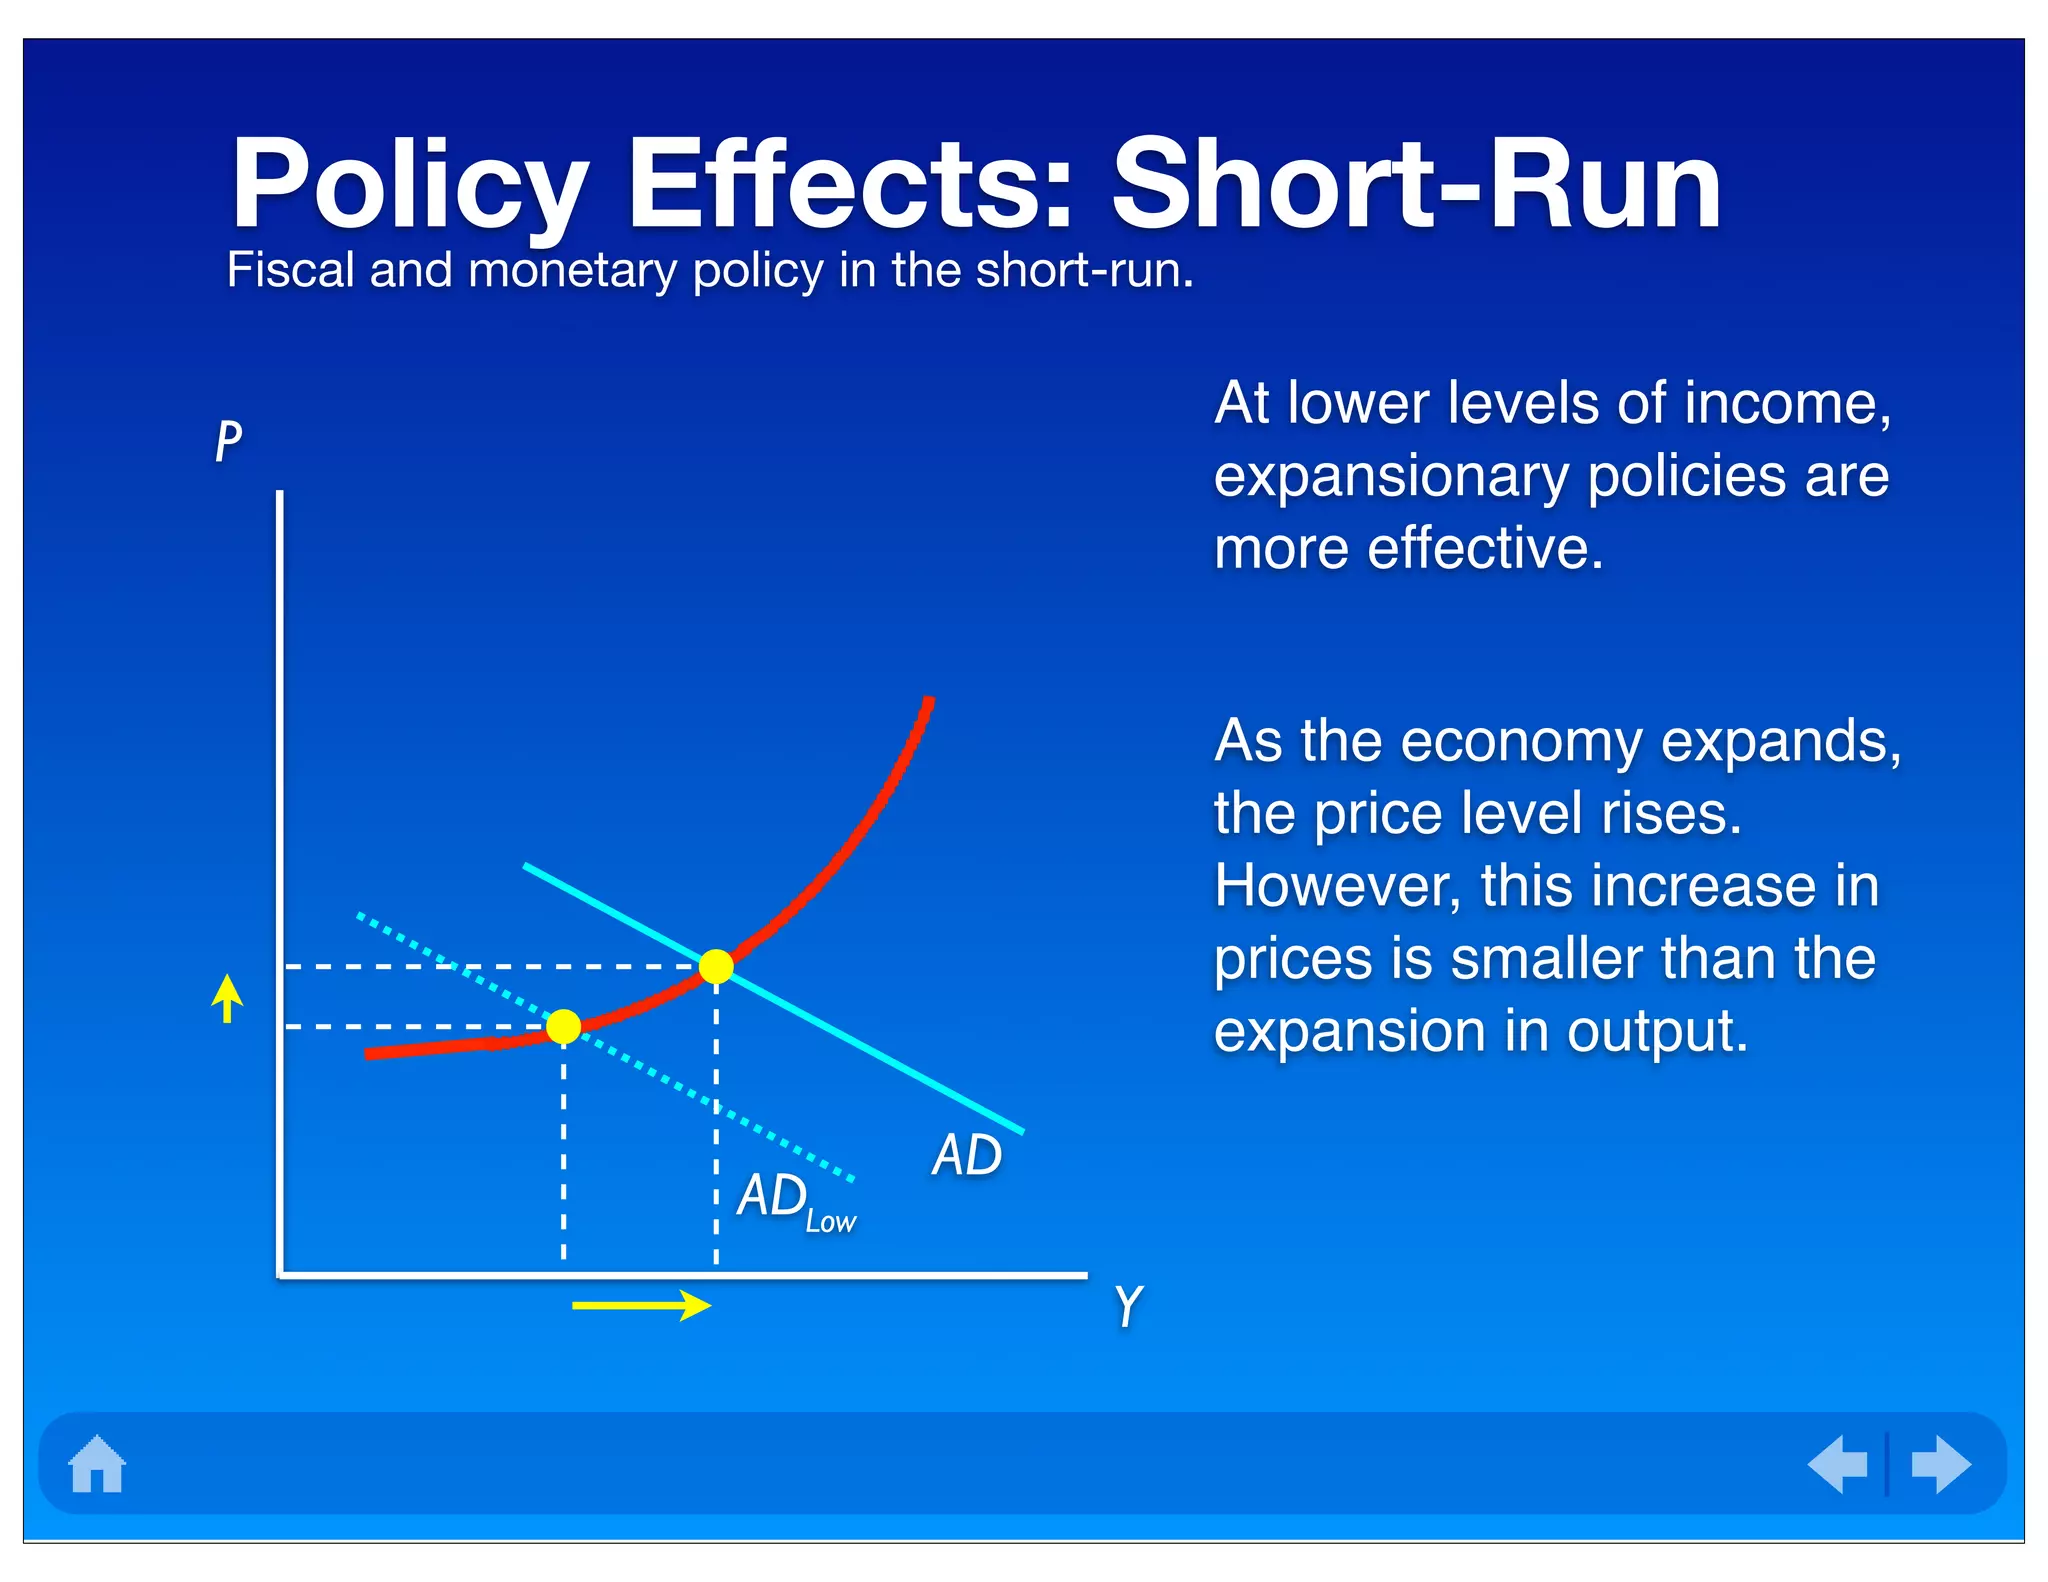
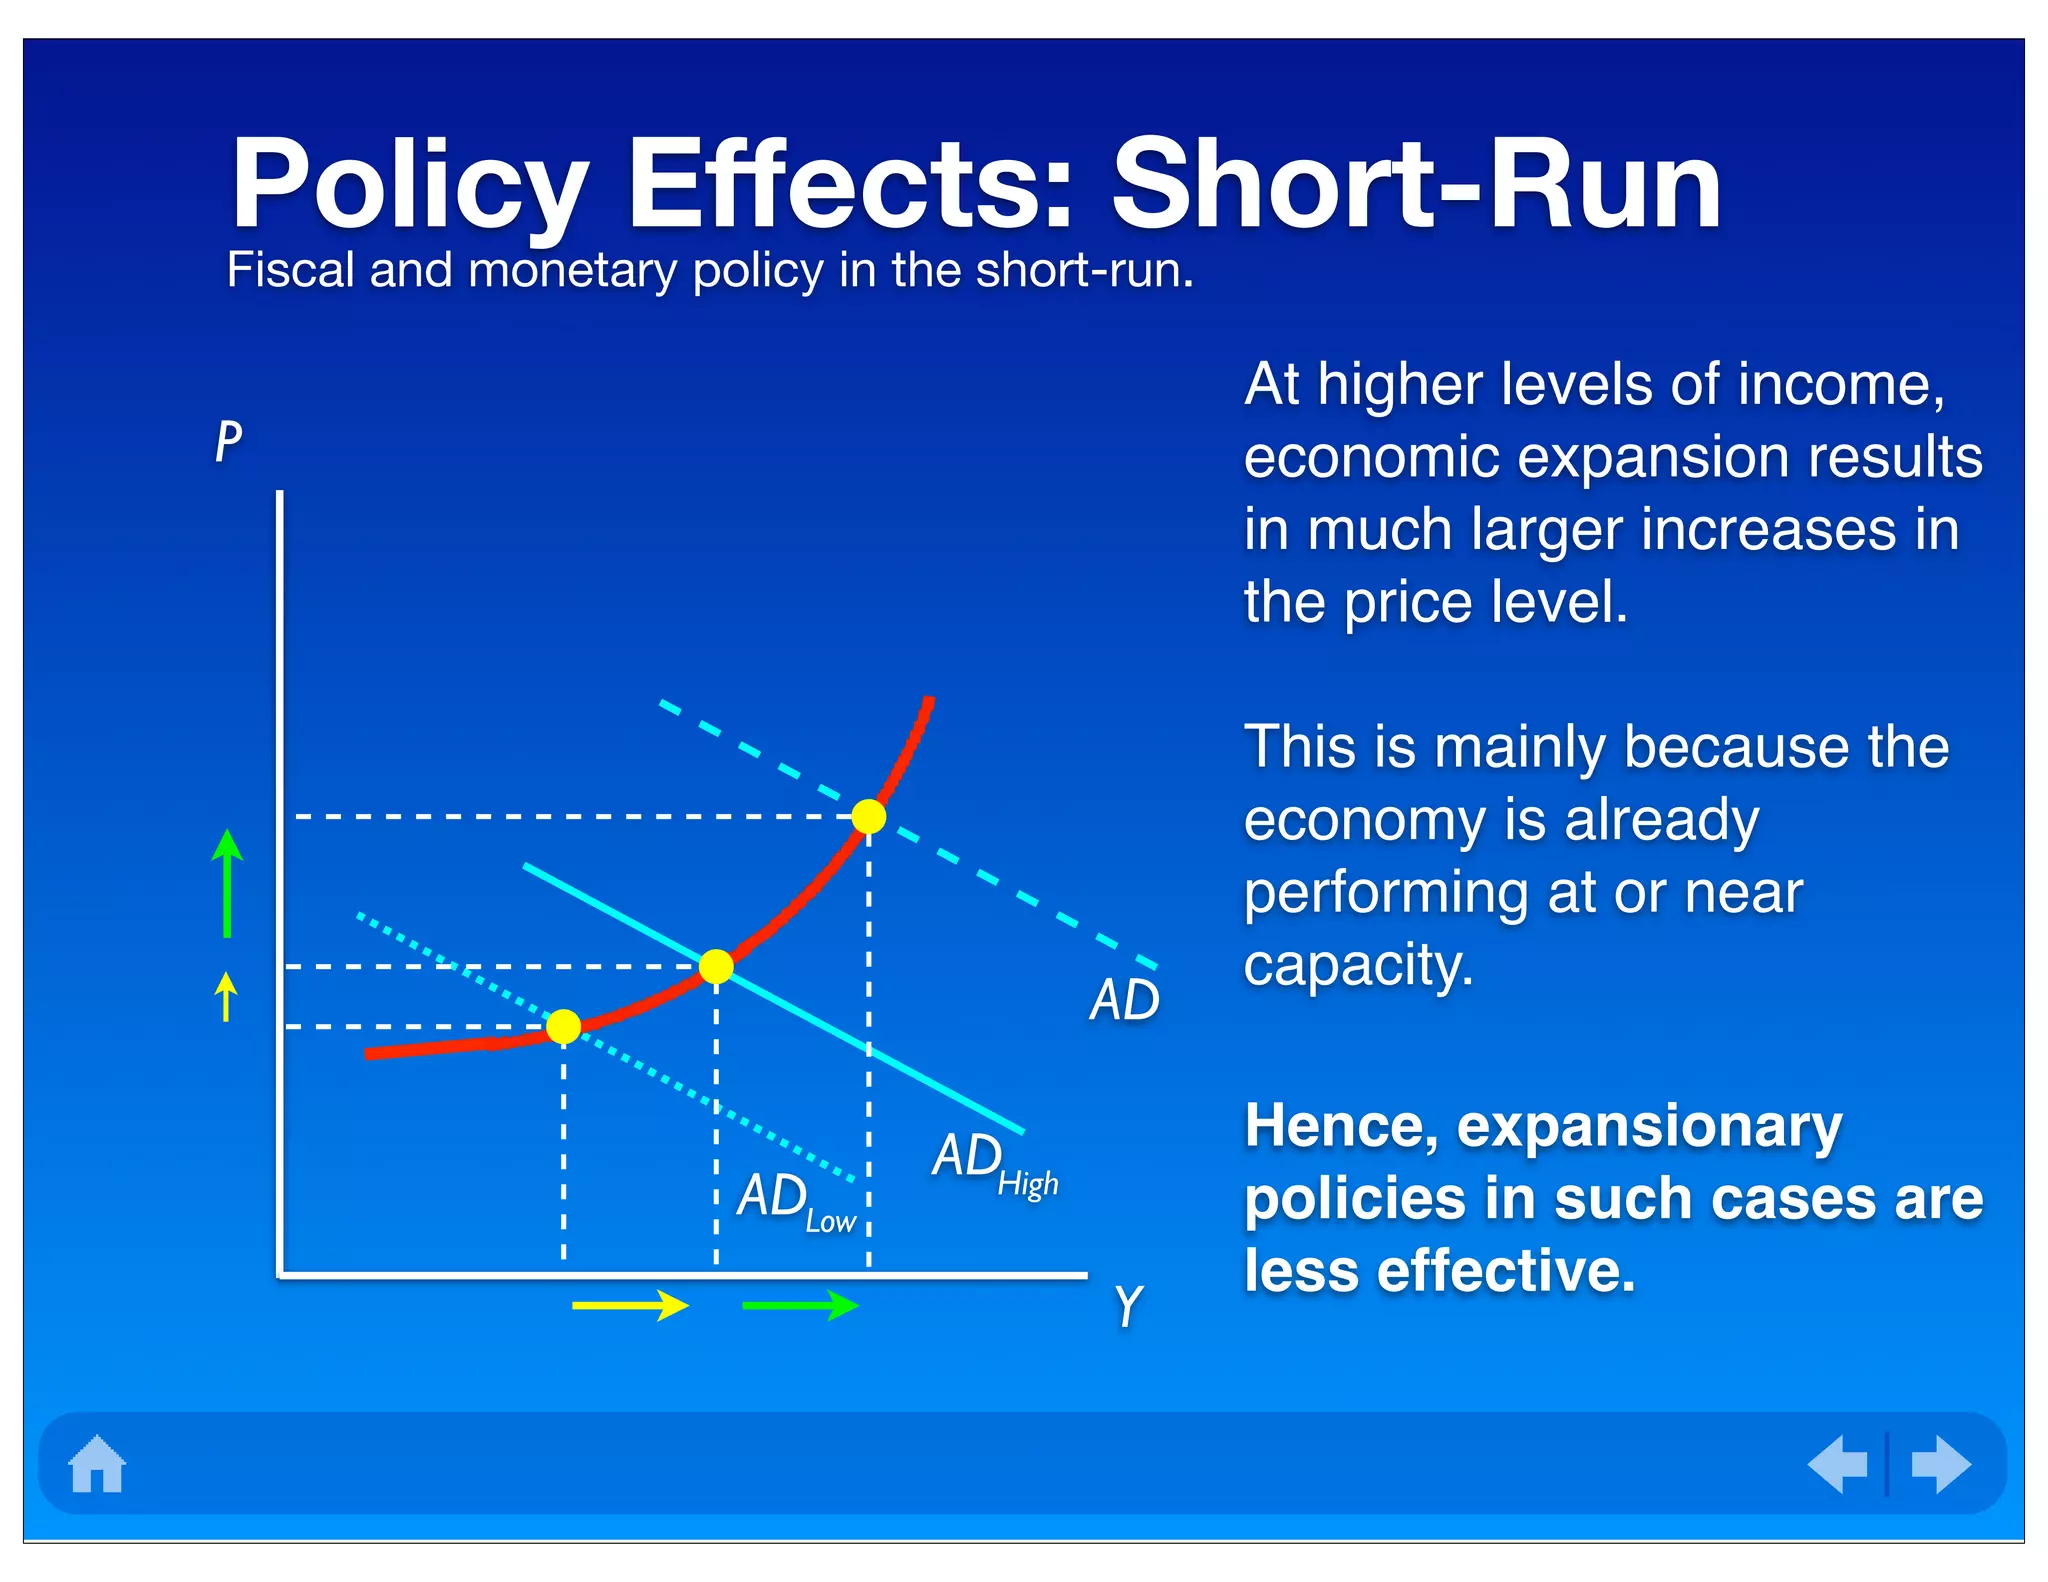

The document discusses the equilibrium of goods and money markets, emphasizing their interrelation through income and interest rates, as well as the impact of fiscal and monetary policies. It details the aggregate demand and supply curves, highlighting their derivation, behavior in response to price levels, and the differences between short-run and long-run perspectives. The analysis concludes with the implications of policy effects on economic output and price levels at varying income levels.