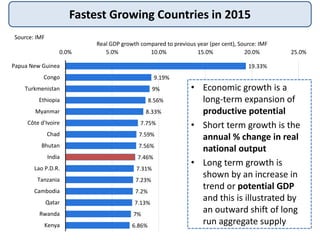
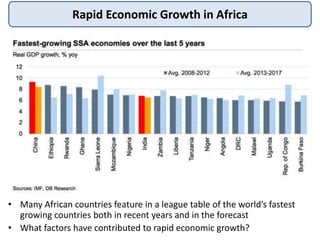
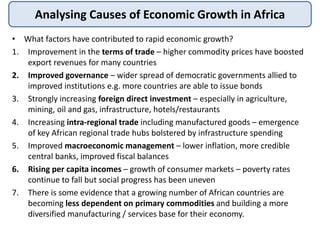
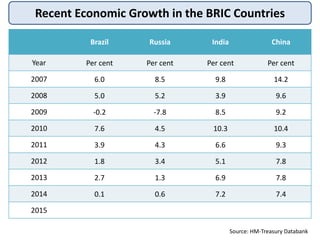
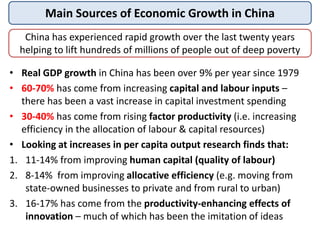
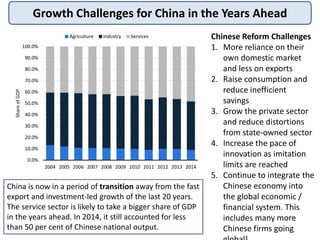
Economic Growth – Causes and Impact
EdExcel AS Economics 2.1.1 and 2.5.4
Fastest Growing Countries in 2015
19.33%
9.19%
9%
8.56%
8.33%
7.75%
7.59%
7.56%
7.46%
7.31%
7.23%
7.2%
7.13%
7%
6.86%
0.0% 5.0% 10.0% 15.0% 20.0% 25.0%
Papua New Guinea
Congo
Turkmenistan
Ethiopia
Myanmar
Côte d'Ivoire
Chad
Bhutan
India
Lao P.D.R.
Tanzania
Cambodia
Qatar
Rwanda
Kenya
Real GDP growth compared to previous year (per cent), Source: IMF
• Economic growth is a
long-term expansion of
productive potential
• Short term growth is the
annual % change in real
national output
• Long term growth is
shown by an increase in
trend or potential GDP
and this is illustrated by
an outward shift of long
run aggregate supply
Source: IMF
0.0%
0.5%
1.0%
1.5%
2.0%
2.5%
3.0%
2010 2011 2012 2013 2014 2015* 2016* 2017* 2018* 2019* 2020*
GDPgrowthratecomparedtopreviousyear
The chart shows real GDP growth for the UK from 2010-2014. Data for 2015 onwards
shows forecast growth using data from the International Monetary Fund (IMF)
Source: ONS
The UK Economic Cycle in Recent Years
Short Run and Long Run Economic Growth
Short term economic growth
Cyclical changes in real GDP
Changes in AD (C+I+G+X-M)
Changes in short run AS
Short term external shocks to
both demand and supply
Short term policy changes e.g.
changes in interest rates
Long run economic growth
Potential output / trend growth
Productivity of labour & capital
Technological progress and
strength of enterprise
Changes in the labour force
Investment rates
Key Factors Affecting Short Run Economic Growth
Interest rates set by
the central bank
Fiscal policy -
government spending
and taxation
Commodity prices
such as oil, gas and
foodstuffs
Exchange rates Trading conditions in
other countries
Confidence of
businesses and
households
Short Run Economic Growth from Increasing AD
General
Price Level
Real GDP
GPL1
AS
Y1
AD1
AD2
Y2
GPL2
An increase in AD causes an expansion of aggregate supply and a
higher equilibrium level of national output (i.e. higher real GDP)
Key Factors Affecting Long Run Economic Growth
Investment Productivity Labour supply
Research Innovation Enterprise
Economic Growth using AD-AS Diagrams
General
Price Level
Real GDP
GPL1
AS1
Y1
AD1
Yp1
LAS1
A rise in a country’s
productive
potential is shown
by an outward shift
of long run
aggregate supply
(i.e. LAS1 to LAS2)
This means a higher
level of aggregate
demand can be
met because of an
increase in the
supply capacity
LAS2
AS2
AD2
Yp2Y2
Economic Growth using PPF Diagrams
Economic Growth
A rise in a
country’s
productive
capacity causes
the PPF to shift
out from PPF1 to
PPF2 and this
then allows
increased supply
both of consumer
and capital goods.
Capital
goods
Consumer goods
PPF1
PPF2
A
B
C D
Successful supply-side
policies can help to bring
about an outward shift of the
a country’s PPF
E
F
Some of the Key Drivers of Economic Growth
Economic
growth
Expanding the capital stock
Increasing the active
labour supply
Extracting and
selling natural
resources
Improving factor
productivity
Driving innovation and
enterprise
Economic growth is a
sustained rise in a country’s
productive potential and real
national output
The main drivers of long run
economic growth are higher
productivity and gains from
innovation and rising real
incomes for households
Linking Capital Investment to Economic Growth
Injection of demand for
capital goods industries
Bigger capital stock can lift
productivity / incomes
Economies of scale &
better competitiveness
Investment helps to sustain
export-led growth
What are the main Benefits of Economic Growth?
Higher living standards – i.e. Real GNI per capita –
helps to lift people out of extreme poverty and
improve development outcomes (e.g. rising HDI)
Employment effects – sustained growth stimulates
jobs and contributes to lower unemployment rates
which is turn helps to reduce inequality.
Fiscal dividend – higher economic growth will raise
tax revenues and reduce government spending on
unemployment-related welfare benefits
Accelerator effect - rising growth stimulates new
investment e.g. in low-carbon technologies. Better
growth may attract foreign direct investment projects
Is there a Virtuous Circle of Economic Growth?
Higher real
national output
(GDP)
Increased capital
spending
Increased output
per head
(productivity)
Increased wages /
real incomes for
people
Rising consumer
spending on
goods and
services
Benefits from Growth driven by Technological Change
A rise in
productivity
• Higher GDP per worker
• Lower unit costs
• Higher wages
• Higher profits
New
Goods
and
Services
• Lower real prices
• Consumer welfare
gains (lower prices)
• Improved living
standards
Improved
health
• Healthy life
expectancy
• Labour force expands
• Increased productivity
Three Perspectives on Economic Growth
Balanced Growth Sustainable Growth Inclusive Growth
Sector balance e.g.
between industries
Meets the needs of
current generations
without limiting
resources for future
generations
Benefits of growth
widely distributed
• Regional balance
Rising median per capita
incomes
• Urban / rural balance Macroeconomic stability
Progress in reducing
relative poverty
• Internal v external
balance (e.g. BoP)
Financial stability
Improving opportunities
for all groups
• Balance between
consumption and
investment
Environmental
sustainability –
protection of natural
capital
Measures to tackle
discrimination and
barriers for affected
groups
• Many African countries feature in a league table of the world’s fastest
growing countries both in recent years and in the forecast
• What factors have contributed to rapid economic growth?
Rapid Economic Growth in Africa
• What factors have contributed to rapid economic growth?
1. Improvement in the terms of trade – higher commodity prices have boosted
export revenues for many countries
2. Improved governance – wider spread of democratic governments allied to
improved institutions e.g. more countries are able to issue bonds
3. Strongly increasing foreign direct investment – especially in agriculture,
mining, oil and gas, infrastructure, hotels/restaurants
4. Increasing intra-regional trade including manufactured goods – emergence
of key African regional trade hubs bolstered by infrastructure spending
5. Improved macroeconomic management – lower inflation, more credible
central banks, improved fiscal balances
6. Rising per capita incomes – growth of consumer markets – poverty rates
continue to fall but social progress has been uneven
7. There is some evidence that a growing number of African countries are
becoming less dependent on primary commodities and building a more
diversified manufacturing / services base for their economy.
Analysing Causes of Economic Growth in Africa
Building Trust / Social
Capital
Growing Intra-Regional
Trade
Improving Institutions
Growing a Dynamic
Private Sector
Sound Macro Policies to
control inflation
Focusing on addressing
Equity / Fairness
How Best to Sustain Economic Growth in the Long Run
Attractive rates of
corporation tax
Soft loans and tax
reliefs / other subsidies
Trade and Investment
Agreements
Flexible labour markets
Special Economic Zones
High quality
infrastructure
Open capital markets to
allow remitted profits
Availability of low cost
labour
Many countries rely on foreign direct investment (FDI) as a key
source of extra demand and as a driver of growth
Policies to attract Inward Foreign Investment
High rates of GDP growth can bring about undesirable economic
and social costs – much depends on the nature of growth
Risks of higher inflation and higher interest rates
• Fast-growing demand can lead to demand-pull and cost-push inflation –
this leads to a conflict between macro objectives
• The central bank may decide to raise interest rates to control inflation
Environmental effects
• More negative externalities such as pollution & waste
• Risk of unsustainable extraction of finite resources – i.e. fast growing
countries may cause a long-run depletion of natural resources
Inequalities of income and wealth
• Rapid increases in real national income can lead to a higher level of
inequality and social divisions
• Many of the gains from growth may go to only a few people
Economic and Social Costs of Growth
Greenhouse Gas and C02 Emissions in the UK
Greenhouse gas emissions in the UK from 2001 to 2014, (in million tonnes
carbon dioxide equivalent)
725
704 711 706 697 690 677
657
599 613
566
582 568
520
568
550 561 561 558 556 547 533
482
501
458
476 467
422
0
100
200
300
400
500
600
700
800
2001 2002 2003 2004 2005 2006 2007 2008 2009 2010 2011 2012 2013 2014*
Milliontonnescarbondioxideequivalent
Greenhouse gas emissions Carbon dioxide emissions
Recent Economic Growth in the BRIC Countries
Source: HM-Treasury Databank
Brazil Russia India China
Year Per cent Per cent Per cent Per cent
2007 6.0 8.5 9.8 14.2
2008 5.0 5.2 3.9 9.6
2009 -0.2 -7.8 8.5 9.2
2010 7.6 4.5 10.3 10.4
2011 3.9 4.3 6.6 9.3
2012 1.8 3.4 5.1 7.8
2013 2.7 1.3 6.9 7.8
2014 0.1 0.6 7.2 7.4
2015
Main Sources of Economic Growth in China
China has experienced rapid growth over the last twenty years
helping to lift hundreds of millions of people out of deep poverty
• Real GDP growth in China has been over 9% per year since 1979
• 60-70% has come from increasing capital and labour inputs –
there has been a vast increase in capital investment spending
• 30-40% has come from rising factor productivity (i.e. increasing
efficiency in the allocation of labour & capital resources)
• Looking at increases in per capita output research finds that:
1. 11-14% from improving human capital (quality of labour)
2. 8-14% from improving allocative efficiency (e.g. moving from
state-owned businesses to private and from rural to urban)
3. 16-17% has come from the productivity-enhancing effects of
innovation – much of which has been the imitation of ideas
Growth Challenges for China in the Years Ahead
China is now in a period of transition away from the fast
export and investment-led growth of the last 20 years.
The service sector is likely to take a bigger share of GDP
in the years ahead. In 2014, it still accounted for less
than 50 per cent of Chinese national output.
Chinese Reform Challenges
1. More reliance on their
own domestic market
and less on exports
2. Raise consumption and
reduce inefficient
savings
3. Grow the private sector
and reduce distortions
from state-owned sector
4. Increase the pace of
innovation as imitation
limits are reached
5. Continue to integrate the
Chinese economy into
the global economic /
financial system. This
includes many more
Chinese firms going
0.0%
10.0%
20.0%
30.0%
40.0%
50.0%
60.0%
70.0%
80.0%
90.0%
100.0%
2004 2005 2006 2007 2008 2009 2010 2011 2012 2013 2014
ShareofGDP
Agriculture Industry Services
Some Key Constraints on Economic Growth
Infrastructure
Gaps
Primary Export
Dependency
Macroeconomic
Instability
Endemic Conflict
and Corruption
Human Capital
Weaknesses
Insufficient
Private Savings
Natural Capital
being Depleted
Rising Income
Inequality
Although many developing countries have enjoyed rapid growth in
recent years, for others there are crucial growth constraints
Savings Gaps: Importance of Savings and Investment
Increase
national
savings
Increase in
net
investment
Larger
capital
stock
Rise in real
GDP / GNI
Increased
per capita
incomes
How a savings gap can limit
economic growth:
• In many smaller low-
income countries, high
levels of extreme
poverty make it almost
impossible to generate
sufficient savings to
provide the funds
needed to fund capital
investment projects.
• This increases reliance
on tied overseas aid
• Some countries borrow
heavily to fund capital
investment projects –
this can lead to a high
level of external debt
Deficiencies in Human Capital as Barrier to Growth
Human capital weakness
limits the positive impact of
capital investment
Investment increases the size of
the capital stock and helps to
achieve “capital deepening”
(more capital per worker) but
businesses need skills and
experience to make best use of
new technologies
In many countries there are acute
shortages of human capital
Some countries lose some of their
skilled workforce to other
countries through a brain drain
Investment in education and training to increase the quality of the
labour force and make people more flexible in the labour market
Economic Growth – Causes and Impact
EdExcel AS Economics 2.1.1 and 2.5.4

Economic growth causes_impact

  • 1.
    Economic Growth –Causes and Impact EdExcel AS Economics 2.1.1 and 2.5.4
  • 2.
    Fastest Growing Countriesin 2015 19.33% 9.19% 9% 8.56% 8.33% 7.75% 7.59% 7.56% 7.46% 7.31% 7.23% 7.2% 7.13% 7% 6.86% 0.0% 5.0% 10.0% 15.0% 20.0% 25.0% Papua New Guinea Congo Turkmenistan Ethiopia Myanmar Côte d'Ivoire Chad Bhutan India Lao P.D.R. Tanzania Cambodia Qatar Rwanda Kenya Real GDP growth compared to previous year (per cent), Source: IMF • Economic growth is a long-term expansion of productive potential • Short term growth is the annual % change in real national output • Long term growth is shown by an increase in trend or potential GDP and this is illustrated by an outward shift of long run aggregate supply Source: IMF
  • 3.
    0.0% 0.5% 1.0% 1.5% 2.0% 2.5% 3.0% 2010 2011 20122013 2014 2015* 2016* 2017* 2018* 2019* 2020* GDPgrowthratecomparedtopreviousyear The chart shows real GDP growth for the UK from 2010-2014. Data for 2015 onwards shows forecast growth using data from the International Monetary Fund (IMF) Source: ONS The UK Economic Cycle in Recent Years
  • 4.
    Short Run andLong Run Economic Growth Short term economic growth Cyclical changes in real GDP Changes in AD (C+I+G+X-M) Changes in short run AS Short term external shocks to both demand and supply Short term policy changes e.g. changes in interest rates Long run economic growth Potential output / trend growth Productivity of labour & capital Technological progress and strength of enterprise Changes in the labour force Investment rates
  • 5.
    Key Factors AffectingShort Run Economic Growth Interest rates set by the central bank Fiscal policy - government spending and taxation Commodity prices such as oil, gas and foodstuffs Exchange rates Trading conditions in other countries Confidence of businesses and households
  • 6.
    Short Run EconomicGrowth from Increasing AD General Price Level Real GDP GPL1 AS Y1 AD1 AD2 Y2 GPL2 An increase in AD causes an expansion of aggregate supply and a higher equilibrium level of national output (i.e. higher real GDP)
  • 7.
    Key Factors AffectingLong Run Economic Growth Investment Productivity Labour supply Research Innovation Enterprise
  • 8.
    Economic Growth usingAD-AS Diagrams General Price Level Real GDP GPL1 AS1 Y1 AD1 Yp1 LAS1 A rise in a country’s productive potential is shown by an outward shift of long run aggregate supply (i.e. LAS1 to LAS2) This means a higher level of aggregate demand can be met because of an increase in the supply capacity LAS2 AS2 AD2 Yp2Y2
  • 9.
    Economic Growth usingPPF Diagrams Economic Growth A rise in a country’s productive capacity causes the PPF to shift out from PPF1 to PPF2 and this then allows increased supply both of consumer and capital goods. Capital goods Consumer goods PPF1 PPF2 A B C D Successful supply-side policies can help to bring about an outward shift of the a country’s PPF E F
  • 10.
    Some of theKey Drivers of Economic Growth Economic growth Expanding the capital stock Increasing the active labour supply Extracting and selling natural resources Improving factor productivity Driving innovation and enterprise Economic growth is a sustained rise in a country’s productive potential and real national output The main drivers of long run economic growth are higher productivity and gains from innovation and rising real incomes for households
  • 11.
    Linking Capital Investmentto Economic Growth Injection of demand for capital goods industries Bigger capital stock can lift productivity / incomes Economies of scale & better competitiveness Investment helps to sustain export-led growth
  • 12.
    What are themain Benefits of Economic Growth? Higher living standards – i.e. Real GNI per capita – helps to lift people out of extreme poverty and improve development outcomes (e.g. rising HDI) Employment effects – sustained growth stimulates jobs and contributes to lower unemployment rates which is turn helps to reduce inequality. Fiscal dividend – higher economic growth will raise tax revenues and reduce government spending on unemployment-related welfare benefits Accelerator effect - rising growth stimulates new investment e.g. in low-carbon technologies. Better growth may attract foreign direct investment projects
  • 13.
    Is there aVirtuous Circle of Economic Growth? Higher real national output (GDP) Increased capital spending Increased output per head (productivity) Increased wages / real incomes for people Rising consumer spending on goods and services
  • 14.
    Benefits from Growthdriven by Technological Change A rise in productivity • Higher GDP per worker • Lower unit costs • Higher wages • Higher profits New Goods and Services • Lower real prices • Consumer welfare gains (lower prices) • Improved living standards Improved health • Healthy life expectancy • Labour force expands • Increased productivity
  • 15.
    Three Perspectives onEconomic Growth Balanced Growth Sustainable Growth Inclusive Growth Sector balance e.g. between industries Meets the needs of current generations without limiting resources for future generations Benefits of growth widely distributed • Regional balance Rising median per capita incomes • Urban / rural balance Macroeconomic stability Progress in reducing relative poverty • Internal v external balance (e.g. BoP) Financial stability Improving opportunities for all groups • Balance between consumption and investment Environmental sustainability – protection of natural capital Measures to tackle discrimination and barriers for affected groups
  • 16.
    • Many Africancountries feature in a league table of the world’s fastest growing countries both in recent years and in the forecast • What factors have contributed to rapid economic growth? Rapid Economic Growth in Africa
  • 17.
    • What factorshave contributed to rapid economic growth? 1. Improvement in the terms of trade – higher commodity prices have boosted export revenues for many countries 2. Improved governance – wider spread of democratic governments allied to improved institutions e.g. more countries are able to issue bonds 3. Strongly increasing foreign direct investment – especially in agriculture, mining, oil and gas, infrastructure, hotels/restaurants 4. Increasing intra-regional trade including manufactured goods – emergence of key African regional trade hubs bolstered by infrastructure spending 5. Improved macroeconomic management – lower inflation, more credible central banks, improved fiscal balances 6. Rising per capita incomes – growth of consumer markets – poverty rates continue to fall but social progress has been uneven 7. There is some evidence that a growing number of African countries are becoming less dependent on primary commodities and building a more diversified manufacturing / services base for their economy. Analysing Causes of Economic Growth in Africa
  • 18.
    Building Trust /Social Capital Growing Intra-Regional Trade Improving Institutions Growing a Dynamic Private Sector Sound Macro Policies to control inflation Focusing on addressing Equity / Fairness How Best to Sustain Economic Growth in the Long Run
  • 19.
    Attractive rates of corporationtax Soft loans and tax reliefs / other subsidies Trade and Investment Agreements Flexible labour markets Special Economic Zones High quality infrastructure Open capital markets to allow remitted profits Availability of low cost labour Many countries rely on foreign direct investment (FDI) as a key source of extra demand and as a driver of growth Policies to attract Inward Foreign Investment
  • 20.
    High rates ofGDP growth can bring about undesirable economic and social costs – much depends on the nature of growth Risks of higher inflation and higher interest rates • Fast-growing demand can lead to demand-pull and cost-push inflation – this leads to a conflict between macro objectives • The central bank may decide to raise interest rates to control inflation Environmental effects • More negative externalities such as pollution & waste • Risk of unsustainable extraction of finite resources – i.e. fast growing countries may cause a long-run depletion of natural resources Inequalities of income and wealth • Rapid increases in real national income can lead to a higher level of inequality and social divisions • Many of the gains from growth may go to only a few people Economic and Social Costs of Growth
  • 21.
    Greenhouse Gas andC02 Emissions in the UK Greenhouse gas emissions in the UK from 2001 to 2014, (in million tonnes carbon dioxide equivalent) 725 704 711 706 697 690 677 657 599 613 566 582 568 520 568 550 561 561 558 556 547 533 482 501 458 476 467 422 0 100 200 300 400 500 600 700 800 2001 2002 2003 2004 2005 2006 2007 2008 2009 2010 2011 2012 2013 2014* Milliontonnescarbondioxideequivalent Greenhouse gas emissions Carbon dioxide emissions
  • 22.
    Recent Economic Growthin the BRIC Countries Source: HM-Treasury Databank Brazil Russia India China Year Per cent Per cent Per cent Per cent 2007 6.0 8.5 9.8 14.2 2008 5.0 5.2 3.9 9.6 2009 -0.2 -7.8 8.5 9.2 2010 7.6 4.5 10.3 10.4 2011 3.9 4.3 6.6 9.3 2012 1.8 3.4 5.1 7.8 2013 2.7 1.3 6.9 7.8 2014 0.1 0.6 7.2 7.4 2015
  • 23.
    Main Sources ofEconomic Growth in China China has experienced rapid growth over the last twenty years helping to lift hundreds of millions of people out of deep poverty • Real GDP growth in China has been over 9% per year since 1979 • 60-70% has come from increasing capital and labour inputs – there has been a vast increase in capital investment spending • 30-40% has come from rising factor productivity (i.e. increasing efficiency in the allocation of labour & capital resources) • Looking at increases in per capita output research finds that: 1. 11-14% from improving human capital (quality of labour) 2. 8-14% from improving allocative efficiency (e.g. moving from state-owned businesses to private and from rural to urban) 3. 16-17% has come from the productivity-enhancing effects of innovation – much of which has been the imitation of ideas
  • 24.
    Growth Challenges forChina in the Years Ahead China is now in a period of transition away from the fast export and investment-led growth of the last 20 years. The service sector is likely to take a bigger share of GDP in the years ahead. In 2014, it still accounted for less than 50 per cent of Chinese national output. Chinese Reform Challenges 1. More reliance on their own domestic market and less on exports 2. Raise consumption and reduce inefficient savings 3. Grow the private sector and reduce distortions from state-owned sector 4. Increase the pace of innovation as imitation limits are reached 5. Continue to integrate the Chinese economy into the global economic / financial system. This includes many more Chinese firms going 0.0% 10.0% 20.0% 30.0% 40.0% 50.0% 60.0% 70.0% 80.0% 90.0% 100.0% 2004 2005 2006 2007 2008 2009 2010 2011 2012 2013 2014 ShareofGDP Agriculture Industry Services
  • 25.
    Some Key Constraintson Economic Growth Infrastructure Gaps Primary Export Dependency Macroeconomic Instability Endemic Conflict and Corruption Human Capital Weaknesses Insufficient Private Savings Natural Capital being Depleted Rising Income Inequality Although many developing countries have enjoyed rapid growth in recent years, for others there are crucial growth constraints
  • 26.
    Savings Gaps: Importanceof Savings and Investment Increase national savings Increase in net investment Larger capital stock Rise in real GDP / GNI Increased per capita incomes How a savings gap can limit economic growth: • In many smaller low- income countries, high levels of extreme poverty make it almost impossible to generate sufficient savings to provide the funds needed to fund capital investment projects. • This increases reliance on tied overseas aid • Some countries borrow heavily to fund capital investment projects – this can lead to a high level of external debt
  • 27.
    Deficiencies in HumanCapital as Barrier to Growth Human capital weakness limits the positive impact of capital investment Investment increases the size of the capital stock and helps to achieve “capital deepening” (more capital per worker) but businesses need skills and experience to make best use of new technologies In many countries there are acute shortages of human capital Some countries lose some of their skilled workforce to other countries through a brain drain Investment in education and training to increase the quality of the labour force and make people more flexible in the labour market
  • 28.
    Economic Growth –Causes and Impact EdExcel AS Economics 2.1.1 and 2.5.4