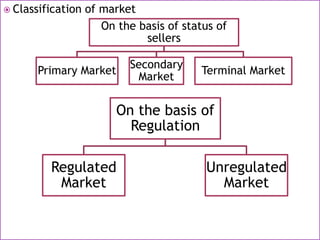
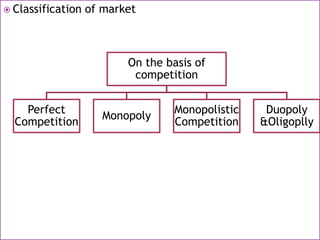
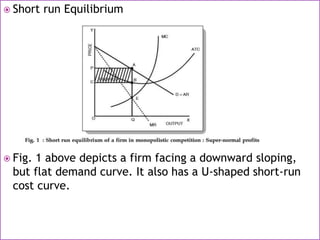
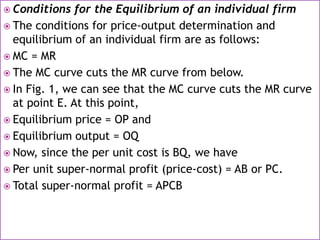
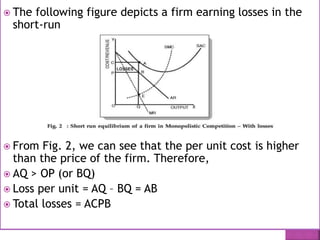
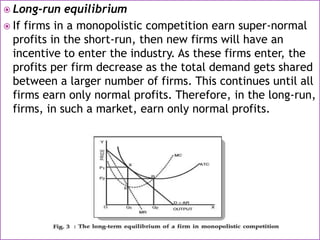
Curves are of different types and for different purposes. Some of the curves are utility curve, margin curves, demand and supply curve, offer curves, etc. International trade is based on international specialization. Copy the link given below and paste it in new browser window to get more information on Offer Curves:-
http://www.transtutors.com/homework-help/international-economics/analytical-tools/offer-curves.aspx
A market can be defined as a group of firms willing and able to sell a similar product or service to the same potential buyers.
Imperfect competition covers all situations where there is neither pure competition nor pure monopoly.
Perfect competition and pure monopoly are very unlikely to be found in the real world.
In the real world, it is the imperfect competition lying between perfect competition and pure monopoly.
The fundamental distinguishing characteristic of imperfect competition is that average revenue curve slopes downwards throughout its length, but it slopes downwards at different rates in different categories of imperfect competition.
Monopoly refers to the market situation where there is a
Single seller selling a product which has no close substitutes.
Monopolies are characterized by a lack of economic competition to produce the good or service, a lack of viable substitute goods, and the existence of a high monopoly price well above the firm's marginal cost that leads to a high monopoly profit
The word “oligopoly” comes from the Greek “oligos” meaning "little or small” and “polein” meaning “to sell.” When “oligos” is used in the plural, it means “few” ,few firms or few sellers.
DEFINATION:
Oligopoly is that form of market where there are few firms and there is natural interdependence among the firms regarding price and output policy.
This short revision video provides an overview of three forms of imperfect competition, namely monopoly, oligopoly and imperfect competition. It considers too the likely impact of each market structure on allocative, productive and dynamic efficiency.
Students should be able to:
Understand the assumptions of perfect competition and be able to explain the behaviour of firms in this market structure.
Understand the significance of firms as price-takers in perfectly competitive markets. An understanding of the meaning of shut-down point is required. The impact of entry into and exit from the industry should be considered.
This PPT includes Oligopoly Market. It is explained in detail.
This is for educational purpose only. If you own any of the content please let me know. We are not here to hurt anyone's emotion. Please try to co-operate and use this for educational purposes only.
Chapter 13A monopolistically competitive market is characterized.docxketurahhazelhurst
Chapter 13
A monopolistically competitive market is characterized by:
· many buyers and sellers,
· differentiated products, and
· easy entry and exit.
The monopolistically competitive market is similar to perfect competition in that there are many buyers and sellers who can enter or leave the market easily in response to economic profits or losses. A monopolistically competitive firm, though, is similar to a monopoly in that it produces a product that is different from that produced by all other firms in the market. The restaurant market in New York City provides a good example of a monopolistically competitive market. Each restaurant has its own recipes, decor, ambiance, etc. but also must compete with many other similar restaurants.
Because each firm produces a differentiated product, it won't lose all of its customers if it raises its prices. Thus, a monopolistically competitive firm faces a downward sloping demand curve for its product. As noted in Chapters 8 and 10, whenever a firm faces a downward sloping demand curve, its marginal revenue curve lies below its demand curve. The diagram below illustrates the relationship that exists between a monopolistically competitive firm's demand and marginal revenue curves.
While the diagram above seems similar to the demand and marginal revenue curves facing a monopolist, there is a critical difference. In a monopolistically competitive market, the number of firms changes as firms enter or leave the industry. When new firms enter the market, the customers are spread over a larger number of firms and the demand for each firm's product declines. An increase in the number of firms also tends to result in an increase in the elasticity of demand for each firm's products (since demand is more elastic when more substitutes are available). The diagram below illustrates the shift in a typical firm's demand curve that occurs when additional firms enter a monopolistically competitive market.
Short-run and long-run equilibrium in monopolistically competitive markets
Let's examine the determination of short-run equilibrium in a monopolistically competitive output market.
The diagram below illustrates a possible short-run equilibrium for a typical firm in a monopolistically competitive market. As with any profit-maximizing firm, a monopolistically competitive firm maximizes its profits by producing at a level of output at which MR = MC. In the diagram below, this occurs at an output level of Qo. The price is determined by the amount that customers are willing to pay to buy Qo units of output. In the example below, the demand curve indicates that a price of Po will be charged when Qo units of output are sold.
In a monopoly industry, economics profits could persist indefinitely due to the existence of barriers to entry. In a monopolistically competitive industry, however, the existence of economic profits results in the entry of additional firms into the industry. As additional firms enter, the demand for each ...
Labour :Time Rate -piece rate, Incentives meaning importance Taylor Differential piece rate-Halsey & rowan plans.Labour turnover meaning causes -effects-methods
Foreign economics Policies-Euro Dollar Market, International liquidity, Devaluation, World debt crisis ,Development of under developed Countries, United nations Financial programs, Economic Union & communities
International movements-meaning-Export & import of merchandise & services-International investment-International Payments, Rate of exchange, Economic integration
International Development Associations – International Finance Corporation – The International Debt and Country Analysis – Recent Changes in International Financing.
International Financial Management, Strategic Human Resource Management, Global Sourcing, Global Supply chain Management, Corporate Strategy, Production Strategy
Gains from international trade-Terms of trade-Technical progress & trade -Balance of payment-Balance of trade-economic effects and trade restrictions-Bilateralism-OPEC & other International cartels
Introduction of strategy,Levels,Meaning of International Business, Multinational corporations,advantages of Home country &host country, Challenges of Internationalbusiness
UNIT – V
Business cycles – National income, monetary and fiscal policy – Public finance. TRIM‟s- Intellectual Property rights – TRIP‟s – Industrial Sickness – causes –remedies
Cost and production analysis - Cost concepts – Cost and output relationship - cost control – Short run and Long run - cost functions - production functions – Break-even analysis - Economies scale of production.
Macroeconomics- Movie Location
This will be used as part of your Personal Professional Portfolio once graded.
Objective:
Prepare a presentation or a paper using research, basic comparative analysis, data organization and application of economic information. You will make an informed assessment of an economic climate outside of the United States to accomplish an entertainment industry objective.
A workshop hosted by the South African Journal of Science aimed at postgraduate students and early career researchers with little or no experience in writing and publishing journal articles.
This slide is special for master students (MIBS & MIFB) in UUM. Also useful for readers who are interested in the topic of contemporary Islamic banking.
How to Add Chatter in the odoo 17 ERP ModuleCeline George
In Odoo, the chatter is like a chat tool that helps you work together on records. You can leave notes and track things, making it easier to talk with your team and partners. Inside chatter, all communication history, activity, and changes will be displayed.
How to Build a Module in Odoo 17 Using the Scaffold MethodCeline George
Odoo provides an option for creating a module by using a single line command. By using this command the user can make a whole structure of a module. It is very easy for a beginner to make a module. There is no need to make each file manually. This slide will show how to create a module using the scaffold method.
Safalta Digital marketing institute in Noida, provide complete applications that encompass a huge range of virtual advertising and marketing additives, which includes search engine optimization, virtual communication advertising, pay-per-click on marketing, content material advertising, internet analytics, and greater. These university courses are designed for students who possess a comprehensive understanding of virtual marketing strategies and attributes.Safalta Digital Marketing Institute in Noida is a first choice for young individuals or students who are looking to start their careers in the field of digital advertising. The institute gives specialized courses designed and certification.
for beginners, providing thorough training in areas such as SEO, digital communication marketing, and PPC training in Noida. After finishing the program, students receive the certifications recognised by top different universitie, setting a strong foundation for a successful career in digital marketing.
Strategies for Effective Upskilling is a presentation by Chinwendu Peace in a Your Skill Boost Masterclass organisation by the Excellence Foundation for South Sudan on 08th and 09th June 2024 from 1 PM to 3 PM on each day.
A Strategic Approach: GenAI in EducationPeter Windle
Artificial Intelligence (AI) technologies such as Generative AI, Image Generators and Large Language Models have had a dramatic impact on teaching, learning and assessment over the past 18 months. The most immediate threat AI posed was to Academic Integrity with Higher Education Institutes (HEIs) focusing their efforts on combating the use of GenAI in assessment. Guidelines were developed for staff and students, policies put in place too. Innovative educators have forged paths in the use of Generative AI for teaching, learning and assessments leading to pockets of transformation springing up across HEIs, often with little or no top-down guidance, support or direction.
This Gasta posits a strategic approach to integrating AI into HEIs to prepare staff, students and the curriculum for an evolving world and workplace. We will highlight the advantages of working with these technologies beyond the realm of teaching, learning and assessment by considering prompt engineering skills, industry impact, curriculum changes, and the need for staff upskilling. In contrast, not engaging strategically with Generative AI poses risks, including falling behind peers, missed opportunities and failing to ensure our graduates remain employable. The rapid evolution of AI technologies necessitates a proactive and strategic approach if we are to remain relevant.
June 3, 2024 Anti-Semitism Letter Sent to MIT President Kornbluth and MIT Cor...Levi Shapiro
Letter from the Congress of the United States regarding Anti-Semitism sent June 3rd to MIT President Sally Kornbluth, MIT Corp Chair, Mark Gorenberg
Dear Dr. Kornbluth and Mr. Gorenberg,
The US House of Representatives is deeply concerned by ongoing and pervasive acts of antisemitic
harassment and intimidation at the Massachusetts Institute of Technology (MIT). Failing to act decisively to ensure a safe learning environment for all students would be a grave dereliction of your responsibilities as President of MIT and Chair of the MIT Corporation.
This Congress will not stand idly by and allow an environment hostile to Jewish students to persist. The House believes that your institution is in violation of Title VI of the Civil Rights Act, and the inability or
unwillingness to rectify this violation through action requires accountability.
Postsecondary education is a unique opportunity for students to learn and have their ideas and beliefs challenged. However, universities receiving hundreds of millions of federal funds annually have denied
students that opportunity and have been hijacked to become venues for the promotion of terrorism, antisemitic harassment and intimidation, unlawful encampments, and in some cases, assaults and riots.
The House of Representatives will not countenance the use of federal funds to indoctrinate students into hateful, antisemitic, anti-American supporters of terrorism. Investigations into campus antisemitism by the Committee on Education and the Workforce and the Committee on Ways and Means have been expanded into a Congress-wide probe across all relevant jurisdictions to address this national crisis. The undersigned Committees will conduct oversight into the use of federal funds at MIT and its learning environment under authorities granted to each Committee.
• The Committee on Education and the Workforce has been investigating your institution since December 7, 2023. The Committee has broad jurisdiction over postsecondary education, including its compliance with Title VI of the Civil Rights Act, campus safety concerns over disruptions to the learning environment, and the awarding of federal student aid under the Higher Education Act.
• The Committee on Oversight and Accountability is investigating the sources of funding and other support flowing to groups espousing pro-Hamas propaganda and engaged in antisemitic harassment and intimidation of students. The Committee on Oversight and Accountability is the principal oversight committee of the US House of Representatives and has broad authority to investigate “any matter” at “any time” under House Rule X.
• The Committee on Ways and Means has been investigating several universities since November 15, 2023, when the Committee held a hearing entitled From Ivory Towers to Dark Corners: Investigating the Nexus Between Antisemitism, Tax-Exempt Universities, and Terror Financing. The Committee followed the hearing with letters to those institutions on January 10, 202
2. UNIT - IV
Pricing and output decisions in different market situations
– Monopoly and Duopoly competition - _Perfect and
Imperfect - Pricing policies.
3. MARKET STRUCTURES
It is a public Place in which goods & services are brought
& sold.
Market is derived from the Latin Word”Mercatus” from
the verb “mercari”which means” to trade”.
According to Prof samuelson “ A market is a mechanism by
which buyers and sellers interact to determine the price
and quantity of a good or service”
4. Basic Components of a market
There should be buyers &sellers
There should be contact between buyer & sellers
Buyers & sellers should deal with the same commodity
There should be a price for the commodity.
Features of market
Commodity
Buyers &sellers
Communication
Place/Area
Price
5. Product Market& factor Market
Product market: Buying & selling of a commodity
Factor Market: There is a market for factors of production
Classification of Market
On the basis of area
On the basis of time
On the basis of nature of transactions
On the basis of volume of business
On the basis of status of sellers
On the basis of regulation
6. Classification of market
On the basis of area
Local Market
National
Market
International
Market
On the basis of Time
Short Period
Very short
period
Long Period
Very long
Period
7. Classification of market
On the basis of nature
of transactions
Spot
Market
Future
Market
On the basis
of volume of
busines
Whole Sale
Market
Retail market
8. Classification of market
On the basis of status of
sellers
Primary Market
Secondary
Market
Terminal Market
On the basis of
Regulation
Regulated
Market
Unregulated
Market
9. Classification of market
On the basis of
competition
Perfect
Competition
Monopoly
Monopolistic
Competition
Duopoly
&Oligoplly
10. PERFECT COMPETITION
In perfect competition, there are large number of buyers
& sellers and the actions of individual buyers & sellers
cannot influence the market price.
Features of Perfect Competition
Large numbers of buyer
Homogenous Product
Free entry & exit conditions
Absence of govt or artificial restriction
Perfect knowledge on the part of buyers & sellers
Perfect mobility of factors of production
Absence of transportation cost.
11. Conditions of Perfect Competition
A firm in a perfectly competitive market may generate a
profit in the short-run, but in the long-run it will have
economic profits of zero.
Perfect Competition in the Short Run: In the short run,
it is possible for an individual firm to make an economic
profit. This scenario is shown in this diagram, as the price
or average revenue, denoted by P, is above the average
cost denoted by C.
12. Long Run
Perfect Competition in the Long Run: In the long-run,
economic profit cannot be sustained. The arrival of new
firms in the market causes the demand curve of each
individual firm to shift downward, bringing down the
price, the average revenue and marginal revenue curve.
In the long-run, the firm will make zero economic profit.
Its horizontal demand curve will touch its average total
cost curve at its lowest point.
13. Demand Curve in Perfect Competition
A perfectly competitive firm faces a demand curve is a
horizontal line equal to the equilibrium price of the entire
market.
In a perfectly competitive market the market demand curve is
a downward sloping line, reflecting the fact that as the price
of an ordinary good increases, the quantity demanded of that
good decreases. Price is determined by the intersection of
market demand and market supply; individual firms do not
have any influence on the market price in perfect
competition. Once the market price has been determined by
market supply and demand forces, individual firms become
price takers. Individual firms are forced to charge the
equilibrium price of the market or consumers will purchase the
product from the numerous other firms in the market charging
a lower price (keep in mind the key conditions of perfect
competition). The demand curve for an individual firm is thus
equal to the equilibrium price of the market.
14. DEMAND CURVE UNDER PREFECT COMPETATION
Demand Curve for a Firm in a Perfectly Competitive
Market: The demand curve for an individual firm is equal
to the equilibrium price of the market. The market
demand curve is downward-sloping.
15. MONOPOLY
The word monopoly has been derived from the combination of
two words i.e., ‘Mono’ and ‘Poly’. Mono refers to a single and
poly to control.
In this way, monopoly refers to a market situation in which
there is only one seller of a commodity.
There are no close substitutes for the commodity it produces
and there are barriers to entry. The single producer may be in
the form of individual owner or a single partnership or a joint
stock company. In other words, under monopoly there is no
difference between firm and industry.
Definition
“Monopoly is a market situation in which there is a single seller.
There are no close substitutes of the commodity it produces,
there are barriers to entry”. -Koutsoyiannis
16. Features of Monopoly
One Seller and Large Number of Buyers
No Close Substitutes
Difficulty of Entry of New Firms
Monopoly is also an Industry
Price Maker
Industrial Monopolies or Public Monopolies
17. Nature of Demand and Revenue under Monopoly:
In a monopoly situation, there is no difference between firm and industry.
Therefore, under monopoly, firm’s demand curve constitutes the industry’s
demand curve. Since the demand curve of the consumer slopes downward
from left to right, the monopolist faces a downward sloping demand curve.
It means, if the monopolist reduces the price of the product, demand of
that product will increase and vice- versa.
In Fig. 1 average revenue curve of the monopolist slopes downward from
left to right. Marginal revenue (MR) also falls and slopes downward from
left to right. MR curve is below AR curve showing that at OQ output,
average revenue (= Price) is PQ where as marginal revenue is MQ. That way
AR > MR or PQ > MQ.
18. MONOPOLY EQUILIBRIUM AND LAWS OF COSTS
Increasing Costs:
If the monopolist produces the commodity under the law of Diminishing
Returns or Increasing costs, he will get the maximum profit at point E
where marginal revenue is equal to marginal cost. This is indicated in Fig.
7. Here he produces OM units of the commodity and gets PM as the price.
His monopoly profit is represented by the shaded area PQRS. No other
alternative will give him this much of profit and hence this is the best
position for him provided he produces goods under the Law of Increasing
Costs.
19. Diminishing Costs:
The same approach will be applicable under the Law of Increasing Returns
or Diminishing Cost as explained in Fig. 8. Here AC and MC are falling. The
MC and MR are equal at point E. accordingly; the monopolist will produce
OM units of commodity and sell the same at PM Price. His net monopoly
revenue will be PQRS indicated by shaded area.
20. Constant Costs:
The determination of monopoly price under constant costs can be shown
with the help of Fig. 9. In the diagram, the AC curve will be a horizontal
line running parallel to OX and for all the levels of output AC will be equal
to MC. AR and MR represent the average revenue curve and marginal
revenue curve respectively. The equilibrium between MC and MR is brought
at point E when the output is OM. Thus, the monopolist will produce OM
and will sell it at PM Price. The monopoly profit will, therefore, be equal to
PERS which is represented by the shaded area.
21. MONOPOLISTIC COMPETATION
Monopolistic competition is a market structure which
combines elements of monopoly and competitive
markets. Essentially a monopolistic competitive market is
one with freedom of entry and exit, but firms can
differentiate their products. Therefore, they have an
inelastic demand curve and so they can set prices.
However, because there is freedom of entry, supernormal
profits will encourage more firms to enter the market
leading to normal profits in the long term.
Definition: a market structure with a large number of
firms producing similar but differentiated products.
Barriers to entry and exit the market are low. Firms are
price makers as each firm possesses some market power.
22. Features of Monopolistic Competation
Large Number of Buyers and Sellers
Free Entry and Exit of Firms
Product Differentiation
Selling Cost
Lack of Perfect Knowledge
Less Mobility
More Elastic Demand
23. Price-output determination under Monopolistic
Competition: Equilibrium of a firm
In monopolistic competition, since the product is
differentiated between firms, each firm does not have a
perfectly elastic demand for its products. In such a
market, all firms determine the price of their own
products. Therefore, it faces a downward sloping demand
curve. Overall, we can say that the elasticity of
demand increases as the differentiation between
products decreases
24. Short run Equilibrium
Fig. 1 above depicts a firm facing a downward sloping,
but flat demand curve. It also has a U-shaped short-run
cost curve.
25. Conditions for the Equilibrium of an individual firm
The conditions for price-output determination and
equilibrium of an individual firm are as follows:
MC = MR
The MC curve cuts the MR curve from below.
In Fig. 1, we can see that the MC curve cuts the MR curve
at point E. At this point,
Equilibrium price = OP and
Equilibrium output = OQ
Now, since the per unit cost is BQ, we have
Per unit super-normal profit (price-cost) = AB or PC.
Total super-normal profit = APCB
26. The following figure depicts a firm earning losses in the
short-run
From Fig. 2, we can see that the per unit cost is higher
than the price of the firm. Therefore,
AQ > OP (or BQ)
Loss per unit = AQ – BQ = AB
Total losses = ACPB
27. Long-run equilibrium
If firms in a monopolistic competition earn super-normal
profits in the short-run, then new firms will have an
incentive to enter the industry. As these firms enter, the
profits per firm decrease as the total demand gets shared
between a larger number of firms. This continues until all
firms earn only normal profits. Therefore, in the long-run,
firms, in such a market, earn only normal profits.
28. As we can see in Fig. 3 above, the average revenue (AR)
curve touches the average cost (ATC) curve at point X.
This corresponds to quantity Q1 and price P1. Now, at
equilibrium (MC = MR), all super-normal profits are zero
since the average revenue = average costs. Therefore, all
firms earn zero super-normal profits or earn only normal
profits
It is important to note that in the long-run, a firm is in an
equilibrium position having excess capacity. In simple
words, it produces a lower quantity than its full capacity.
From Fig. 3 above, we can see that the firm can increase
its output from Q1 to Q2 and reduce average costs.
However, it does not do so because it reduces the average
revenue more than the average costs. Hence, we can
conclude that in monopolistic competition, firms do not
operate optimally. There always exists an excess capacity
of production with each firm.
29. OLIGOPOLY
Oligopoly is a situation in which few large firms compete
against each other and there is an element of
interdependence in the decision making of these firms. A
policy change on the part of one firm will have immediate
effects on competitors who react with their counter
policies.
Features
Small number of large sellers
Interdependence
Price rigidity
Monopoly element
Advertising
Group Behavior
Indeterminate demand curve
30.
31. Pricing Under Oligopoly
Kinked demand curve was used by Prof.Paul.M.Sweezy.
Kinked demand curve due to price rigidity
If the firms raise the price :- Rivals will not follow it
Elastic Demand
Inelastic Demand
MR
P
K
L
N
MR 1
B
Output
P
r
i
c
e
C
o
s
t
DPB is the demand curve
DP Elastic Demand
PB Inelastic Demand
PN is the Rigid price
32. At PN Price, the firm produces & sell ON output
If price rises above P elastic demand curve, so demand for
the firms product falls
If Price falls ,other firms follow it therefore No Increase in
sales. PB demand curve (inelastic) MR is Negative
Gap KL depends on elasticity above & below the kink
Gap is large it elasticity is greater above the kink &
Inelasticity is greater than above kink
Price willn’t change in oligopoly unless there is a drastic
change in demand & lost conditions
33. Duopoly
Duopoly means “two”& poly means “sellers
A duopoly is a situation where two companies together own all, or
nearly all, of the market for a given product or service. A duopoly is
the most basic form of oligopoly, a market dominated by a small
number of companies.
Characteristics of Duopoly
Each seller is fully aware of his rival’s motive and actions.
Both sellers may collude (they agree on all matters regarding the
sale of the commodity).
They may enter into cut-throat competition.
There is no product differentiation.
They fix the price for their product with a view to maximising their
profit
34. Cournet Model (Duopoly)
The Cournet model developed by Antoine Cournet in the
year 1838 .This model analyses the process of equilibrium
in a duopoly situation when each duopolistic assumes that
his rival will not react when he changes his output to
maximize profits.
Assumptions
Two firms, each owing an artesian mineral water well;
Both operate their wells at zero marginal cost2;
Both face a demand curve with constant negative slope;
Each seller acts on the assumption that his competitor
will not react to his decision to change his and price
35. Diagram Representation:
Cournot’s duopoly model is presented in Fig. 1. To begin
the analysis, suppose that there are only two firms. A and
B, and that, initially. A is the only seller of mineral water
in the market. In order to maximize his profits (or
revenue), he sells quantity OQ where his MC = O MR, at
price OP2 His total profit is OP2PQ.
36. Now let B enters the market. The market open to him is
QM which is half of the total market. He can sell his
product in the remaining half of the market. He assumes
that A will not change his price and output as he is making
the maximum profit i.e., A will continue to sell OQ at
price OP2 Thus, the market available to B is QM and the
demand curve is PM.
When to get maximize revenue, B sells ON at price OP1,
His total revenue is maximum at QRP’N. Note that B
supplies only QN = 1/4 = (l/2)/2 of the market.) With the
entry of B, price falls to OP1 Therefore, A’s expected
profit falls to OP1 PQ Faced with this situation, A attempts
to adjust his price and output to the changed conditions.
He assumes that B will not change his output QN and price
OP1 as he is making maximum profit.
37. Accordingly, A assumes that B will continue to supply 1/4 of
market and he has 3/4 (= 1 – 14) of the market available to
him. To maximise his profit. Supplies 1/2 of (3/4), i.e., 3/8 of
the market. Note that A’s market share has fallen from 1/2 to
3/8.
Now it is B’s turn to react. Considering Cournot’s assumption,
B assumes that A will continue to supply only 3/8 of the
market and market open to him equals 1 – 3/8 = 5/8.
In order to maximise his profit under the new conditions B
supplies 1/2 x 5/8 = 5/16 of the market. It is now for A to
reappraise the situation and adjust his price and output
accordingly.
This process of action and reaction continues in successive
periods. In the process, A continues to lose his market share
and B continues to gain. Finally situation is reached when their
market shares equal at 1/3 each.
Any further attempt to adjust output produces the same
result. The firms, therefore, reach their equilibrium position
where each one supplies one-third of the market.
38. DUOPSONY
A duopsony is an economic condition in which there are only
two large buyers for a specific product or service. Combined,
these two buyers determine market demand, giving them
considerably strong bargaining power, assuming they are
outnumbered by firms vying to sell to them.
MONOPSONY
Monopsony is a market structure in which a single buyer
substantially controls the market as the major purchaser of
goods and services offered by many would-be sellers.
The microeconomic theory of monopsony assumes a single
entity to have market power over all sellers as the only
purchaser of a good or service.
39. Pricing Policy
In business, a systematic approach is required in pricing
the commodities produced. Decision-making in this
respect is very important, as it leads to a permanent
source of revenue to the business and also survival in the
venture. It is the most important device for the firm to
expand its market.
If the price is too high, a seller may have to go out of the
market. If the price is too low, the firm may not cover its
cost and face loss. Hence, setting prices is a complex
problem. There is no cut and dried formula for fixing the
prices. It depends upon various situations in the business.
40. Objectives of Pricing Policy
Price Stabilization
Maintenance of market share
Target return on capital
Prevention of competition
Ethical pricing policy
Good return for product line
Liquidity
41. Factors Involved in Pricing Policy
Objective of the business
Cost of Production
Demand for the product
Consumer psychology & Pricing
Pricing Methods
Cost Based Pricing
Demand based Pricing
Competition Based Pricing
Other Based Pricing
42. Cost Based Pricing
Cost-based pricing refers to a pricing method in which
some percentage of desired profit margins is added to the
cost of the product to obtain the final price
It can be divided in two types cost-plus pricing and
markup pricing.
Demand-based Pricing:
Demand-based pricing refers to a pricing method in which
the price of a product is finalized according to its
demand. If the demand of a product is more, an
organization prefers to set high prices for products to gain
profit; whereas, if the demand of a product is less, the
low prices are charged to attract the customers.
43. Competition-based Pricing
Competition-based pricing refers to a method in which an
organization considers the prices of competitors’ products
to set the prices of its own products. The organization
may charge higher, lower, or equal prices as compared to
the prices of its competitors.
Other Pricing:
Value Pricing
Target Return Pricing
Going Rate Pricing
Transfer Pricing