SlideShare a Scribd company logo
Macroeconomic
Indicators
The Flow of Goods and Services
• A simple economic model illustrating the flow of goods and services though
the economy. In the model, producers are termed as "firms"
while consumers are referred to as "households." Firms supply goods and
services while households consume these goods and services. Factors of
production (land, labor, capital) are supplied by the household to firms and
the firms convert these into finished products for household consumption.
The Circular Flow Diagram
Indicators of a Country’s Aggregate Output
• The Gross Domestic Product (GDP) is the godfather of the indicator

world. As an aggregate measure of total economic production for a
country, GDP represents the market value of all goods and services
produced by the economy during the period measured, including personal
consumption, government purchases, private inventories, paid-in
construction costs and the foreign trade balance (exports are
added, imports are subtracted). 
• The GDP is an extremely comprehensive and detailed report.
• the GDP figures as reported to investors are already adjusted for inflation. In
other words, if the gross GDP was calculated to be 6% higher than the
previous year, but inflation measured 2% over the same period, GDP growth
would be reported as 4%, or the net growth over the period.

• There are those who insist that advanced economies should aim to have 0%

inflation, or in other words, stable prices. The general consensus, however, is
that a little inflation is actually a good thing.
The two aspects of the definition of GDP
• Why do we use the market value?
• What do we mean by final goods?
GDP is presented using market value of production because the economy
produces different types of goods which cannot be directly added to each
other.
The use of market values provides GDP estimates that are easy for everyone to
interpret.
The calculation of GDP only includes final goods. These goods are purchased
not for the purpose of resale or producing other goods for further sale (i.e.,
intermediate goods ) but for consumption.
In the computation of GDP, we do not include the purchase of intermediate
goods in order to avoid double-counting.
Gross National Product
• Also known as Gross National Income (GNI). Is another indicator of
output.

• GNP is calculated as the sum of GDP and the Net Factor Income Abroad
(NFIA). NFIA, as applied to the Philippines, represents the difference
between the earnings of Filipinos from activities overseas and the earnings
of foreigners in the Philippines.
Table 10.1 GDP and GNP of the Philippines, 2007

Item
Gross Domestic Product
Net Factor Income from Abroad
Gross National Product
Source: NSCB (2008a)

Value (billion pesos)
6,648.25
601.08
7,249.33
Three Approaches of Measuring GDP:
1. THE EXPENDITURE APPROACH – the sum of the spending on
different final goods and services.
• GDP
+

=

total spending on good 1 + total spending on good 2 + total spending on good 3+ …
total spending on good n

2. THE INCOME APPROACH – the sum of the payments to the different
factors of production.
• GDP

=

wages + interest payment + rents + profits
3. THE VALUE ADDED APPROACH – the sum of the value added of each
firm.

•
• GDP

Value Added – the difference between the sales of the firm and its spending
on goods produced by other firms.
=

value added of firm 1 + value added of firm 2 + value added of firm 3 + … + value
added of firm n
Equivalence of the Three Approaches
Value of Sales

2, 000

Costs of Production
Wages

200

Rent

200

Interest

200

Purchases from other firms

600

Profits

• Value Added = Sales – Purchases from other firms
= 2, 000 – 600
= 1, 400

800
• Notice that we will get the same value if we add up on the different sources
of “income.” That is,
Income = wages + rents + interest + profits
= 200 + 200 + 200 + 800
= 1, 400

• Since the income and expenditure approaches are equivalent, it follows that
the expenditure and value added approaches are also equivalent.
Item

in million pesos

as a percentage of GDP

Expenditure Approach
Household Final Consumption Expenditure

2,078,327

73.0

Government Final Consumption Expenditure

381,052

13.4

Capital Formation

511,055

18.0

Exports of Goods and Services

785,340

27.6

(883,749)

(31.0)

(25,636)

(.9)

2,846,389

100.0

Agriculture, Hunting, Forestry, and Fishing

284, 945

10.0

Industry

865,114

30.4

Services

1,696,330

59.6

Gross Domestic Product

2,846,389

100.0

Less: Imports of Goods and Services
Statistical Discrepancy
Gross Domestic Product
Value Added Approach
Using GDP or GNP to Gauge a Nation’s
Economic Health
• GNP at current prices or Nominal GNP – is calculated using the prices
that exist for the year it is computed.

• GNP at constant prices or Real GNP – is calculated by dividing the
nominal GNP by the GNP deflator and multiplying the result by 100. This
overcomes the weakness of nominal GNP by removing the impacts of price
changes.
• GNP deflator – measures the cost of a given bundle of goods in one year relative to
the cost of the same bundle of goods in the base year.

Real GNP = (Nominal GNP/GNP Deflator) x 100
Item

2005

2006

2007

GNP at Current Prices (million pesos)

5, 891, 183. 00

6, 532, 104. 00

7, 227, 312. 00

GNP at 1985 prices (million pesos)

1, 211, 452. 00

1, 276, 156. 00

1, 366, 493. 00

486. 29

511. 86

528. 89

85. 26

86. 97

88. 71

per capita GNP at Current Prices (in pesos)

69, 096. 68

75, 107. 55

81, 471. 22

per capita GNP at 1985 Prices (in pesos)

14, 208. 91

14, 673. 52

15, 404. 05

GNP deflator
Population (million persons)

Growth rates (in percent)
GNP at Current Prices

-

10.9

10.64

GNP at 1985 prices

-

5.34

7.08

GNP deflator

-

5.25

3.33

Population

-

2.00

2.00

per capita GNP at Current Prices

-

8.70

8.47

per capita GNP at Constant Prices

-

3.27

4.98
• per capita GNP at constant prices or Real GNP per capita – is
computed by dividing the real GNP by the population of the country.

• Conversion of country’s GNP into US dollars:
GNP in US dollars

=

GNP in local currency

/

Exchange rate
Measures of economic performance for selected countries, 2007
Item
GNP (in million US dollars)
Population (in millions)
GNP per capita (in US dollars)

India

Philippines

Lithuania

1, 069, 400

142, 600

33, 500

1, 123

88

3

950

1, 620

9, 920

In recent years, economists have recognized that making cross-country
comparisons requires an adjustment to GNP that goes beyond converting its
values to US dollars. The reason is that one dollar spent in one country may not
buy the same quantity of goods in another country. Another way of putting it is
that the price of a commodity in one country is not likely to be the same in
another.
• To adjust for price differences across countries, GNP measured at domestic currency is
divided by the so-called purchasing power parity exchange rate (PPP exchange rate)

• The result is called PPP adjusted GNP . This result would then be divided by the
population to get an estimate of PPP adjusted per capita GNP.
Per capita GNP of selected countries, 2007
Country
China

in US dollars

PPP Adjusted
2, 360

5, 370

38, 860

33, 820

India

950

2, 740

Japan

37, 670

34, 600

Lithuania

9, 920

17, 180

Philippines

1, 620

3, 730

Singapore

32, 470

48, 520

Thailand

3, 400

7, 880

Germany
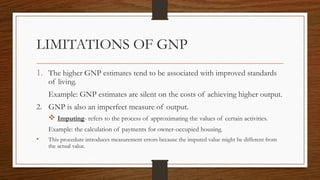
LIMITATIONS OF GNP
1. The higher GNP estimates tend to be associated with improved standards
of living.

Example: GNP estimates are silent on the costs of achieving higher output.
2. GNP is also an imperfect measure of output.
 Imputing- refers to the process of approximating the values of certain activities.
Example: the calculation of payments for owner-occupied housing.

•

This procedure introduces measurement errors because the imputed value might be different from
the actual value.
• There are also activities for which markets exist but the transactions are not reported.
Example: Drug-trafficking and prostitution

• There are also situations in which the activities are legal and markets exist but the
transactions are not reported.
Example: Peddling and trading

 The underestimation of output resulting from illegal and unreported activities is large.
INFLATION- refers to the increase in the general price level(GP)
or prices as a whole.
Two measures of the inflation rate:
1.Headline inflation rate – uses the Consumer Price Index (CPI) as a measure of the general price level. This
is the traditional and most common index of inflation.
Formula:
CPI period t - CPI period t-1
Headline inflation rate =

CPI period t-1

2. Core inflation rate- uses a price index which excludes the prices of commodities that are deemed to be
volatile.
UNEMPLOYMENT -

implies that productive
resources are not being fully utilized in the economy.

• A person is considered unemployed if he/she is not a member of the labor
force.
The term labor force refers to people of a certain age (15 years and above in
the case of the Philippines) who are:
a. working or engaged in business, and
b. not working or engaged in business but are actively looking for work.
UNEMPLOYMENT RATE- an indicator that
measure the employment situation in our country.

• We calculate the unemployment rate (U) by dividing the number of
unemployed members of the labor force by the total labor force. The result
is then multiplied by 100 so that it can be expressed as a percentage:
Unemployed members of the labor force
U=
Total labor force


Philippines

April 20131/


Population 15 years and over (in 000) 2/

64,028

62,842

Labor Force Participation Rate (%)

63.9

64.7

Employment Rate (%)

92.5

93.1

Unemployment Rate (%)

7.5

6.9

Underemployment Rate (%)

19.2

19.3

April 2012
UNDEREMPLOYMENT RATE- the portion of
employed individuals who want to work longer hours.

• This indicator is calculated using the formula below:
Underemployment Rate =

Number of people underemployed
Total employment

More Related Content

What's hot

Market failure and government interventions slides
Market failure and government interventions slidesMarket failure and government interventions slides
Market failure and government interventions slides
gilem488
 
Inflation
InflationInflation
Inflation
Sunil Meena
 
MONETARY and FISCAL POLICY-- PPT
MONETARY and FISCAL POLICY-- PPTMONETARY and FISCAL POLICY-- PPT
MONETARY and FISCAL POLICY-- PPT
Monika Himthani
 
Fiscal Policy Ppt
Fiscal Policy PptFiscal Policy Ppt
Fiscal Policy Ppt
CAG
 
National Income: Measuring National Income. Problems in the measurement of Na...
National Income: Measuring National Income. Problems in the measurement of Na...National Income: Measuring National Income. Problems in the measurement of Na...
National Income: Measuring National Income. Problems in the measurement of Na...
viveksangwan007
 
Terms of-trade
Terms of-tradeTerms of-trade
Terms of-trade
Tanu Kirttania
 
The Multiplier Effect
The Multiplier EffectThe Multiplier Effect
The Multiplier Effect
tutor2u
 
Consumption and investment function
Consumption and investment functionConsumption and investment function
Consumption and investment function
Samita Mahapatra
 
Solow model of growth
Solow model of growthSolow model of growth
Solow model of growth
Anmol Kumar Sharma
 
Determination of exchange rate chapter 6
Determination of exchange rate chapter 6Determination of exchange rate chapter 6
Determination of exchange rate chapter 6
Nayan Vaghela
 
Comparative cost advanatge theory
Comparative cost advanatge theoryComparative cost advanatge theory
Comparative cost advanatge theory
DrJagdish Maheshwari
 
Modern Theory of International Trade
Modern Theory of International TradeModern Theory of International Trade
Modern Theory of International Trade
Higher Education Department, Haryana
 
Aggregate supply
Aggregate supplyAggregate supply
Aggregate supply
Umair Aslam
 
Classical theory of employment
Classical theory of employmentClassical theory of employment
Classical theory of employment
Mahendra Kumar Ghadoliya
 
Macroeconomic Policy
Macroeconomic PolicyMacroeconomic Policy
Macroeconomic Policy
Norrenberger Financial Group
 
Basic concept of macro economics
Basic concept of macro economicsBasic concept of macro economics
Basic concept of macro economics
Raj vardhan
 
Inflation
InflationInflation
Inflation
RidaRao4
 

What's hot (20)

Market failure and government interventions slides
Market failure and government interventions slidesMarket failure and government interventions slides
Market failure and government interventions slides
 
Inflation
InflationInflation
Inflation
 
MONETARY and FISCAL POLICY-- PPT
MONETARY and FISCAL POLICY-- PPTMONETARY and FISCAL POLICY-- PPT
MONETARY and FISCAL POLICY-- PPT
 
Fiscal Policy Ppt
Fiscal Policy PptFiscal Policy Ppt
Fiscal Policy Ppt
 
National Income: Measuring National Income. Problems in the measurement of Na...
National Income: Measuring National Income. Problems in the measurement of Na...National Income: Measuring National Income. Problems in the measurement of Na...
National Income: Measuring National Income. Problems in the measurement of Na...
 
Terms of-trade
Terms of-tradeTerms of-trade
Terms of-trade
 
Philip's Curve
Philip's CurvePhilip's Curve
Philip's Curve
 
The Multiplier Effect
The Multiplier EffectThe Multiplier Effect
The Multiplier Effect
 
Consumption and investment function
Consumption and investment functionConsumption and investment function
Consumption and investment function
 
Solow model of growth
Solow model of growthSolow model of growth
Solow model of growth
 
Determination of exchange rate chapter 6
Determination of exchange rate chapter 6Determination of exchange rate chapter 6
Determination of exchange rate chapter 6
 
Comparative cost advanatge theory
Comparative cost advanatge theoryComparative cost advanatge theory
Comparative cost advanatge theory
 
Consumer Price Index
Consumer Price IndexConsumer Price Index
Consumer Price Index
 
Modern Theory of International Trade
Modern Theory of International TradeModern Theory of International Trade
Modern Theory of International Trade
 
Fiscal Policy
Fiscal PolicyFiscal Policy
Fiscal Policy
 
Aggregate supply
Aggregate supplyAggregate supply
Aggregate supply
 
Classical theory of employment
Classical theory of employmentClassical theory of employment
Classical theory of employment
 
Macroeconomic Policy
Macroeconomic PolicyMacroeconomic Policy
Macroeconomic Policy
 
Basic concept of macro economics
Basic concept of macro economicsBasic concept of macro economics
Basic concept of macro economics
 
Inflation
InflationInflation
Inflation
 

Viewers also liked

Key economic indicators 3 25_60
Key  economic indicators 3 25_60Key  economic indicators 3 25_60
Key economic indicators 3 25_60domsr
 
India macroeconomic indicators
India macroeconomic indicatorsIndia macroeconomic indicators
India macroeconomic indicatorsSoham Pablo
 
Macro Economic Environment of South Africa
Macro Economic Environment of South AfricaMacro Economic Environment of South Africa
Macro Economic Environment of South Africa
Disha Bedi
 
Macroeconomic indicators
Macroeconomic indicatorsMacroeconomic indicators
Macroeconomic indicatorslindahauck
 
Indicators Of Economic Development
Indicators Of Economic DevelopmentIndicators Of Economic Development
Indicators Of Economic DevelopmentDeighton Gooden
 
Introduction to macroeconomics
Introduction to macroeconomicsIntroduction to macroeconomics
Introduction to macroeconomicsShivam Bindra
 

Viewers also liked (6)

Key economic indicators 3 25_60
Key  economic indicators 3 25_60Key  economic indicators 3 25_60
Key economic indicators 3 25_60
 
India macroeconomic indicators
India macroeconomic indicatorsIndia macroeconomic indicators
India macroeconomic indicators
 
Macro Economic Environment of South Africa
Macro Economic Environment of South AfricaMacro Economic Environment of South Africa
Macro Economic Environment of South Africa
 
Macroeconomic indicators
Macroeconomic indicatorsMacroeconomic indicators
Macroeconomic indicators
 
Indicators Of Economic Development
Indicators Of Economic DevelopmentIndicators Of Economic Development
Indicators Of Economic Development
 
Introduction to macroeconomics
Introduction to macroeconomicsIntroduction to macroeconomics
Introduction to macroeconomics
 

Similar to Macroeconomic indicators

IFM.pptx
IFM.pptxIFM.pptx
IFM.pptx
AnjaliNenani
 
Theory and Measurement in the Macroeconomy
Theory and Measurement in the MacroeconomyTheory and Measurement in the Macroeconomy
Theory and Measurement in the Macroeconomy
Kalaiyarasi Danabalan
 
Introduction to macroeconomics
Introduction to macroeconomicsIntroduction to macroeconomics
Introduction to macroeconomics
CRYSLER TUMALE
 
MANAGERIAL_ECONOMICS_FOR_ORGANISATIONS.docx
MANAGERIAL_ECONOMICS_FOR_ORGANISATIONS.docxMANAGERIAL_ECONOMICS_FOR_ORGANISATIONS.docx
MANAGERIAL_ECONOMICS_FOR_ORGANISATIONS.docx
AbhishekModak17
 
GDP.pptx
GDP.pptxGDP.pptx
GDP.pptx
MonojitGope
 
Macro 6 macroeconomic+measures-gdp+and+economic+growth+
Macro 6 macroeconomic+measures-gdp+and+economic+growth+Macro 6 macroeconomic+measures-gdp+and+economic+growth+
Macro 6 macroeconomic+measures-gdp+and+economic+growth+
RadhakrishnanP21
 
Macro Economics short lecture note ppt.pptx
Macro Economics short  lecture note ppt.pptxMacro Economics short  lecture note ppt.pptx
Macro Economics short lecture note ppt.pptx
etebarkhmichale
 
483159831-gdp-ppt.ppt
483159831-gdp-ppt.ppt483159831-gdp-ppt.ppt
483159831-gdp-ppt.ppt
GetachewGurmu
 
MACROECONOMICS-CH2
MACROECONOMICS-CH2MACROECONOMICS-CH2
MACROECONOMICS-CH2
kkjjkevin03
 
macroppts-160319095309.pptx
macroppts-160319095309.pptxmacroppts-160319095309.pptx
macroppts-160319095309.pptx
sadiqfarhan2
 
23
2323
Principles of Macroeconomics Notes
Principles of Macroeconomics NotesPrinciples of Macroeconomics Notes
Principles of Macroeconomics Notes
Laurel Ayuyao
 
(9) Macroeconomic Analysis - Part I.pdf
(9) Macroeconomic Analysis - Part I.pdf(9) Macroeconomic Analysis - Part I.pdf
(9) Macroeconomic Analysis - Part I.pdf
Ahmed55623
 
Macro Economics_I.pptx macro ppt introduction slides
Macro Economics_I.pptx macro ppt introduction slidesMacro Economics_I.pptx macro ppt introduction slides
Macro Economics_I.pptx macro ppt introduction slides
Alka392097
 
Presentation macroeconomic aggregate
Presentation macroeconomic aggregatePresentation macroeconomic aggregate
Presentation macroeconomic aggregatesuvarnapstpl
 
Macro Economics PPT
Macro Economics PPT Macro Economics PPT
Macro Economics PPT
M Asif Bhat
 
National Income
National IncomeNational Income
National IncomeRuna Lobo
 
National income
National incomeNational income
National income
lovely haryani
 

Similar to Macroeconomic indicators (20)

IFM.pptx
IFM.pptxIFM.pptx
IFM.pptx
 
Theory and Measurement in the Macroeconomy
Theory and Measurement in the MacroeconomyTheory and Measurement in the Macroeconomy
Theory and Measurement in the Macroeconomy
 
Introduction to macroeconomics
Introduction to macroeconomicsIntroduction to macroeconomics
Introduction to macroeconomics
 
MANAGERIAL_ECONOMICS_FOR_ORGANISATIONS.docx
MANAGERIAL_ECONOMICS_FOR_ORGANISATIONS.docxMANAGERIAL_ECONOMICS_FOR_ORGANISATIONS.docx
MANAGERIAL_ECONOMICS_FOR_ORGANISATIONS.docx
 
GDP.pptx
GDP.pptxGDP.pptx
GDP.pptx
 
Macro 6 macroeconomic+measures-gdp+and+economic+growth+
Macro 6 macroeconomic+measures-gdp+and+economic+growth+Macro 6 macroeconomic+measures-gdp+and+economic+growth+
Macro 6 macroeconomic+measures-gdp+and+economic+growth+
 
Macro Economics short lecture note ppt.pptx
Macro Economics short  lecture note ppt.pptxMacro Economics short  lecture note ppt.pptx
Macro Economics short lecture note ppt.pptx
 
483159831-gdp-ppt.ppt
483159831-gdp-ppt.ppt483159831-gdp-ppt.ppt
483159831-gdp-ppt.ppt
 
MACROECONOMICS-CH2
MACROECONOMICS-CH2MACROECONOMICS-CH2
MACROECONOMICS-CH2
 
macroppts-160319095309.pptx
macroppts-160319095309.pptxmacroppts-160319095309.pptx
macroppts-160319095309.pptx
 
23
2323
23
 
Principles of Macroeconomics Notes
Principles of Macroeconomics NotesPrinciples of Macroeconomics Notes
Principles of Macroeconomics Notes
 
(9) Macroeconomic Analysis - Part I.pdf
(9) Macroeconomic Analysis - Part I.pdf(9) Macroeconomic Analysis - Part I.pdf
(9) Macroeconomic Analysis - Part I.pdf
 
Macro Economics_I.pptx macro ppt introduction slides
Macro Economics_I.pptx macro ppt introduction slidesMacro Economics_I.pptx macro ppt introduction slides
Macro Economics_I.pptx macro ppt introduction slides
 
Presentation macroeconomic aggregate
Presentation macroeconomic aggregatePresentation macroeconomic aggregate
Presentation macroeconomic aggregate
 
Macro Economics PPT
Macro Economics PPT Macro Economics PPT
Macro Economics PPT
 
Chapter 2
Chapter 2Chapter 2
Chapter 2
 
National Income
National IncomeNational Income
National Income
 
National income
National incomeNational income
National income
 
national income
national incomenational income
national income
 

Recently uploaded

Digital Tools and AI for Teaching Learning and Research
Digital Tools and AI for Teaching Learning and ResearchDigital Tools and AI for Teaching Learning and Research
Digital Tools and AI for Teaching Learning and Research
Vikramjit Singh
 
Palestine last event orientationfvgnh .pptx
Palestine last event orientationfvgnh .pptxPalestine last event orientationfvgnh .pptx
Palestine last event orientationfvgnh .pptx
RaedMohamed3
 
aaaaaaaaaaaaaaaaaaaaaaaaaaaaaaaaaaaaaaaaa
aaaaaaaaaaaaaaaaaaaaaaaaaaaaaaaaaaaaaaaaaaaaaaaaaaaaaaaaaaaaaaaaaaaaaaaaaaaaaaaaaa
aaaaaaaaaaaaaaaaaaaaaaaaaaaaaaaaaaaaaaaaa
siemaillard
 
Language Across the Curriculm LAC B.Ed.
Language Across the  Curriculm LAC B.Ed.Language Across the  Curriculm LAC B.Ed.
Language Across the Curriculm LAC B.Ed.
Atul Kumar Singh
 
Polish students' mobility in the Czech Republic
Polish students' mobility in the Czech RepublicPolish students' mobility in the Czech Republic
Polish students' mobility in the Czech Republic
Anna Sz.
 
Unit 2- Research Aptitude (UGC NET Paper I).pdf
Unit 2- Research Aptitude (UGC NET Paper I).pdfUnit 2- Research Aptitude (UGC NET Paper I).pdf
Unit 2- Research Aptitude (UGC NET Paper I).pdf
Thiyagu K
 
special B.ed 2nd year old paper_20240531.pdf
special B.ed 2nd year old paper_20240531.pdfspecial B.ed 2nd year old paper_20240531.pdf
special B.ed 2nd year old paper_20240531.pdf
Special education needs
 
A Strategic Approach: GenAI in Education
A Strategic Approach: GenAI in EducationA Strategic Approach: GenAI in Education
A Strategic Approach: GenAI in Education
Peter Windle
 
"Protectable subject matters, Protection in biotechnology, Protection of othe...
"Protectable subject matters, Protection in biotechnology, Protection of othe..."Protectable subject matters, Protection in biotechnology, Protection of othe...
"Protectable subject matters, Protection in biotechnology, Protection of othe...
SACHIN R KONDAGURI
 
1.4 modern child centered education - mahatma gandhi-2.pptx
1.4 modern child centered education - mahatma gandhi-2.pptx1.4 modern child centered education - mahatma gandhi-2.pptx
1.4 modern child centered education - mahatma gandhi-2.pptx
JosvitaDsouza2
 
Unit 8 - Information and Communication Technology (Paper I).pdf
Unit 8 - Information and Communication Technology (Paper I).pdfUnit 8 - Information and Communication Technology (Paper I).pdf
Unit 8 - Information and Communication Technology (Paper I).pdf
Thiyagu K
 
Operation Blue Star - Saka Neela Tara
Operation Blue Star   -  Saka Neela TaraOperation Blue Star   -  Saka Neela Tara
Operation Blue Star - Saka Neela Tara
Balvir Singh
 
Additional Benefits for Employee Website.pdf
Additional Benefits for Employee Website.pdfAdditional Benefits for Employee Website.pdf
Additional Benefits for Employee Website.pdf
joachimlavalley1
 
Francesca Gottschalk - How can education support child empowerment.pptx
Francesca Gottschalk - How can education support child empowerment.pptxFrancesca Gottschalk - How can education support child empowerment.pptx
Francesca Gottschalk - How can education support child empowerment.pptx
EduSkills OECD
 
The geography of Taylor Swift - some ideas
The geography of Taylor Swift - some ideasThe geography of Taylor Swift - some ideas
The geography of Taylor Swift - some ideas
GeoBlogs
 
Adversarial Attention Modeling for Multi-dimensional Emotion Regression.pdf
Adversarial Attention Modeling for Multi-dimensional Emotion Regression.pdfAdversarial Attention Modeling for Multi-dimensional Emotion Regression.pdf
Adversarial Attention Modeling for Multi-dimensional Emotion Regression.pdf
Po-Chuan Chen
 
Instructions for Submissions thorugh G- Classroom.pptx
Instructions for Submissions thorugh G- Classroom.pptxInstructions for Submissions thorugh G- Classroom.pptx
Instructions for Submissions thorugh G- Classroom.pptx
Jheel Barad
 
Phrasal Verbs.XXXXXXXXXXXXXXXXXXXXXXXXXX
Phrasal Verbs.XXXXXXXXXXXXXXXXXXXXXXXXXXPhrasal Verbs.XXXXXXXXXXXXXXXXXXXXXXXXXX
Phrasal Verbs.XXXXXXXXXXXXXXXXXXXXXXXXXX
MIRIAMSALINAS13
 
Lapbook sobre os Regimes Totalitários.pdf
Lapbook sobre os Regimes Totalitários.pdfLapbook sobre os Regimes Totalitários.pdf
Lapbook sobre os Regimes Totalitários.pdf
Jean Carlos Nunes Paixão
 
Honest Reviews of Tim Han LMA Course Program.pptx
Honest Reviews of Tim Han LMA Course Program.pptxHonest Reviews of Tim Han LMA Course Program.pptx
Honest Reviews of Tim Han LMA Course Program.pptx
timhan337
 

Recently uploaded (20)

Digital Tools and AI for Teaching Learning and Research
Digital Tools and AI for Teaching Learning and ResearchDigital Tools and AI for Teaching Learning and Research
Digital Tools and AI for Teaching Learning and Research
 
Palestine last event orientationfvgnh .pptx
Palestine last event orientationfvgnh .pptxPalestine last event orientationfvgnh .pptx
Palestine last event orientationfvgnh .pptx
 
aaaaaaaaaaaaaaaaaaaaaaaaaaaaaaaaaaaaaaaaa
aaaaaaaaaaaaaaaaaaaaaaaaaaaaaaaaaaaaaaaaaaaaaaaaaaaaaaaaaaaaaaaaaaaaaaaaaaaaaaaaaa
aaaaaaaaaaaaaaaaaaaaaaaaaaaaaaaaaaaaaaaaa
 
Language Across the Curriculm LAC B.Ed.
Language Across the  Curriculm LAC B.Ed.Language Across the  Curriculm LAC B.Ed.
Language Across the Curriculm LAC B.Ed.
 
Polish students' mobility in the Czech Republic
Polish students' mobility in the Czech RepublicPolish students' mobility in the Czech Republic
Polish students' mobility in the Czech Republic
 
Unit 2- Research Aptitude (UGC NET Paper I).pdf
Unit 2- Research Aptitude (UGC NET Paper I).pdfUnit 2- Research Aptitude (UGC NET Paper I).pdf
Unit 2- Research Aptitude (UGC NET Paper I).pdf
 
special B.ed 2nd year old paper_20240531.pdf
special B.ed 2nd year old paper_20240531.pdfspecial B.ed 2nd year old paper_20240531.pdf
special B.ed 2nd year old paper_20240531.pdf
 
A Strategic Approach: GenAI in Education
A Strategic Approach: GenAI in EducationA Strategic Approach: GenAI in Education
A Strategic Approach: GenAI in Education
 
"Protectable subject matters, Protection in biotechnology, Protection of othe...
"Protectable subject matters, Protection in biotechnology, Protection of othe..."Protectable subject matters, Protection in biotechnology, Protection of othe...
"Protectable subject matters, Protection in biotechnology, Protection of othe...
 
1.4 modern child centered education - mahatma gandhi-2.pptx
1.4 modern child centered education - mahatma gandhi-2.pptx1.4 modern child centered education - mahatma gandhi-2.pptx
1.4 modern child centered education - mahatma gandhi-2.pptx
 
Unit 8 - Information and Communication Technology (Paper I).pdf
Unit 8 - Information and Communication Technology (Paper I).pdfUnit 8 - Information and Communication Technology (Paper I).pdf
Unit 8 - Information and Communication Technology (Paper I).pdf
 
Operation Blue Star - Saka Neela Tara
Operation Blue Star   -  Saka Neela TaraOperation Blue Star   -  Saka Neela Tara
Operation Blue Star - Saka Neela Tara
 
Additional Benefits for Employee Website.pdf
Additional Benefits for Employee Website.pdfAdditional Benefits for Employee Website.pdf
Additional Benefits for Employee Website.pdf
 
Francesca Gottschalk - How can education support child empowerment.pptx
Francesca Gottschalk - How can education support child empowerment.pptxFrancesca Gottschalk - How can education support child empowerment.pptx
Francesca Gottschalk - How can education support child empowerment.pptx
 
The geography of Taylor Swift - some ideas
The geography of Taylor Swift - some ideasThe geography of Taylor Swift - some ideas
The geography of Taylor Swift - some ideas
 
Adversarial Attention Modeling for Multi-dimensional Emotion Regression.pdf
Adversarial Attention Modeling for Multi-dimensional Emotion Regression.pdfAdversarial Attention Modeling for Multi-dimensional Emotion Regression.pdf
Adversarial Attention Modeling for Multi-dimensional Emotion Regression.pdf
 
Instructions for Submissions thorugh G- Classroom.pptx
Instructions for Submissions thorugh G- Classroom.pptxInstructions for Submissions thorugh G- Classroom.pptx
Instructions for Submissions thorugh G- Classroom.pptx
 
Phrasal Verbs.XXXXXXXXXXXXXXXXXXXXXXXXXX
Phrasal Verbs.XXXXXXXXXXXXXXXXXXXXXXXXXXPhrasal Verbs.XXXXXXXXXXXXXXXXXXXXXXXXXX
Phrasal Verbs.XXXXXXXXXXXXXXXXXXXXXXXXXX
 
Lapbook sobre os Regimes Totalitários.pdf
Lapbook sobre os Regimes Totalitários.pdfLapbook sobre os Regimes Totalitários.pdf
Lapbook sobre os Regimes Totalitários.pdf
 
Honest Reviews of Tim Han LMA Course Program.pptx
Honest Reviews of Tim Han LMA Course Program.pptxHonest Reviews of Tim Han LMA Course Program.pptx
Honest Reviews of Tim Han LMA Course Program.pptx
 

Macroeconomic indicators

  • 2. The Flow of Goods and Services • A simple economic model illustrating the flow of goods and services though the economy. In the model, producers are termed as "firms" while consumers are referred to as "households." Firms supply goods and services while households consume these goods and services. Factors of production (land, labor, capital) are supplied by the household to firms and the firms convert these into finished products for household consumption.
  • 4. Indicators of a Country’s Aggregate Output • The Gross Domestic Product (GDP) is the godfather of the indicator world. As an aggregate measure of total economic production for a country, GDP represents the market value of all goods and services produced by the economy during the period measured, including personal consumption, government purchases, private inventories, paid-in construction costs and the foreign trade balance (exports are added, imports are subtracted). 
  • 5. • The GDP is an extremely comprehensive and detailed report. • the GDP figures as reported to investors are already adjusted for inflation. In other words, if the gross GDP was calculated to be 6% higher than the previous year, but inflation measured 2% over the same period, GDP growth would be reported as 4%, or the net growth over the period. • There are those who insist that advanced economies should aim to have 0% inflation, or in other words, stable prices. The general consensus, however, is that a little inflation is actually a good thing.
  • 6. The two aspects of the definition of GDP • Why do we use the market value? • What do we mean by final goods?
  • 7. GDP is presented using market value of production because the economy produces different types of goods which cannot be directly added to each other. The use of market values provides GDP estimates that are easy for everyone to interpret.
  • 8. The calculation of GDP only includes final goods. These goods are purchased not for the purpose of resale or producing other goods for further sale (i.e., intermediate goods ) but for consumption. In the computation of GDP, we do not include the purchase of intermediate goods in order to avoid double-counting.
  • 9. Gross National Product • Also known as Gross National Income (GNI). Is another indicator of output. • GNP is calculated as the sum of GDP and the Net Factor Income Abroad (NFIA). NFIA, as applied to the Philippines, represents the difference between the earnings of Filipinos from activities overseas and the earnings of foreigners in the Philippines.
  • 10. Table 10.1 GDP and GNP of the Philippines, 2007 Item Gross Domestic Product Net Factor Income from Abroad Gross National Product Source: NSCB (2008a) Value (billion pesos) 6,648.25 601.08 7,249.33
  • 11. Three Approaches of Measuring GDP: 1. THE EXPENDITURE APPROACH – the sum of the spending on different final goods and services. • GDP + = total spending on good 1 + total spending on good 2 + total spending on good 3+ … total spending on good n 2. THE INCOME APPROACH – the sum of the payments to the different factors of production. • GDP = wages + interest payment + rents + profits
  • 12. 3. THE VALUE ADDED APPROACH – the sum of the value added of each firm. • • GDP Value Added – the difference between the sales of the firm and its spending on goods produced by other firms. = value added of firm 1 + value added of firm 2 + value added of firm 3 + … + value added of firm n
  • 13. Equivalence of the Three Approaches Value of Sales 2, 000 Costs of Production Wages 200 Rent 200 Interest 200 Purchases from other firms 600 Profits • Value Added = Sales – Purchases from other firms = 2, 000 – 600 = 1, 400 800
  • 14. • Notice that we will get the same value if we add up on the different sources of “income.” That is, Income = wages + rents + interest + profits = 200 + 200 + 200 + 800 = 1, 400 • Since the income and expenditure approaches are equivalent, it follows that the expenditure and value added approaches are also equivalent.
  • 15. Item in million pesos as a percentage of GDP Expenditure Approach Household Final Consumption Expenditure 2,078,327 73.0 Government Final Consumption Expenditure 381,052 13.4 Capital Formation 511,055 18.0 Exports of Goods and Services 785,340 27.6 (883,749) (31.0) (25,636) (.9) 2,846,389 100.0 Agriculture, Hunting, Forestry, and Fishing 284, 945 10.0 Industry 865,114 30.4 Services 1,696,330 59.6 Gross Domestic Product 2,846,389 100.0 Less: Imports of Goods and Services Statistical Discrepancy Gross Domestic Product Value Added Approach
  • 16. Using GDP or GNP to Gauge a Nation’s Economic Health • GNP at current prices or Nominal GNP – is calculated using the prices that exist for the year it is computed. • GNP at constant prices or Real GNP – is calculated by dividing the nominal GNP by the GNP deflator and multiplying the result by 100. This overcomes the weakness of nominal GNP by removing the impacts of price changes. • GNP deflator – measures the cost of a given bundle of goods in one year relative to the cost of the same bundle of goods in the base year. Real GNP = (Nominal GNP/GNP Deflator) x 100
  • 17. Item 2005 2006 2007 GNP at Current Prices (million pesos) 5, 891, 183. 00 6, 532, 104. 00 7, 227, 312. 00 GNP at 1985 prices (million pesos) 1, 211, 452. 00 1, 276, 156. 00 1, 366, 493. 00 486. 29 511. 86 528. 89 85. 26 86. 97 88. 71 per capita GNP at Current Prices (in pesos) 69, 096. 68 75, 107. 55 81, 471. 22 per capita GNP at 1985 Prices (in pesos) 14, 208. 91 14, 673. 52 15, 404. 05 GNP deflator Population (million persons) Growth rates (in percent) GNP at Current Prices - 10.9 10.64 GNP at 1985 prices - 5.34 7.08 GNP deflator - 5.25 3.33 Population - 2.00 2.00 per capita GNP at Current Prices - 8.70 8.47 per capita GNP at Constant Prices - 3.27 4.98
  • 18. • per capita GNP at constant prices or Real GNP per capita – is computed by dividing the real GNP by the population of the country. • Conversion of country’s GNP into US dollars: GNP in US dollars = GNP in local currency / Exchange rate
  • 19. Measures of economic performance for selected countries, 2007 Item GNP (in million US dollars) Population (in millions) GNP per capita (in US dollars) India Philippines Lithuania 1, 069, 400 142, 600 33, 500 1, 123 88 3 950 1, 620 9, 920 In recent years, economists have recognized that making cross-country comparisons requires an adjustment to GNP that goes beyond converting its values to US dollars. The reason is that one dollar spent in one country may not buy the same quantity of goods in another country. Another way of putting it is that the price of a commodity in one country is not likely to be the same in another.
  • 20. • To adjust for price differences across countries, GNP measured at domestic currency is divided by the so-called purchasing power parity exchange rate (PPP exchange rate) • The result is called PPP adjusted GNP . This result would then be divided by the population to get an estimate of PPP adjusted per capita GNP. Per capita GNP of selected countries, 2007 Country China in US dollars PPP Adjusted 2, 360 5, 370 38, 860 33, 820 India 950 2, 740 Japan 37, 670 34, 600 Lithuania 9, 920 17, 180 Philippines 1, 620 3, 730 Singapore 32, 470 48, 520 Thailand 3, 400 7, 880 Germany
  • 21. LIMITATIONS OF GNP 1. The higher GNP estimates tend to be associated with improved standards of living. Example: GNP estimates are silent on the costs of achieving higher output. 2. GNP is also an imperfect measure of output.  Imputing- refers to the process of approximating the values of certain activities. Example: the calculation of payments for owner-occupied housing. • This procedure introduces measurement errors because the imputed value might be different from the actual value.
  • 22. • There are also activities for which markets exist but the transactions are not reported. Example: Drug-trafficking and prostitution • There are also situations in which the activities are legal and markets exist but the transactions are not reported. Example: Peddling and trading  The underestimation of output resulting from illegal and unreported activities is large.
  • 23. INFLATION- refers to the increase in the general price level(GP) or prices as a whole. Two measures of the inflation rate: 1.Headline inflation rate – uses the Consumer Price Index (CPI) as a measure of the general price level. This is the traditional and most common index of inflation. Formula: CPI period t - CPI period t-1 Headline inflation rate = CPI period t-1 2. Core inflation rate- uses a price index which excludes the prices of commodities that are deemed to be volatile.
  • 24.
  • 25. UNEMPLOYMENT - implies that productive resources are not being fully utilized in the economy. • A person is considered unemployed if he/she is not a member of the labor force. The term labor force refers to people of a certain age (15 years and above in the case of the Philippines) who are: a. working or engaged in business, and b. not working or engaged in business but are actively looking for work.
  • 26. UNEMPLOYMENT RATE- an indicator that measure the employment situation in our country. • We calculate the unemployment rate (U) by dividing the number of unemployed members of the labor force by the total labor force. The result is then multiplied by 100 so that it can be expressed as a percentage: Unemployed members of the labor force U= Total labor force
  • 27.     Philippines April 20131/     Population 15 years and over (in 000) 2/ 64,028 62,842 Labor Force Participation Rate (%) 63.9 64.7 Employment Rate (%) 92.5 93.1 Unemployment Rate (%) 7.5 6.9 Underemployment Rate (%) 19.2 19.3 April 2012
  • 28.
  • 29. UNDEREMPLOYMENT RATE- the portion of employed individuals who want to work longer hours. • This indicator is calculated using the formula below: Underemployment Rate = Number of people underemployed Total employment