1. The document discusses economic growth and stability, including measurements of real GDP per capita growth rates and inflation.
2. It also covers topics like real and nominal GDP, calculating price indexes, sources of productivity and GDP growth, and the business cycle.
3. Business cycles involve periods of economic expansion and contraction, measured by indicators like unemployment rates and duration.
With the collapse of US mortgage market due to sub-prime lending, the global financial system is completely shattered. The UK financial markets were also not able to resist to this economy fall-down. The combination of credit crunch and falling housing market resulted in a recession in the UK market (Richardson, 2011). Recession can be defined as fall in real GDP of a country. Alternatively, it can be defined as, for the two consecutive quarters, if economic growth shows negative trend; i.e. if there is a fall in the real output of the country for consecutively six months (King and Cushman, 1997).
With the collapse of US mortgage market due to sub-prime lending, the global financial system is completely shattered. The UK financial markets were also not able to resist to this economy fall-down. The combination of credit crunch and falling housing market resulted in a recession in the UK market (Richardson, 2011). Recession can be defined as fall in real GDP of a country. Alternatively, it can be defined as, for the two consecutive quarters, if economic growth shows negative trend; i.e. if there is a fall in the real output of the country for consecutively six months (King and Cushman, 1997).
Economics is the study of choice. It is about people and how they choose to use limited resource in an effort to satisfy unlimited wants. There are two important components to this definition: limited resources and unlimited wants .Together they form what is now as the problem of scarcity which is basic most of all economic problems. If we are stop and think for a moment, we can see why scarcity are such as problem there are not enough resources on this planet for people to get everything they want. As result choice must be made.
LF Energy Webinar: Electrical Grid Modelling and Simulation Through PowSyBl -...DanBrown980551
Do you want to learn how to model and simulate an electrical network from scratch in under an hour?
Then welcome to this PowSyBl workshop, hosted by Rte, the French Transmission System Operator (TSO)!
During the webinar, you will discover the PowSyBl ecosystem as well as handle and study an electrical network through an interactive Python notebook.
PowSyBl is an open source project hosted by LF Energy, which offers a comprehensive set of features for electrical grid modelling and simulation. Among other advanced features, PowSyBl provides:
- A fully editable and extendable library for grid component modelling;
- Visualization tools to display your network;
- Grid simulation tools, such as power flows, security analyses (with or without remedial actions) and sensitivity analyses;
The framework is mostly written in Java, with a Python binding so that Python developers can access PowSyBl functionalities as well.
What you will learn during the webinar:
- For beginners: discover PowSyBl's functionalities through a quick general presentation and the notebook, without needing any expert coding skills;
- For advanced developers: master the skills to efficiently apply PowSyBl functionalities to your real-world scenarios.
Key Trends Shaping the Future of Infrastructure.pdfCheryl Hung
Keynote at DIGIT West Expo, Glasgow on 29 May 2024.
Cheryl Hung, ochery.com
Sr Director, Infrastructure Ecosystem, Arm.
The key trends across hardware, cloud and open-source; exploring how these areas are likely to mature and develop over the short and long-term, and then considering how organisations can position themselves to adapt and thrive.
GraphRAG is All You need? LLM & Knowledge GraphGuy Korland
Guy Korland, CEO and Co-founder of FalkorDB, will review two articles on the integration of language models with knowledge graphs.
1. Unifying Large Language Models and Knowledge Graphs: A Roadmap.
https://arxiv.org/abs/2306.08302
2. Microsoft Research's GraphRAG paper and a review paper on various uses of knowledge graphs:
https://www.microsoft.com/en-us/research/blog/graphrag-unlocking-llm-discovery-on-narrative-private-data/
Slack (or Teams) Automation for Bonterra Impact Management (fka Social Soluti...Jeffrey Haguewood
Sidekick Solutions uses Bonterra Impact Management (fka Social Solutions Apricot) and automation solutions to integrate data for business workflows.
We believe integration and automation are essential to user experience and the promise of efficient work through technology. Automation is the critical ingredient to realizing that full vision. We develop integration products and services for Bonterra Case Management software to support the deployment of automations for a variety of use cases.
This video focuses on the notifications, alerts, and approval requests using Slack for Bonterra Impact Management. The solutions covered in this webinar can also be deployed for Microsoft Teams.
Interested in deploying notification automations for Bonterra Impact Management? Contact us at sales@sidekicksolutionsllc.com to discuss next steps.
Dev Dives: Train smarter, not harder – active learning and UiPath LLMs for do...UiPathCommunity
💥 Speed, accuracy, and scaling – discover the superpowers of GenAI in action with UiPath Document Understanding and Communications Mining™:
See how to accelerate model training and optimize model performance with active learning
Learn about the latest enhancements to out-of-the-box document processing – with little to no training required
Get an exclusive demo of the new family of UiPath LLMs – GenAI models specialized for processing different types of documents and messages
This is a hands-on session specifically designed for automation developers and AI enthusiasts seeking to enhance their knowledge in leveraging the latest intelligent document processing capabilities offered by UiPath.
Speakers:
👨🏫 Andras Palfi, Senior Product Manager, UiPath
👩🏫 Lenka Dulovicova, Product Program Manager, UiPath
DevOps and Testing slides at DASA ConnectKari Kakkonen
My and Rik Marselis slides at 30.5.2024 DASA Connect conference. We discuss about what is testing, then what is agile testing and finally what is Testing in DevOps. Finally we had lovely workshop with the participants trying to find out different ways to think about quality and testing in different parts of the DevOps infinity loop.
"Impact of front-end architecture on development cost", Viktor TurskyiFwdays
I have heard many times that architecture is not important for the front-end. Also, many times I have seen how developers implement features on the front-end just following the standard rules for a framework and think that this is enough to successfully launch the project, and then the project fails. How to prevent this and what approach to choose? I have launched dozens of complex projects and during the talk we will analyze which approaches have worked for me and which have not.
State of ICS and IoT Cyber Threat Landscape Report 2024 previewPrayukth K V
The IoT and OT threat landscape report has been prepared by the Threat Research Team at Sectrio using data from Sectrio, cyber threat intelligence farming facilities spread across over 85 cities around the world. In addition, Sectrio also runs AI-based advanced threat and payload engagement facilities that serve as sinks to attract and engage sophisticated threat actors, and newer malware including new variants and latent threats that are at an earlier stage of development.
The latest edition of the OT/ICS and IoT security Threat Landscape Report 2024 also covers:
State of global ICS asset and network exposure
Sectoral targets and attacks as well as the cost of ransom
Global APT activity, AI usage, actor and tactic profiles, and implications
Rise in volumes of AI-powered cyberattacks
Major cyber events in 2024
Malware and malicious payload trends
Cyberattack types and targets
Vulnerability exploit attempts on CVEs
Attacks on counties – USA
Expansion of bot farms – how, where, and why
In-depth analysis of the cyber threat landscape across North America, South America, Europe, APAC, and the Middle East
Why are attacks on smart factories rising?
Cyber risk predictions
Axis of attacks – Europe
Systemic attacks in the Middle East
Download the full report from here:
https://sectrio.com/resources/ot-threat-landscape-reports/sectrio-releases-ot-ics-and-iot-security-threat-landscape-report-2024/
Neuro-symbolic is not enough, we need neuro-*semantic*Frank van Harmelen
Neuro-symbolic (NeSy) AI is on the rise. However, simply machine learning on just any symbolic structure is not sufficient to really harvest the gains of NeSy. These will only be gained when the symbolic structures have an actual semantics. I give an operational definition of semantics as “predictable inference”.
All of this illustrated with link prediction over knowledge graphs, but the argument is general.
When stars align: studies in data quality, knowledge graphs, and machine lear...
Chapter 17 keele prosperity growth - employment - indexing
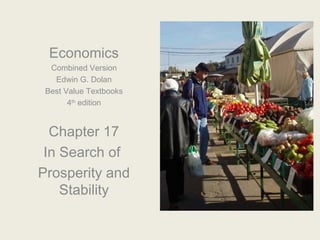
1. Economics
Combined Version
Edwin G. Dolan
Best Value Textbooks
4th edition
Chapter 17
In Search of
Prosperity and
Stability
2. Economic Growth
• The growth rate of real Gross
Domestic Product (GDP) per
capita is the most common
measurement of increasing
prosperity
– Nominal GDP is stated in terms
of prices at which goods are
actually bought and sold
– Real GDP is adjusted to remove
the effects of inflation
• US growth rate of real GDP is
about average for the world
– About 2-3% per year
3. Real and Nominal GDP
• The term "real" means adjusted for inflation.
• Nominal GDP is a measure of national output
based on the current prices of goods and
services. It is also called “money GDP”.
• Real GDP is a measure of the quantity of final
goods and services produced, obtained by
eliminating the influence of price changes from
nominal GDP.
• Adjusting for Inflation requires a price index of
some sort.
3
5. Calculating a Price Index:
the old fashioned, simple way
• Select a basket of goods
• Price of that basket of goods in Y1 divided by
the price of that same basket in Y2
5
6. Calculating an Index
price index = current cost of basket
base period cost of basket
Notes:
• This formula yields a decimal. To translate it into the published form of
the index (like CPI) multiply it by 100 (as if you were turning it to a
percentage).
• When using the index to calculate “real” values, use it in its decimal form
6
7. Calculating “Real” Values
Real GDP, Real Wage, Real Price, Real
Income, etc.
Real Value of Xt = Xt .
Price index at time t
• Note: when using this formula, be sure you use the
price index in it’s decimal form, not in its expanded
percentage form.
7
8. Three Key Price Indexes
Consumer Price Index (CPI)
– measures the impact of price changes on the cost of the typical
bundle of goods and services purchased by households.
Producer Price Index (PPI)
– A measure of the average prices received by producers for raw
materials, intermediate, and final goods. The PPI used to be called
the Wholesale Price Index (WPI).
GDP Deflator (GDP Price Index or GDPPI)
– Is a broader price index than the CPI. It is designed to measure the
change in the average price of all the goods and services included
in GDP.
8
9. Price Indexes
• The value of a price index in any particular year indicates how
prices have changed relative to a base year. (1982-84)
• The base year is the year against which all other years are
compared.
• The index is 100 ± the percent change in prices from the base
year.
• This type of index suffers from substitution bias as some
buyers will change the mix of goods that they buy in response
to price changes.
• Chain-type indexes of real GDP were created to correct for
this bias. Such an index uses the mean of the growth rates
using beginning and ending year prices.
9
10. Sources of Growth
• Growth of population and increased labor
force participation
• Growth of productivity (output per worker)
– Increase in capital per worker
– Increase in total factor productivity
11. Productivity Growth in the United States
Productivity growth varies from year to year. In the 1970s U.S.
productivity growth slowed down. It revived again during the hi-tech
boom of the 1990s, but has recently slowed again.
12. Growth and the environment:
Trade-off?
• In early stages of economic
development, increasing
production of material goods
often leads to reduced
environmental quality (A to B)
• In later stages, properly
managed growth can increase
both production of material
goods and environmental
quality
13. Actual and Natural/Potential GDP Growth
Because of increasing population and productivity, the nation’s natural or
potential GDP increases steadily over time. As it does so, actual real output is
sometimes above and sometimes below the natural level.
The difference is called the output gap
14. Business Cycles
• Business Cycle: the pattern of real GDP rising and
falling.
• Recession (Contraction): two or more successive
quarters of falling real GDP.
• Depression: a severe, prolonged economic
contraction. Usually involves unemployment rising to
greater than 10% for years.
16. Economic Indicators
• Leading Indicators
• Variables that fairly consistently changes before real GDP
changes
• Coincident Indicators
• Variables that fairly consistently changes at the same time
as real GDP changes
• Lagging Indicators
• Variables that fairly consistently changes after real GDP
changes
17. Indicators of Business Cycle
Leading Indicators
Money Supply Manufacturers’ New Building Permits
New Orders
New plant and Average Work Week
equipment orders
Interest Rate Spread
Unemployment Claims
Consumer Expectations
Stock Prices
18. Indicators of Business Cycle
Co-incident Indicators
Personal income
Payroll employment
Industrial production
Manufacturing
and trade sales
19. Indicators of Business Cycle
Lagging Indicators
Inventories to
Labor cost per sales ratio
unit of output
Unemployment
duration
Prime interest rate
20. Great Depression
Year U.S. Unemployment Rate
1929 3.2%
1930 8.7%
1931 15.9%
1932 23.6%
1933 24.9%
↓ ↓
1939 17.2%
21. Unemployment
The unemployment rate is the percentage of the labor
force that is not working.
Rate of number unemployed
Unemploymen = number in the Labor Force
t
The U.S. Labor Department defines the labor force as
being equal to:
• All U.S. residents
• Over the age of 16
• Who are not institutionalized
• Who are working or looking for work
22. Interpreting the
Unemployment Rate
• Discouraged Workers are workers who have
looked for work in the past year, but who have
stopped looking because they believe no one will
offer them a job.
• Underemployment is the employment of
workers in jobs that do not utilize their
productive skills.
23. Types of Unemployment
Seasonal Unemployment:
A product of regular, recurring changes in the
hiring needs of certain industries on a monthly
or seasonal basis.
For example, retail sales are higher during the
holiday season therefore unemployment in
this industry goes down during the months of
November and December.
24. Types of Unemployment
Frictional Unemployment
Usually short term, occurs because workers and
employers have to find one another.
Example: College graduates seeking employment
are a good example of frictional unemployment.
25. Types of Unemployment
Structural Unemployment
Reflects an imperfect match-up of employee skills
and the skill requirements of the available jobs or
a permanent reduction in demand for an
industry’s output.
Example: Advancements in technology have
resulted in consistent declines in employment in
the agriculture, forestry and fishing industries.
26. Types of Unemployment
Cyclical Unemployment
A product of business cycle fluctuations.
As a recession occurs, cyclical unemployment
increases, and as growth occurs, cyclical
unemployment decreases.
As the housing boom of the early 21st century
slows, unemployment in related industries like
builders and real estate agents increases.
27. Unemployment and Its Costs
• Natural Rate of Unemployment
The level of unemployment that results when the rate of
unemployment is normal, considering both frictional and
structural factors. Also called the NAIRU (Nonaccelerating
Inflation Rate of Unemployment)
• Potential Real GDP
The level of output produced when nonlabor resources are
fully utilized and unemployment is at its natural rate.
• GDP gap = potential real GDP – actual GDP
28. Unemployment in the United States
The unemployment rate rises during contractions and falls during
expansions. Because some people are always entering the labor
force or changing jobs, it never falls to zero.
29. Unemployment: US vs Europe
The natural rate of unemployment varies from country to country,
depending on cultural factors and labor laws. The natural rate has
fallen over time in the United States while it has risen in Europe
30. Unemployment by
duration
During a recession, more
people are unemployed, and
the average duration of
unemployment also increases.
Even during a recession, many
of the unemployed are out of
work for 14 weeks or less.
Social costs of unemployment
fall most heavily on the long-
term unemployed, whose
numbers increase greatly
during a recession.
31. Inflation in the United States
• Inflation means a sustained
rise in the price level
• Deflation means a
sustained fall in the price
level
• During 2009, the United
States experienced several
months of deflation, but
prices began to rise again
late in the year.
32. World inflation averages
• Inflation was much
higher in the 1970s
and 1980s than it is
now
• During the 1990s,
inflation fell, first
in advanced
countries and then
in developing
countries
33. Calculating an Inflation Rate
Inflation or deflation = change in index X 100
initial value of the index
Notes:
• Inflation is stated as a percentage, hence, the “X 100” which is just
shifting a decimal to a percentage.
• Price increases are referred to as Inflation, price decreases are Deflation
• Once you’ve calculated the total inflation, you can divide it by the number
of years to get an annualized inflation Rate
33
34. Inflation and interest rates
• Inflation affects interest Let
rates as well as prices • R = nominal rate of interest
• The nominal rate of • r = real rate of interest
interest is expressed in the • π = rate of inflation
ordinary way, in current
dollars Then
• The real rate of interest is r=R-π
the nominal rate adjusted
by subtracting the rate of
inflation
35. Inflation and Growth
Inflation of more than a few percent per year tends to undermine
economic growth. On average, countries with more than 100
percent annual inflation have negative economic growth.