Downloaded 133 times


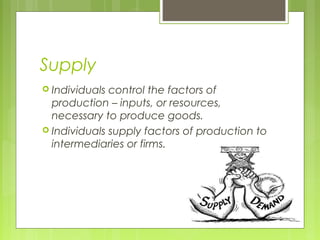
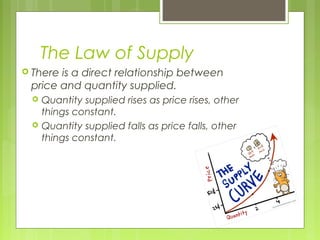

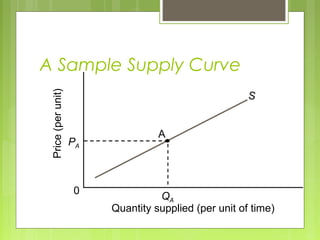
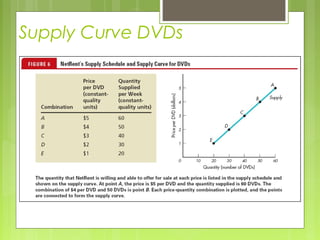
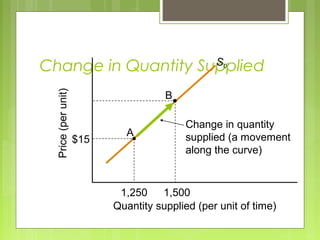
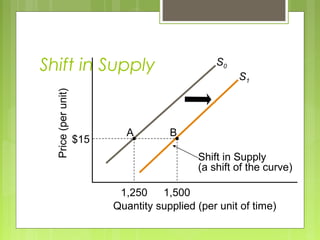


The document discusses the law of supply, which states that the quantity supplied of a good rises as the price rises and falls as the price falls, assuming other factors remain constant. It explains that individuals supply factors of production to firms and that firms then transform these inputs into usable goods and services. The supply curve illustrates the relationship between price and quantity supplied, and can shift due to changes in input prices, technology, expectations, taxes, or subsidies.