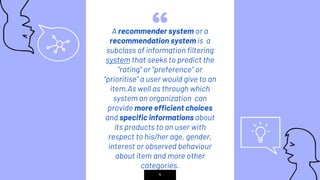
Recommender
System!!
Presenting By: Nilotpal Pramanik
Dual Degree B.Tech(I.T)-M.Tech(I.T),
Spl. Robotics(2016-2021), Indian Institute
of Information Technology, Allahabad, U.P
Under Supervision: Dr. Ranjana Vyas
Dept. of Information Technology,
Indian Institute of Information
Technology, Allahabad, U.P
Introduction
We can get into
this topic through
discussing three
most important
question...
What?? Why?? How??
1.
What is Recommender
System??
Let’s start with the first most
important question...
“A recommender system or a
recommendation system is a
subclass of information filtering
system that seeks to predict the
"rating" or "preference" or
“prioritise” a user would give to an
item.As well as through which
system an organization can
provide more efficient choices
and specific informations about
its products to an user with
respect to his/her age, gender,
interest or observed behaviour
about item and more other
categories.
4
2.
Why Recommender
System??
Now go for the second most
important question...
➢USER’S Aspects!!
▹ Getting reliable and relevant
informations before going for any
product through the ratings and
comments from the previous users.
▹ Save the time to find the desirable one
among a lot due to having categories.
▹ Provide a open space to show the
preferences to the products.
6
➢ORGANIZATION’s
Aspects
▹ Analyze the behaviour of the
customers.
▹ To provide more improved,
accurate and precise results to
the users.
▹ Make new or renew the business
strategies to optimize their
profits.
7
3.
How Recommender
System??
Here is the third most important
question...
9
In modern society is that people have too
much options to use from due to the
prevalence of Internet. In the past,
people used to shop in a physical store,
in which the items available are limited.
For instance, the number of movies that
can be placed in a Blockbuster store
depends on the size of that store. By
contrast, nowadays, the Internet allows
people to access abundant resources
online. Although the amount of available
information increased, a new problem
arose as people had a hard time
selecting the items they actually want to
see. This is where the recommender
system comes in.
RFM
CONCEPT
RFM criterion is one of
the oldest and most widely
used technique for
selecting the most
significant customers. It
supports the selection of
customers that are most
recent (R), frequent (F),
and add a larger monetary
value (M) in every
transaction.
10
RFM(Recency,Frequency,
Monetary) Analysis
Recency
Recency is the most
important predictor of who
is more likely to respond to
an offer. Customers who
have purchased recently are
more likely to purchase
again when compared to
those who did not purchase
recently.
On the basis of Date of
purchasing...It can be seen
that around 2200
customers out of 3900
customers have purchased
in last 2 months. Note that
some customers have not
visited the store in last 4–8
months. To regain that lost
customer base, business
should look out for the
reasons why these
customers stop visiting the
stores.
Frequency
The second most
important factor is how
frequently these
customers purchase. The
higher the frequency, the
higher is the chances of
these responding to the
offers.
On the basis of Month of
purchasing...It can be
seen that most of the
customers are visiting the
store less than 13 times a
year. Therefore, now it
will be interesting to see
what the variation is in
the Monetary value that
these customers
contribute.
Monetary Value
The third factor is the
amount of money these
customers have spent on
purchases. Customers
who have spent higher
contribute more value to
the business as compared
to those who have spent
less.
On the basis of Year of
purchasing...It can be
seen there is an almost
equal distribution of
customers as far as
monetary value is
concerned.
11
Based on business requirements, various cutoffs are
imposed on each of the three parameters. After
applying the cut-offs, customers can be classified
mainly in three segments:
12
● Customers clearing all the three cut-offs are the best and the most
reliable customers. Business should focus on making customised
promotional strategies and loyalty schemes for these customers in order
to retain this valuable customer base.
● Customers failing the recency criterion only are those customers who
have stopped visiting the store. Business should focus on these
customers and look out for the reason why they abandoned visiting the
stores.
● Customers clearing the recency criterion but failing frequency criterion
are the new customers. Business should provide more incentives and
offers to these customers and try to retain these new customers.
Apart from
segmenting
customers, business
can also use RFM
criterion to filter out a
reliable customer base
and perform analysis
like Market Basket
Analysis to see
customer buying
pattern or assess the
success of marketing
strategies by analysing
the response of these
customers.
13
R
F
M
The squares are of different sizes
indicating that is a different
number of customers in each
segment. For instance, there are
no squares corresponding to
Recency = 1 and Frequency = 5
and Monetary = 2 indicating that
no customers fall in these
segments. The square
corresponding to Recency = 1 and
Frequency = 1 Monetary = 1 is
larger than its neighbors since it
represents a larger segment of the
customer base as compared to its
neighbors. Marketers are mostly
interested in large segments of the
customer base with high response
spending like the segment with
Recency = 1 and Frequency = 1. A
3D scatter plot is used to depict
the complete RFM.
14
Normal-Changein Mean: If we plot
the Change of Mean in each RFM
components with respect to the
Number of Customers then we
find the GAUSSIAN
DISTRIBUTION.And for all it’ll rise
for comparatively same height.
Normal-Changein Deviation: If we
plot the Change of Deviation in
each RFM components with
respect to the Number of
Customers then we again find the
GAUSSIAN DISTRIBUTION.But
from our previous discussion
there is an almost equal
distribution of customers as far
as Monetary value is
concerned.And Recency will vary
due to date with large variations
so it has a sharp pick.And for the
frequency the distribution will lie
between them according to our
discussion.
15
Number of CustomersNumber of Customers
R
F
M
Want big impact?
USE BIG IMAGE.
16
Non Personalized
Recommender System
Whoa! The most basic form of Recommender System
17
89,526,124$
That’s a lot of money!!
???%
Total success!!
185,244 USERS
And a lot of users!!
18
As the name suggests, this recommender system
provides with general recommendations to the user
without any context of what user wants or what is
his/her preferences.
Let’s think of Amazon for example. When we visit the
website for the first time, it provides us with a list of
most popular item. These popular items can be based
on different parameters like geography, age, sex etc.
Based on these parameters, system calculates the
mean of the product rating of all the users and provides
us with the products with maximum mean. This is also
called stereotyped recommender system.
Pros: Provide the proper guidance to the new users.
Cons: It may happen that the user needs/likes those
items which have less ratings, then??
Place your screenshot here
19
Probable
SOLUTION!!
During the Signing Up the
along with age, gender,
location the organization
should provide “You
prefer” / “genre” kinda
choice list to reach more
close to the user’s needs...
Place your screenshot here
20
Product
Association
Recommender
Apart from Stereotyped
Recommender System,
another class of non
personalised recommender
system use association to
recommend products.
In Product Association Recommenders, uses
the knowledge of the product that a consumer
is looking at and based on this knowledge, it
provides item recommendations. One way of
providing these recommendations is to go
through all the historical transactions and see
what other people have most frequently
bought along with the given product in the
same sales transaction.
This type of recommendation is not
personalized to the person but to current user
who is looking at the given product. So how to
calculate this?
21
“Let us take an example to understand
this. Let us suppose that X is Red sauce
and Y is Banana. So is it correct saying
that 80% of the people who buy Red
sauce also buy Banana necessarily? Or
does it mean that Banana is a very
common product and people will buy it
irrespective of the fact whether there is
Red sauce in the basket or not??
To control the popularity of Y overwhelm
the recommendation, we use the
concept of Bayes Theorem….
22
23
Construction of
Recommender System
The two traditional approaches...
Content-based Recommendation
This type of recommender system is dependent on the inputs
provided by the user. Some of the typical examples of
content based filtering are Google, Wikipedia etc.
Let’s start by getting an intuition of what these
recommenders do. When you search a group of keywords,
the most basic idea will be to show all the items containing
those keywords. But the biggest problem that we are trying
to solve here, The problem of Huge Pile of information, acts
as a roadblock in this also. For Example, if someone search
for “The Recommender System”, there will be a large number
of documents containing the Keyword “The”. Same is for the
keyword “System”.
25
Collaborative Filtering
26
Let’s move forward from this intuition and incorporate the
behaviour of other users and provide more weight to the
ratings of those users who are like me. But how do we check
how much a user is similar to me?
To answer this, we will use Karl Pearson’s correlation and
see how similar two users are. It is usually calculated over the
items that both the users have rated in the past. But there is a
problem with this approach. When the number of common
ratings are not very large, the similarity value gets biased. It
might be possible that 2 users have only 2 ratings in common
but the value of correlation is very high or even very close to 1.
User-
User
27
28
ITEM-ITEM collaborative filtering look for items that are similar
to the articles that user has already rated and recommend most
similar articles. But what does that mean when we say item-item
similarity? In this case we don’t mean whether two items are the
same by attribute like Fountain pen and pilot pen are similar
because both are pen. Instead, what similarity means is how
people treat two items the same in terms of like and dislike.
This method is quite stable in itself as compared to User based
collaborative filtering because the average item has a lot more
ratings than the average user. So an individual rating doesn’t
impact as much.
Item-Item Collaborative Filtering
29
World Wide Applications
30
References
● https://medium.com/
@tomar.ankur287/
● https://www.manning
.com/books/practical
-recommender-
systems
● https://hackernoon.c
om/introduction-to-
recommender-system
31
THANK
YOU:)
You can find me at:
nilotpal.npk@gmail.com
&&
https://www.facebook.com/
nilotpal.pramanik.96
32

Recommender system

  • 1.
    Recommender System!! Presenting By: NilotpalPramanik Dual Degree B.Tech(I.T)-M.Tech(I.T), Spl. Robotics(2016-2021), Indian Institute of Information Technology, Allahabad, U.P Under Supervision: Dr. Ranjana Vyas Dept. of Information Technology, Indian Institute of Information Technology, Allahabad, U.P
  • 2.
    Introduction We can getinto this topic through discussing three most important question... What?? Why?? How??
  • 3.
    1. What is Recommender System?? Let’sstart with the first most important question...
  • 4.
    “A recommender systemor a recommendation system is a subclass of information filtering system that seeks to predict the "rating" or "preference" or “prioritise” a user would give to an item.As well as through which system an organization can provide more efficient choices and specific informations about its products to an user with respect to his/her age, gender, interest or observed behaviour about item and more other categories. 4
  • 5.
    2. Why Recommender System?? Now gofor the second most important question...
  • 6.
    ➢USER’S Aspects!! ▹ Gettingreliable and relevant informations before going for any product through the ratings and comments from the previous users. ▹ Save the time to find the desirable one among a lot due to having categories. ▹ Provide a open space to show the preferences to the products. 6
  • 7.
    ➢ORGANIZATION’s Aspects ▹ Analyze thebehaviour of the customers. ▹ To provide more improved, accurate and precise results to the users. ▹ Make new or renew the business strategies to optimize their profits. 7
  • 8.
    3. How Recommender System?? Here isthe third most important question...
  • 9.
    9 In modern societyis that people have too much options to use from due to the prevalence of Internet. In the past, people used to shop in a physical store, in which the items available are limited. For instance, the number of movies that can be placed in a Blockbuster store depends on the size of that store. By contrast, nowadays, the Internet allows people to access abundant resources online. Although the amount of available information increased, a new problem arose as people had a hard time selecting the items they actually want to see. This is where the recommender system comes in.
  • 10.
    RFM CONCEPT RFM criterion isone of the oldest and most widely used technique for selecting the most significant customers. It supports the selection of customers that are most recent (R), frequent (F), and add a larger monetary value (M) in every transaction. 10
  • 11.
    RFM(Recency,Frequency, Monetary) Analysis Recency Recency isthe most important predictor of who is more likely to respond to an offer. Customers who have purchased recently are more likely to purchase again when compared to those who did not purchase recently. On the basis of Date of purchasing...It can be seen that around 2200 customers out of 3900 customers have purchased in last 2 months. Note that some customers have not visited the store in last 4–8 months. To regain that lost customer base, business should look out for the reasons why these customers stop visiting the stores. Frequency The second most important factor is how frequently these customers purchase. The higher the frequency, the higher is the chances of these responding to the offers. On the basis of Month of purchasing...It can be seen that most of the customers are visiting the store less than 13 times a year. Therefore, now it will be interesting to see what the variation is in the Monetary value that these customers contribute. Monetary Value The third factor is the amount of money these customers have spent on purchases. Customers who have spent higher contribute more value to the business as compared to those who have spent less. On the basis of Year of purchasing...It can be seen there is an almost equal distribution of customers as far as monetary value is concerned. 11
  • 12.
    Based on businessrequirements, various cutoffs are imposed on each of the three parameters. After applying the cut-offs, customers can be classified mainly in three segments: 12 ● Customers clearing all the three cut-offs are the best and the most reliable customers. Business should focus on making customised promotional strategies and loyalty schemes for these customers in order to retain this valuable customer base. ● Customers failing the recency criterion only are those customers who have stopped visiting the store. Business should focus on these customers and look out for the reason why they abandoned visiting the stores. ● Customers clearing the recency criterion but failing frequency criterion are the new customers. Business should provide more incentives and offers to these customers and try to retain these new customers.
  • 13.
    Apart from segmenting customers, business canalso use RFM criterion to filter out a reliable customer base and perform analysis like Market Basket Analysis to see customer buying pattern or assess the success of marketing strategies by analysing the response of these customers. 13 R F M
  • 14.
    The squares areof different sizes indicating that is a different number of customers in each segment. For instance, there are no squares corresponding to Recency = 1 and Frequency = 5 and Monetary = 2 indicating that no customers fall in these segments. The square corresponding to Recency = 1 and Frequency = 1 Monetary = 1 is larger than its neighbors since it represents a larger segment of the customer base as compared to its neighbors. Marketers are mostly interested in large segments of the customer base with high response spending like the segment with Recency = 1 and Frequency = 1. A 3D scatter plot is used to depict the complete RFM. 14
  • 15.
    Normal-Changein Mean: Ifwe plot the Change of Mean in each RFM components with respect to the Number of Customers then we find the GAUSSIAN DISTRIBUTION.And for all it’ll rise for comparatively same height. Normal-Changein Deviation: If we plot the Change of Deviation in each RFM components with respect to the Number of Customers then we again find the GAUSSIAN DISTRIBUTION.But from our previous discussion there is an almost equal distribution of customers as far as Monetary value is concerned.And Recency will vary due to date with large variations so it has a sharp pick.And for the frequency the distribution will lie between them according to our discussion. 15 Number of CustomersNumber of Customers R F M
  • 16.
    Want big impact? USEBIG IMAGE. 16
  • 17.
    Non Personalized Recommender System Whoa!The most basic form of Recommender System 17
  • 18.
    89,526,124$ That’s a lotof money!! ???% Total success!! 185,244 USERS And a lot of users!! 18 As the name suggests, this recommender system provides with general recommendations to the user without any context of what user wants or what is his/her preferences. Let’s think of Amazon for example. When we visit the website for the first time, it provides us with a list of most popular item. These popular items can be based on different parameters like geography, age, sex etc. Based on these parameters, system calculates the mean of the product rating of all the users and provides us with the products with maximum mean. This is also called stereotyped recommender system. Pros: Provide the proper guidance to the new users. Cons: It may happen that the user needs/likes those items which have less ratings, then??
  • 19.
    Place your screenshothere 19 Probable SOLUTION!! During the Signing Up the along with age, gender, location the organization should provide “You prefer” / “genre” kinda choice list to reach more close to the user’s needs...
  • 20.
    Place your screenshothere 20 Product Association Recommender Apart from Stereotyped Recommender System, another class of non personalised recommender system use association to recommend products.
  • 21.
    In Product AssociationRecommenders, uses the knowledge of the product that a consumer is looking at and based on this knowledge, it provides item recommendations. One way of providing these recommendations is to go through all the historical transactions and see what other people have most frequently bought along with the given product in the same sales transaction. This type of recommendation is not personalized to the person but to current user who is looking at the given product. So how to calculate this? 21
  • 22.
    “Let us takean example to understand this. Let us suppose that X is Red sauce and Y is Banana. So is it correct saying that 80% of the people who buy Red sauce also buy Banana necessarily? Or does it mean that Banana is a very common product and people will buy it irrespective of the fact whether there is Red sauce in the basket or not?? To control the popularity of Y overwhelm the recommendation, we use the concept of Bayes Theorem…. 22
  • 23.
  • 24.
    Construction of Recommender System Thetwo traditional approaches...
  • 25.
    Content-based Recommendation This typeof recommender system is dependent on the inputs provided by the user. Some of the typical examples of content based filtering are Google, Wikipedia etc. Let’s start by getting an intuition of what these recommenders do. When you search a group of keywords, the most basic idea will be to show all the items containing those keywords. But the biggest problem that we are trying to solve here, The problem of Huge Pile of information, acts as a roadblock in this also. For Example, if someone search for “The Recommender System”, there will be a large number of documents containing the Keyword “The”. Same is for the keyword “System”. 25
  • 26.
    Collaborative Filtering 26 Let’s moveforward from this intuition and incorporate the behaviour of other users and provide more weight to the ratings of those users who are like me. But how do we check how much a user is similar to me? To answer this, we will use Karl Pearson’s correlation and see how similar two users are. It is usually calculated over the items that both the users have rated in the past. But there is a problem with this approach. When the number of common ratings are not very large, the similarity value gets biased. It might be possible that 2 users have only 2 ratings in common but the value of correlation is very high or even very close to 1. User- User
  • 27.
  • 28.
    28 ITEM-ITEM collaborative filteringlook for items that are similar to the articles that user has already rated and recommend most similar articles. But what does that mean when we say item-item similarity? In this case we don’t mean whether two items are the same by attribute like Fountain pen and pilot pen are similar because both are pen. Instead, what similarity means is how people treat two items the same in terms of like and dislike. This method is quite stable in itself as compared to User based collaborative filtering because the average item has a lot more ratings than the average user. So an individual rating doesn’t impact as much. Item-Item Collaborative Filtering
  • 29.
  • 30.
  • 31.
  • 32.
    THANK YOU:) You can findme at: nilotpal.npk@gmail.com && https://www.facebook.com/ nilotpal.pramanik.96 32