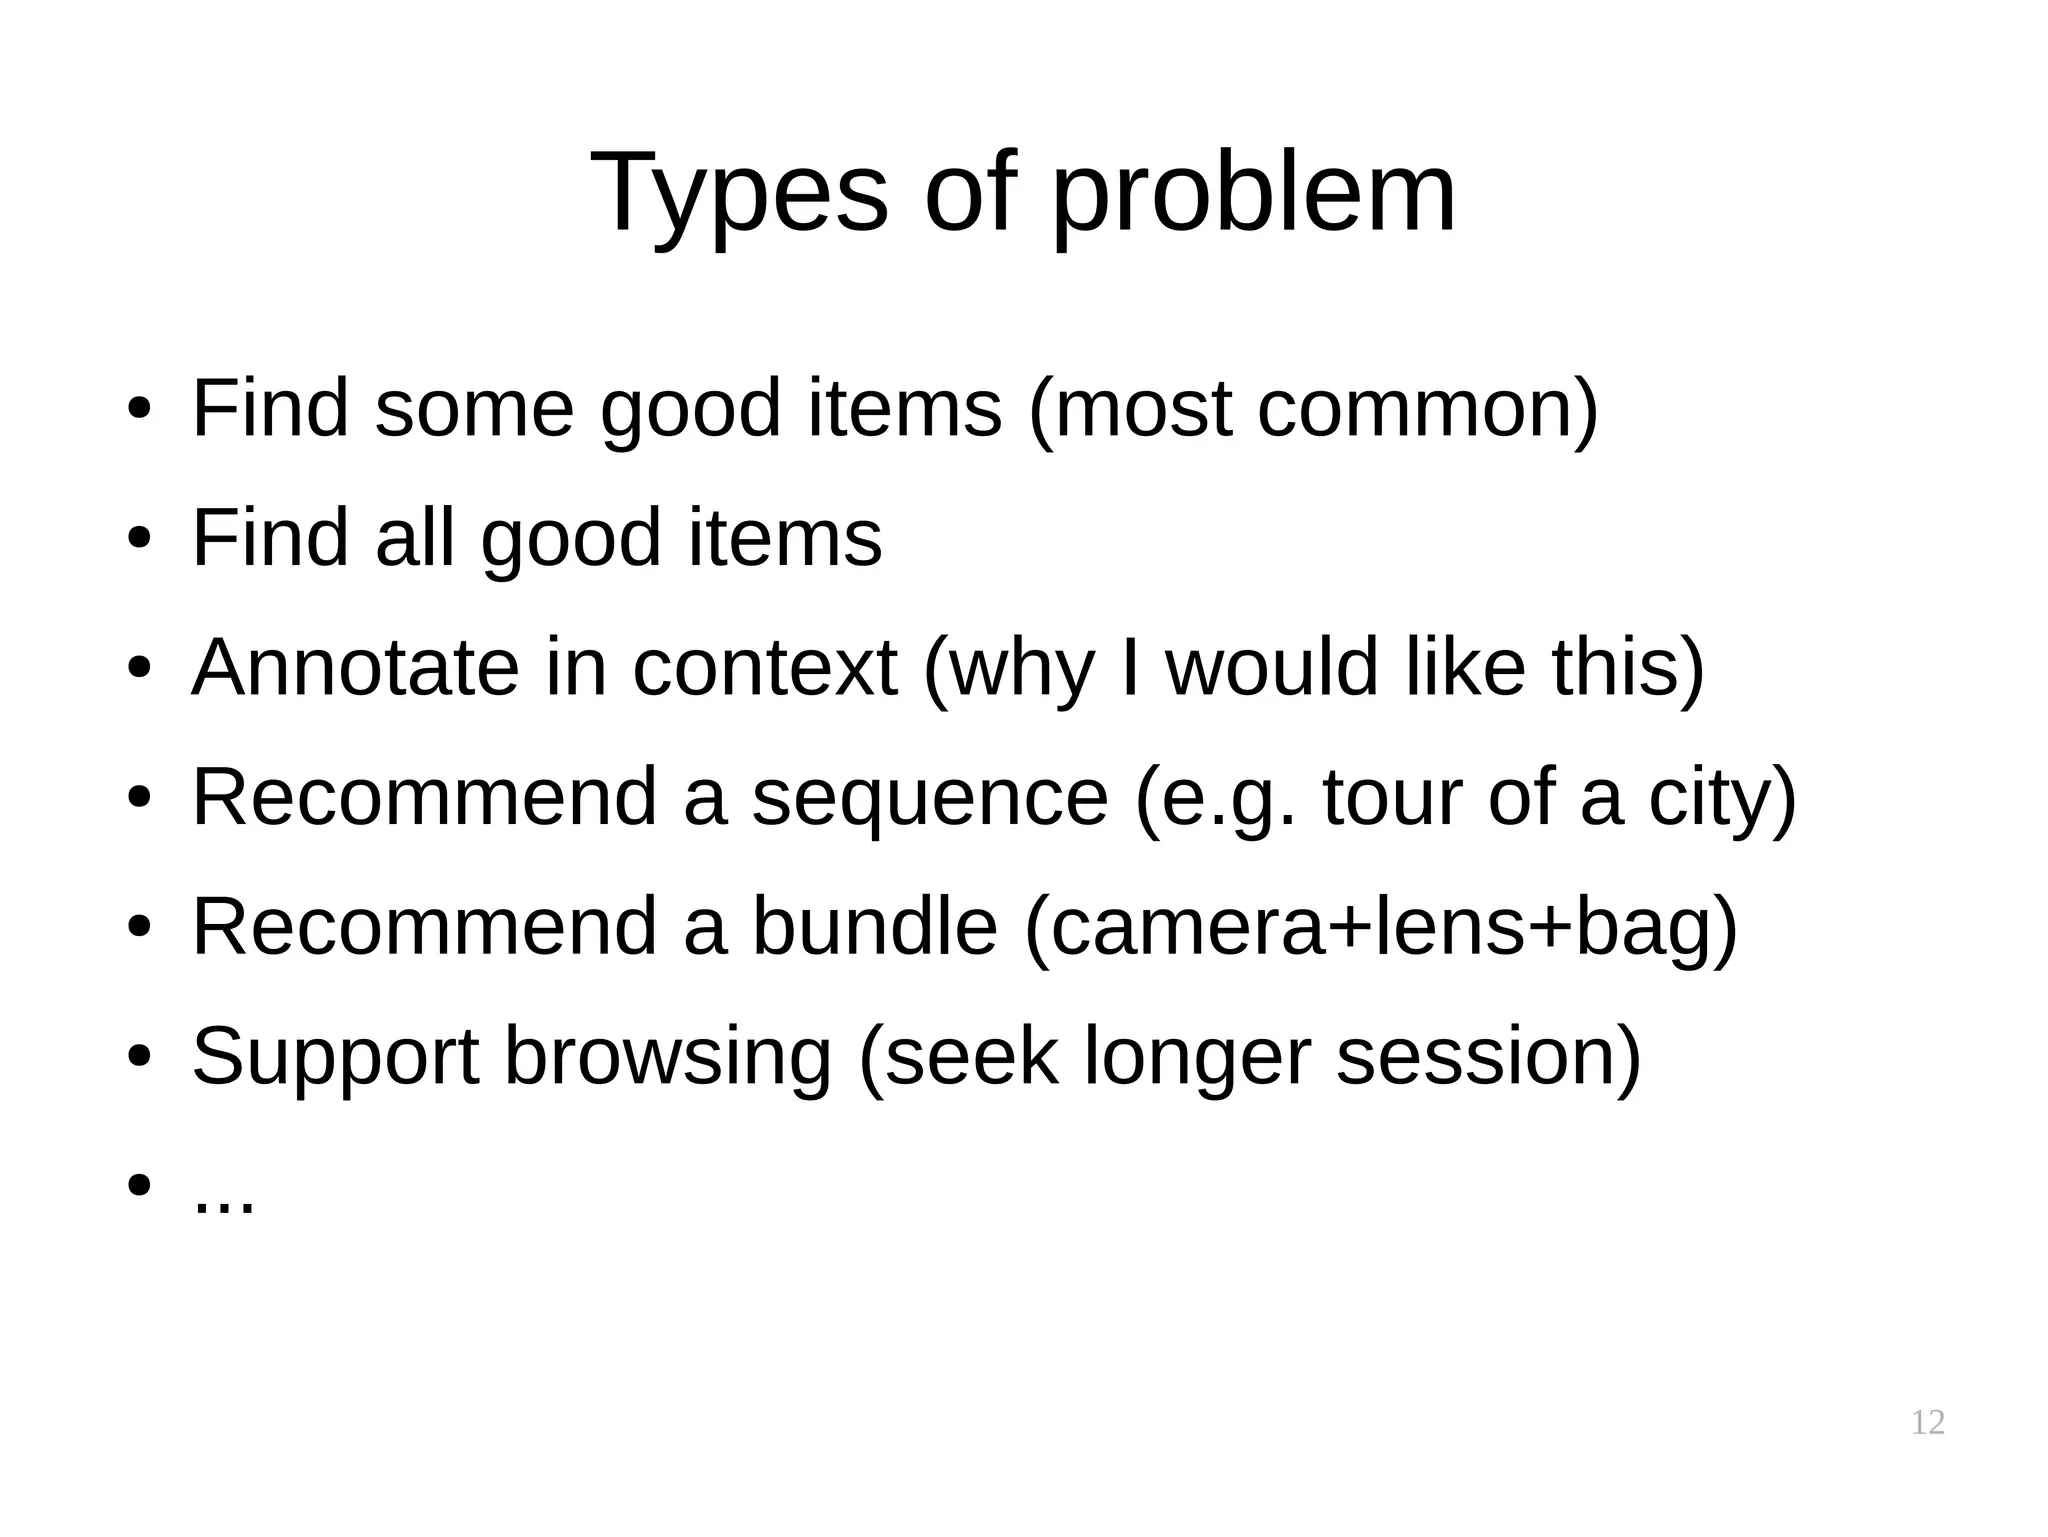
Download as PDF, PPTX
![Recommender Systems
Class Algorithmic Methods of Data Mining
Program M. Sc. Data Science
University Sapienza University of Rome
Semester Fall 2015
Lecturer Carlos Castillo http://chato.cl/
Sources:
● Ricci, Rokach and Shapira: Introduction to Recommender
Systems Handbook [link]
● Bobadilla et al. Survey 2013 [link]
● Xavier Amatriain 2014 tutorial on rec systems [link]
● Ido Guy 2011 tutorial on social rec systems [link]
● Alex Smola's tutorial on recommender systems [link]](https://image.slidesharecdn.com/pkfetdxyqpiy2i94fvzv-signature-25ed596523f4a669f9a710899d8eaf303c4bbdce8b8e80e99e004c3f91b28bcc-poli-151222094839/75/Recommender-Systems-1-2048.jpg)


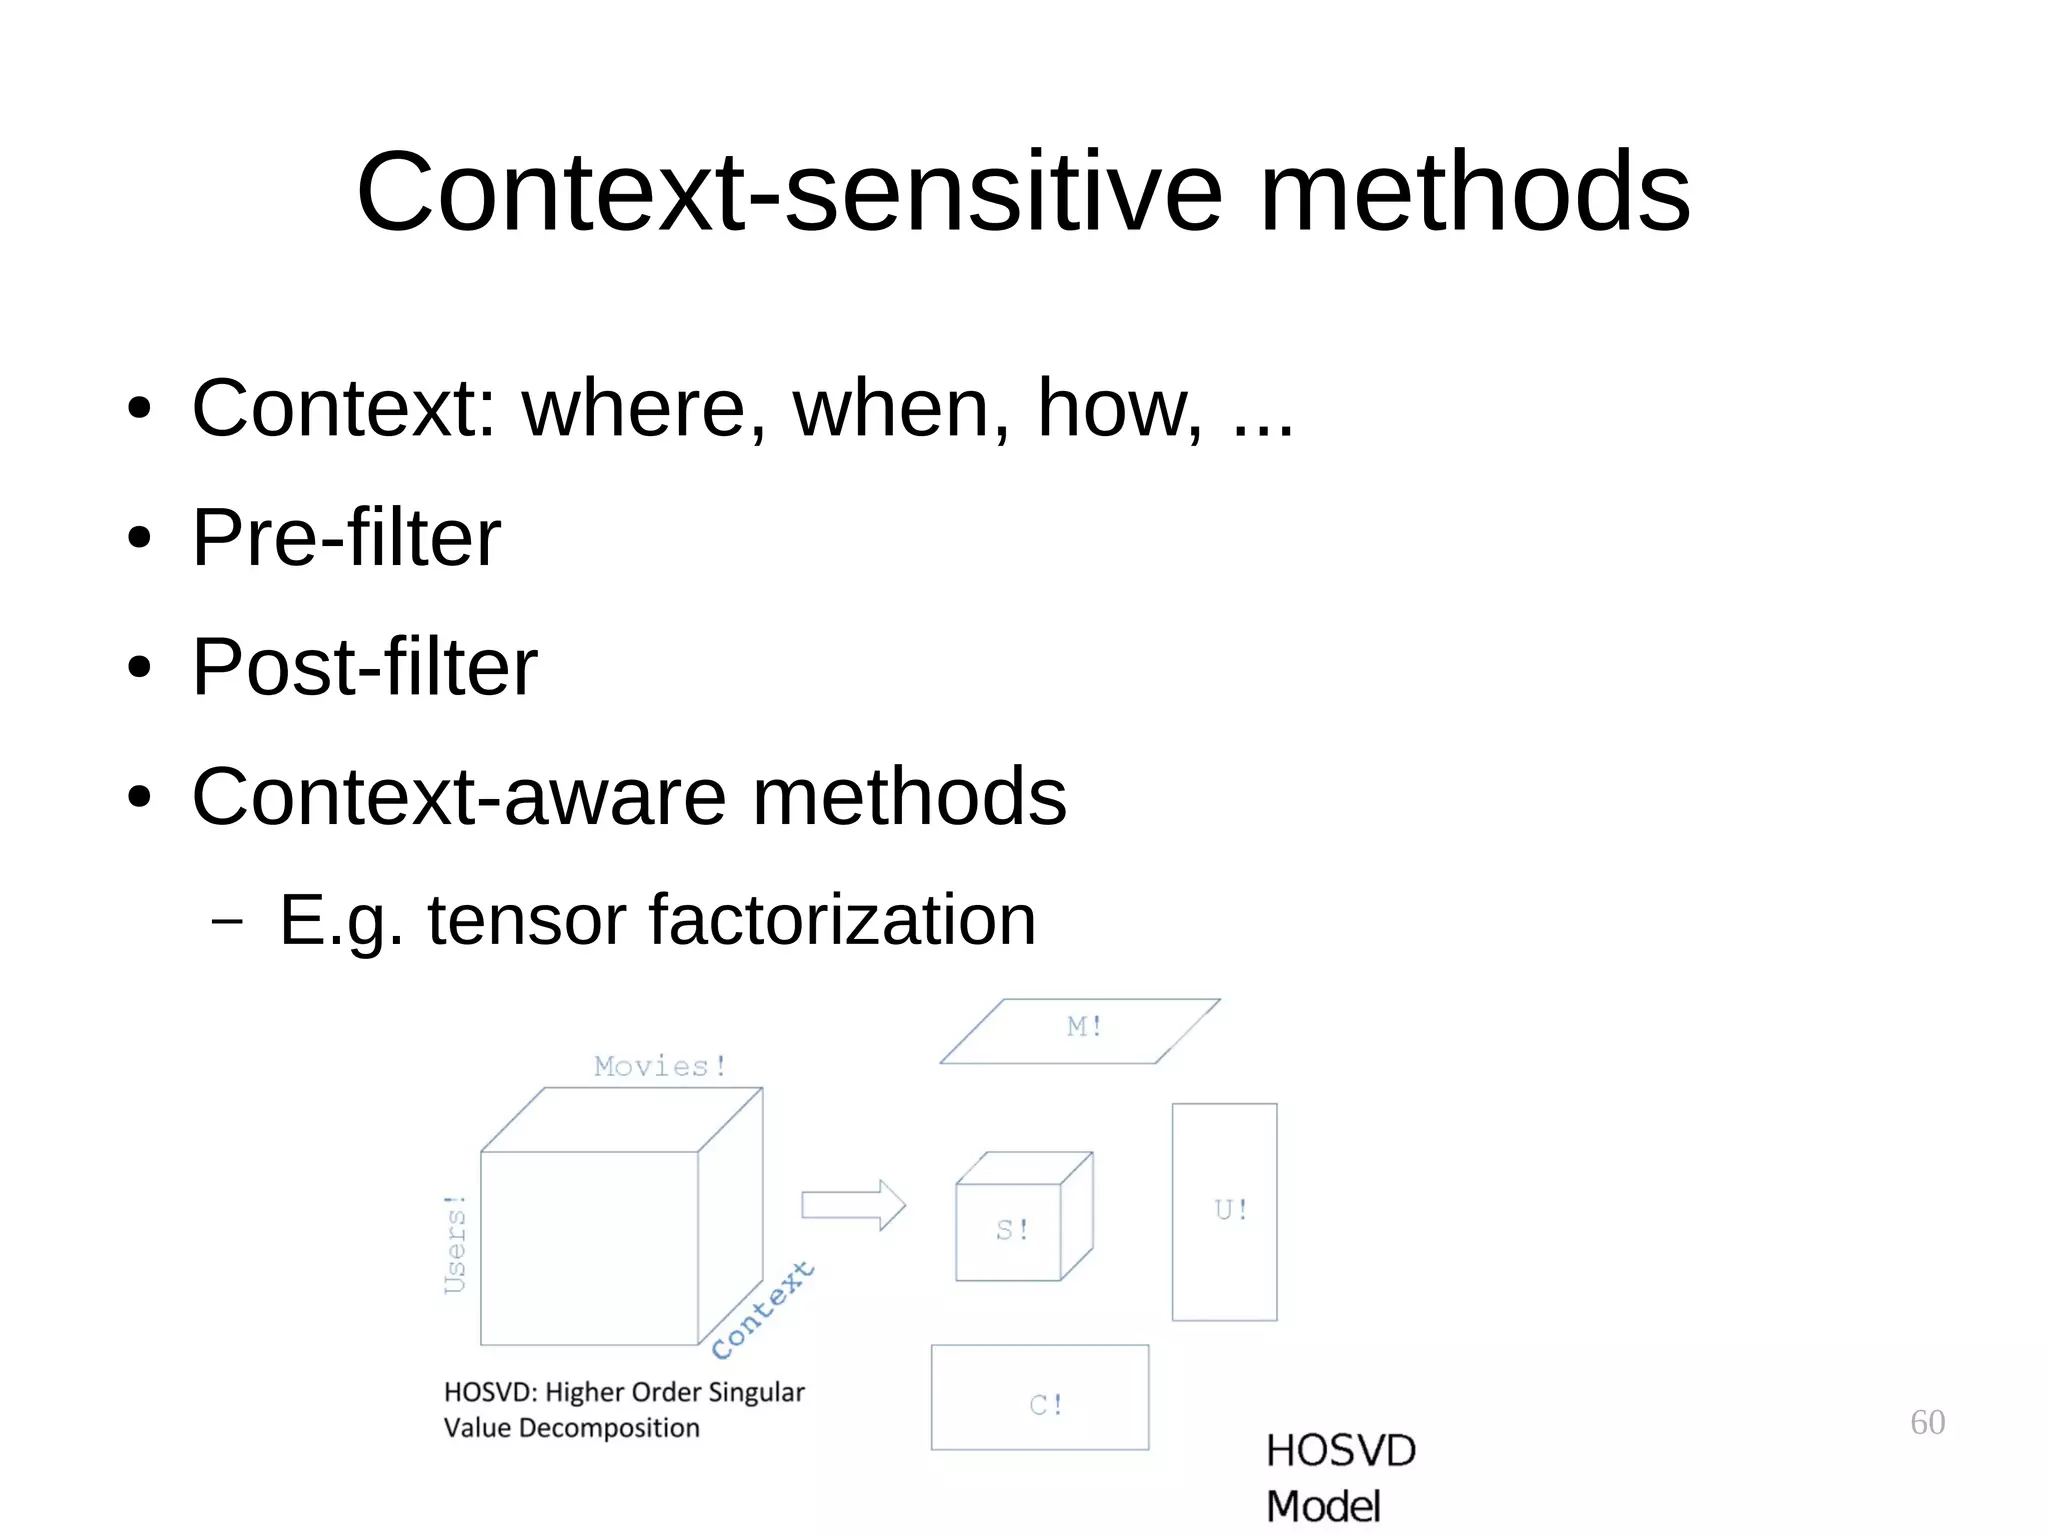
![18
Serendipity
● “An aptitude for making desirable discoveries
by accident”
● Don't recommend items the user already knows
● Delight users by expanding their taste
– But still recommend them something somewhat
familiar
● It can be controlled by specific parameters
Peregrinaggio di tre giovani figliuoli del re di Serendippo; Michele Tramezzino, Venice, 1557. Tramezzino claimed to have heard the story from
one Christophero Armeno who had translated the Persian fairy tale into Italian adapting Book One of Amir Khusrau's Hasht-Bihisht of 1302 [link]](https://image.slidesharecdn.com/pkfetdxyqpiy2i94fvzv-signature-25ed596523f4a669f9a710899d8eaf303c4bbdce8b8e80e99e004c3f91b28bcc-poli-151222094839/75/Recommender-Systems-18-2048.jpg)
![37
Performance implications
● Similarity between users is uncovered slowly
● Similarity between items is supposedly static
– Can be precomputed!
● Item-based clusters can also be precomputed
[source]](https://image.slidesharecdn.com/pkfetdxyqpiy2i94fvzv-signature-25ed596523f4a669f9a710899d8eaf303c4bbdce8b8e80e99e004c3f91b28bcc-poli-151222094839/75/Recommender-Systems-37-2048.jpg)
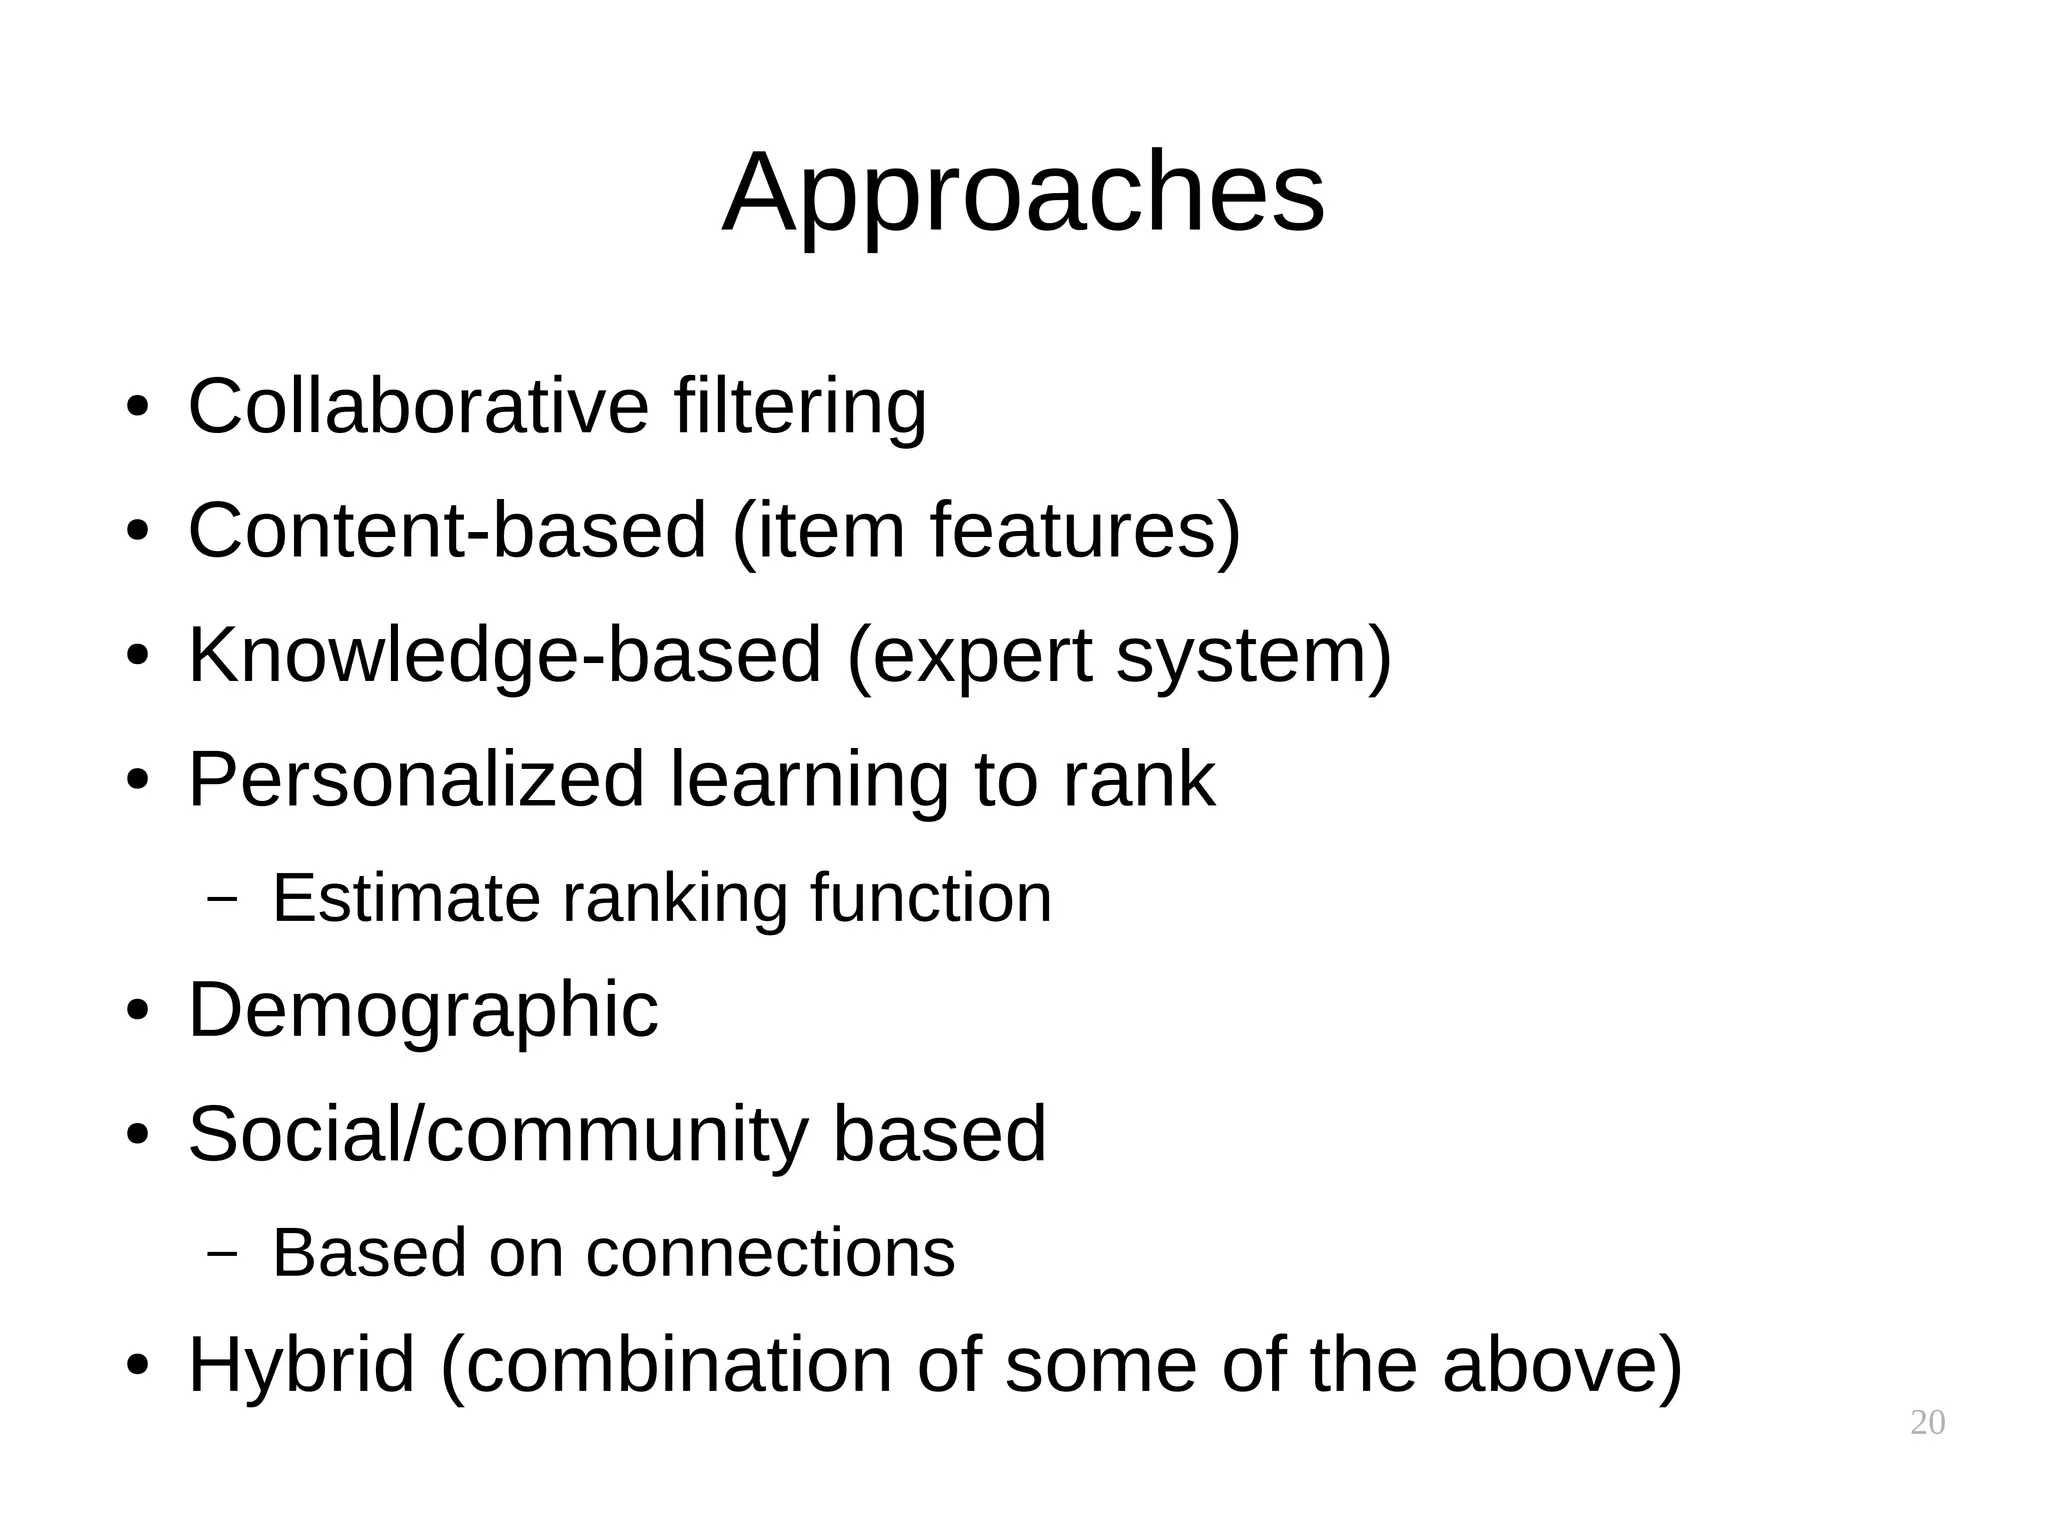
![41
Ordinary people and
extraordinary tastes
[Goel et al. 2010]
Distribution of user eccentricity: the median rank of consumed items.
In the null model, users select items proportional to item popularity](https://image.slidesharecdn.com/pkfetdxyqpiy2i94fvzv-signature-25ed596523f4a669f9a710899d8eaf303c4bbdce8b8e80e99e004c3f91b28bcc-poli-151222094839/75/Recommender-Systems-41-2048.jpg)
![43
2D projection of interests
[Koren et al. 2009]](https://image.slidesharecdn.com/pkfetdxyqpiy2i94fvzv-signature-25ed596523f4a669f9a710899d8eaf303c4bbdce8b8e80e99e004c3f91b28bcc-poli-151222094839/75/Recommender-Systems-43-2048.jpg)
![46
What is this plot?
[Koren et al. 2009]](https://image.slidesharecdn.com/pkfetdxyqpiy2i94fvzv-signature-25ed596523f4a669f9a710899d8eaf303c4bbdce8b8e80e99e004c3f91b28bcc-poli-151222094839/75/Recommender-Systems-46-2048.jpg)
![50
Illustration: batch gradient descent
vs stochastic gradient descent
Batch: gradient Stochastic: single-example gradient
[source]](https://image.slidesharecdn.com/pkfetdxyqpiy2i94fvzv-signature-25ed596523f4a669f9a710899d8eaf303c4bbdce8b8e80e99e004c3f91b28bcc-poli-151222094839/75/Recommender-Systems-50-2048.jpg)
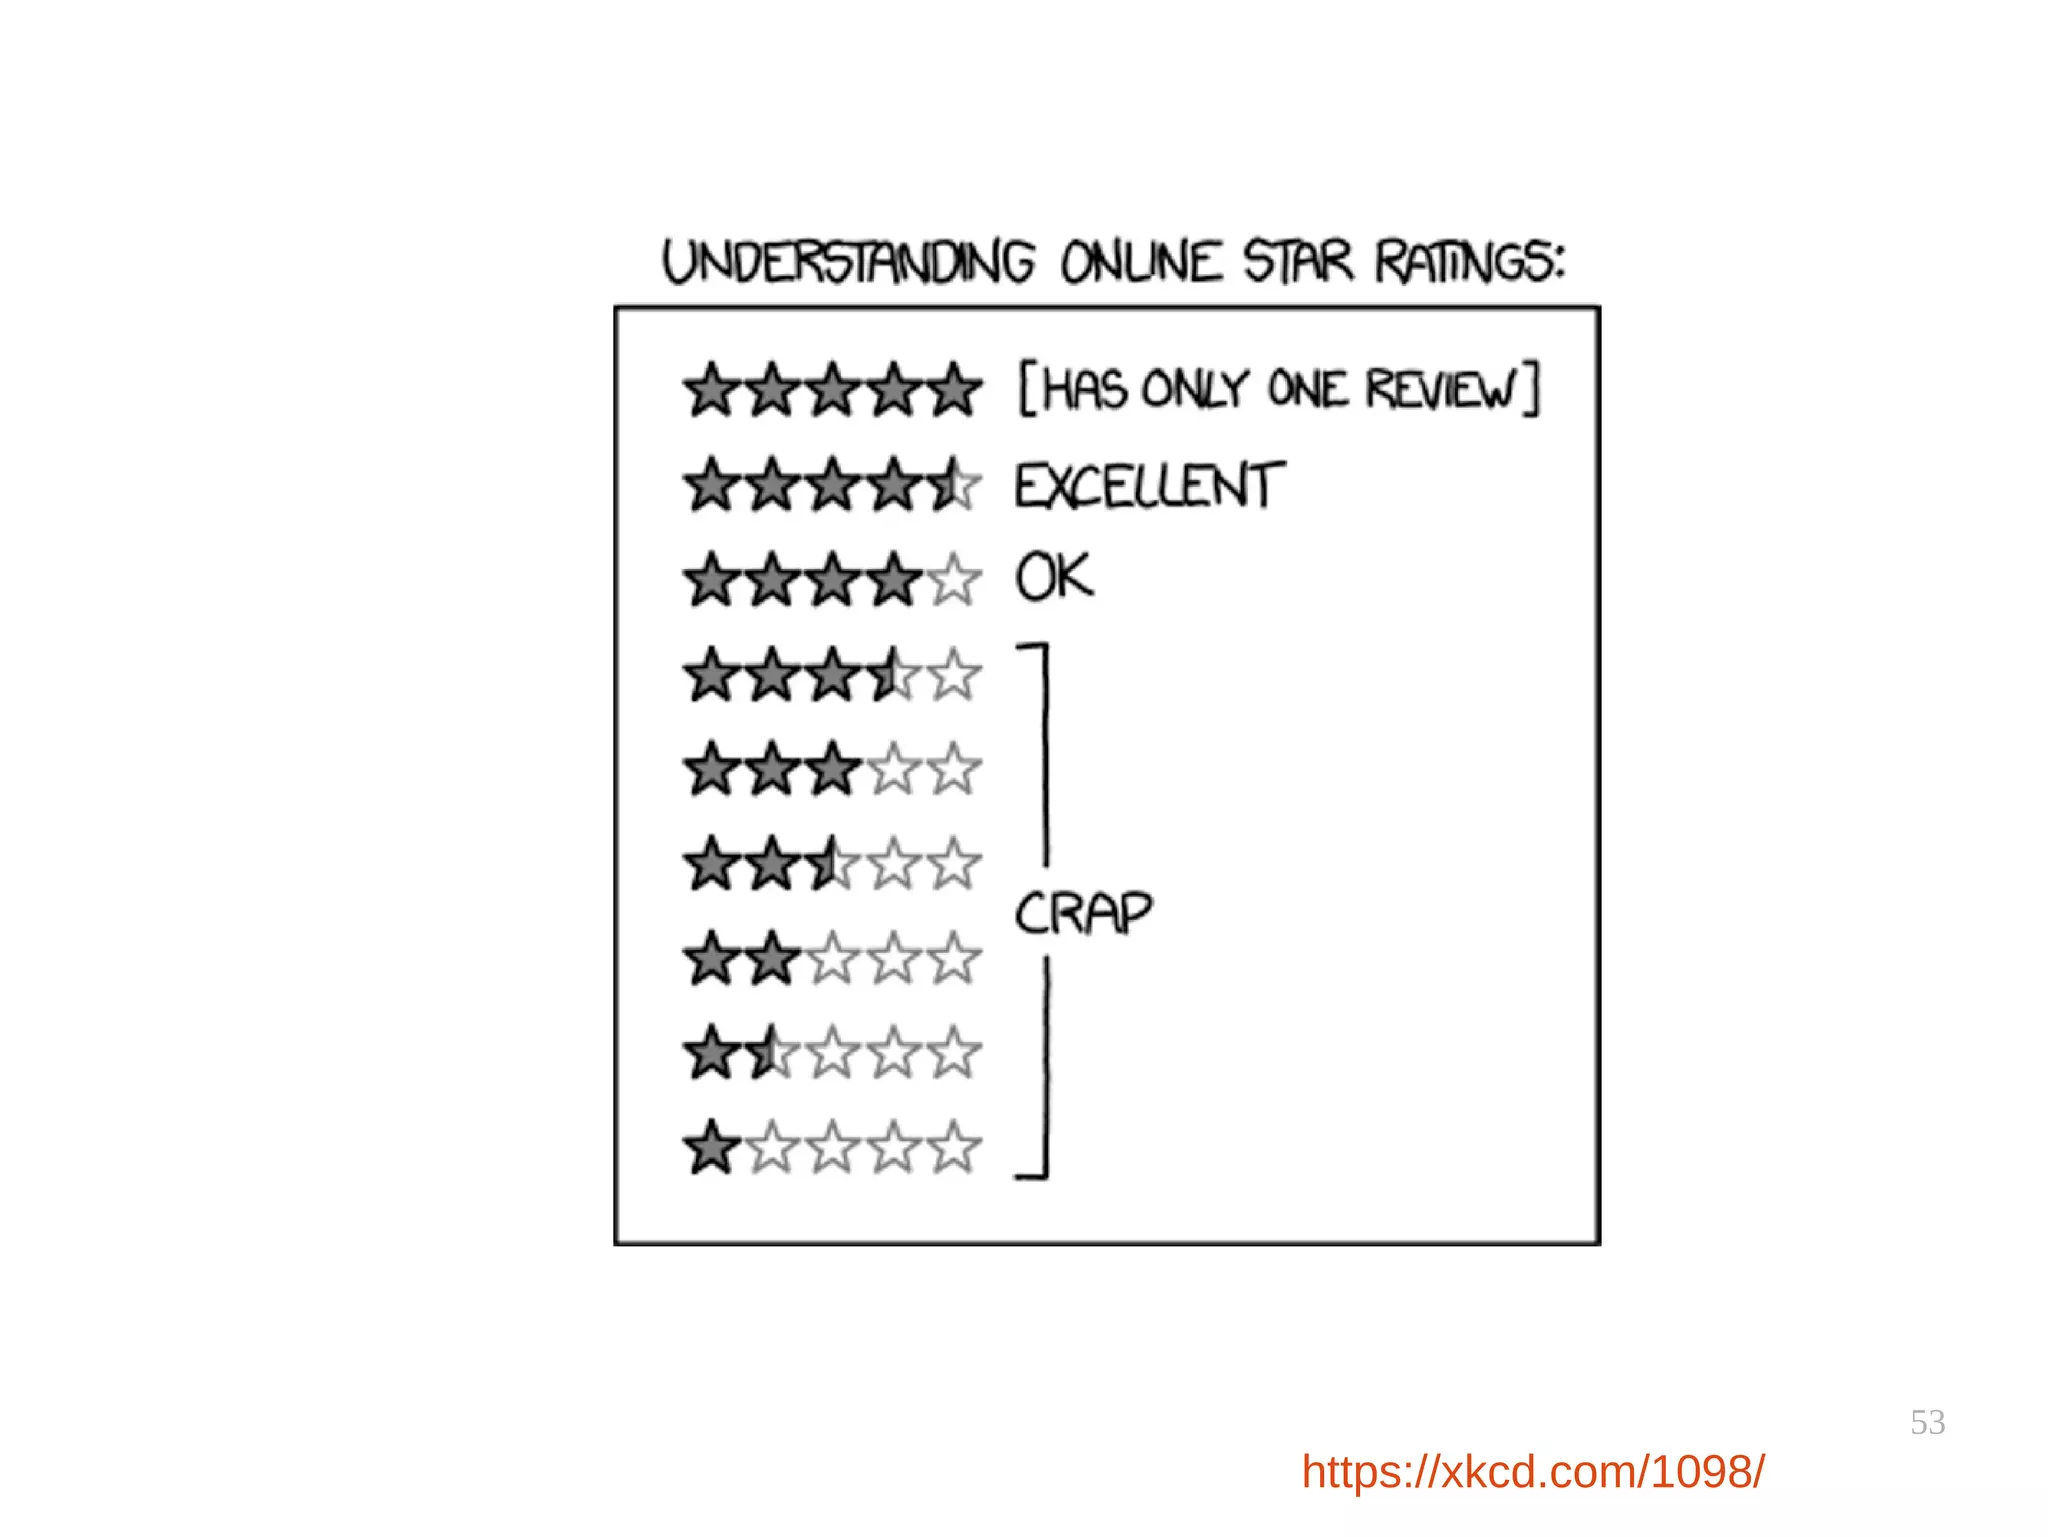
![54
Ratings are not normally-distributed
[Marlin et al. 2007, Hu et al. 2009]
Sometimes referred to as the “J” distribution of ratings
Amazon
(DVDs, Videos, Books)](https://image.slidesharecdn.com/pkfetdxyqpiy2i94fvzv-signature-25ed596523f4a669f9a710899d8eaf303c4bbdce8b8e80e99e004c3f91b28bcc-poli-151222094839/75/Recommender-Systems-54-2048.jpg)


![63
Example user testing
● [Liu et al. IUI 2010] News recommender](https://image.slidesharecdn.com/pkfetdxyqpiy2i94fvzv-signature-25ed596523f4a669f9a710899d8eaf303c4bbdce8b8e80e99e004c3f91b28bcc-poli-151222094839/75/Recommender-Systems-63-2048.jpg)
![65
Evaluation by RMSE
[Slide from Smola 2012]](https://image.slidesharecdn.com/pkfetdxyqpiy2i94fvzv-signature-25ed596523f4a669f9a710899d8eaf303c4bbdce8b8e80e99e004c3f91b28bcc-poli-151222094839/75/Recommender-Systems-65-2048.jpg)
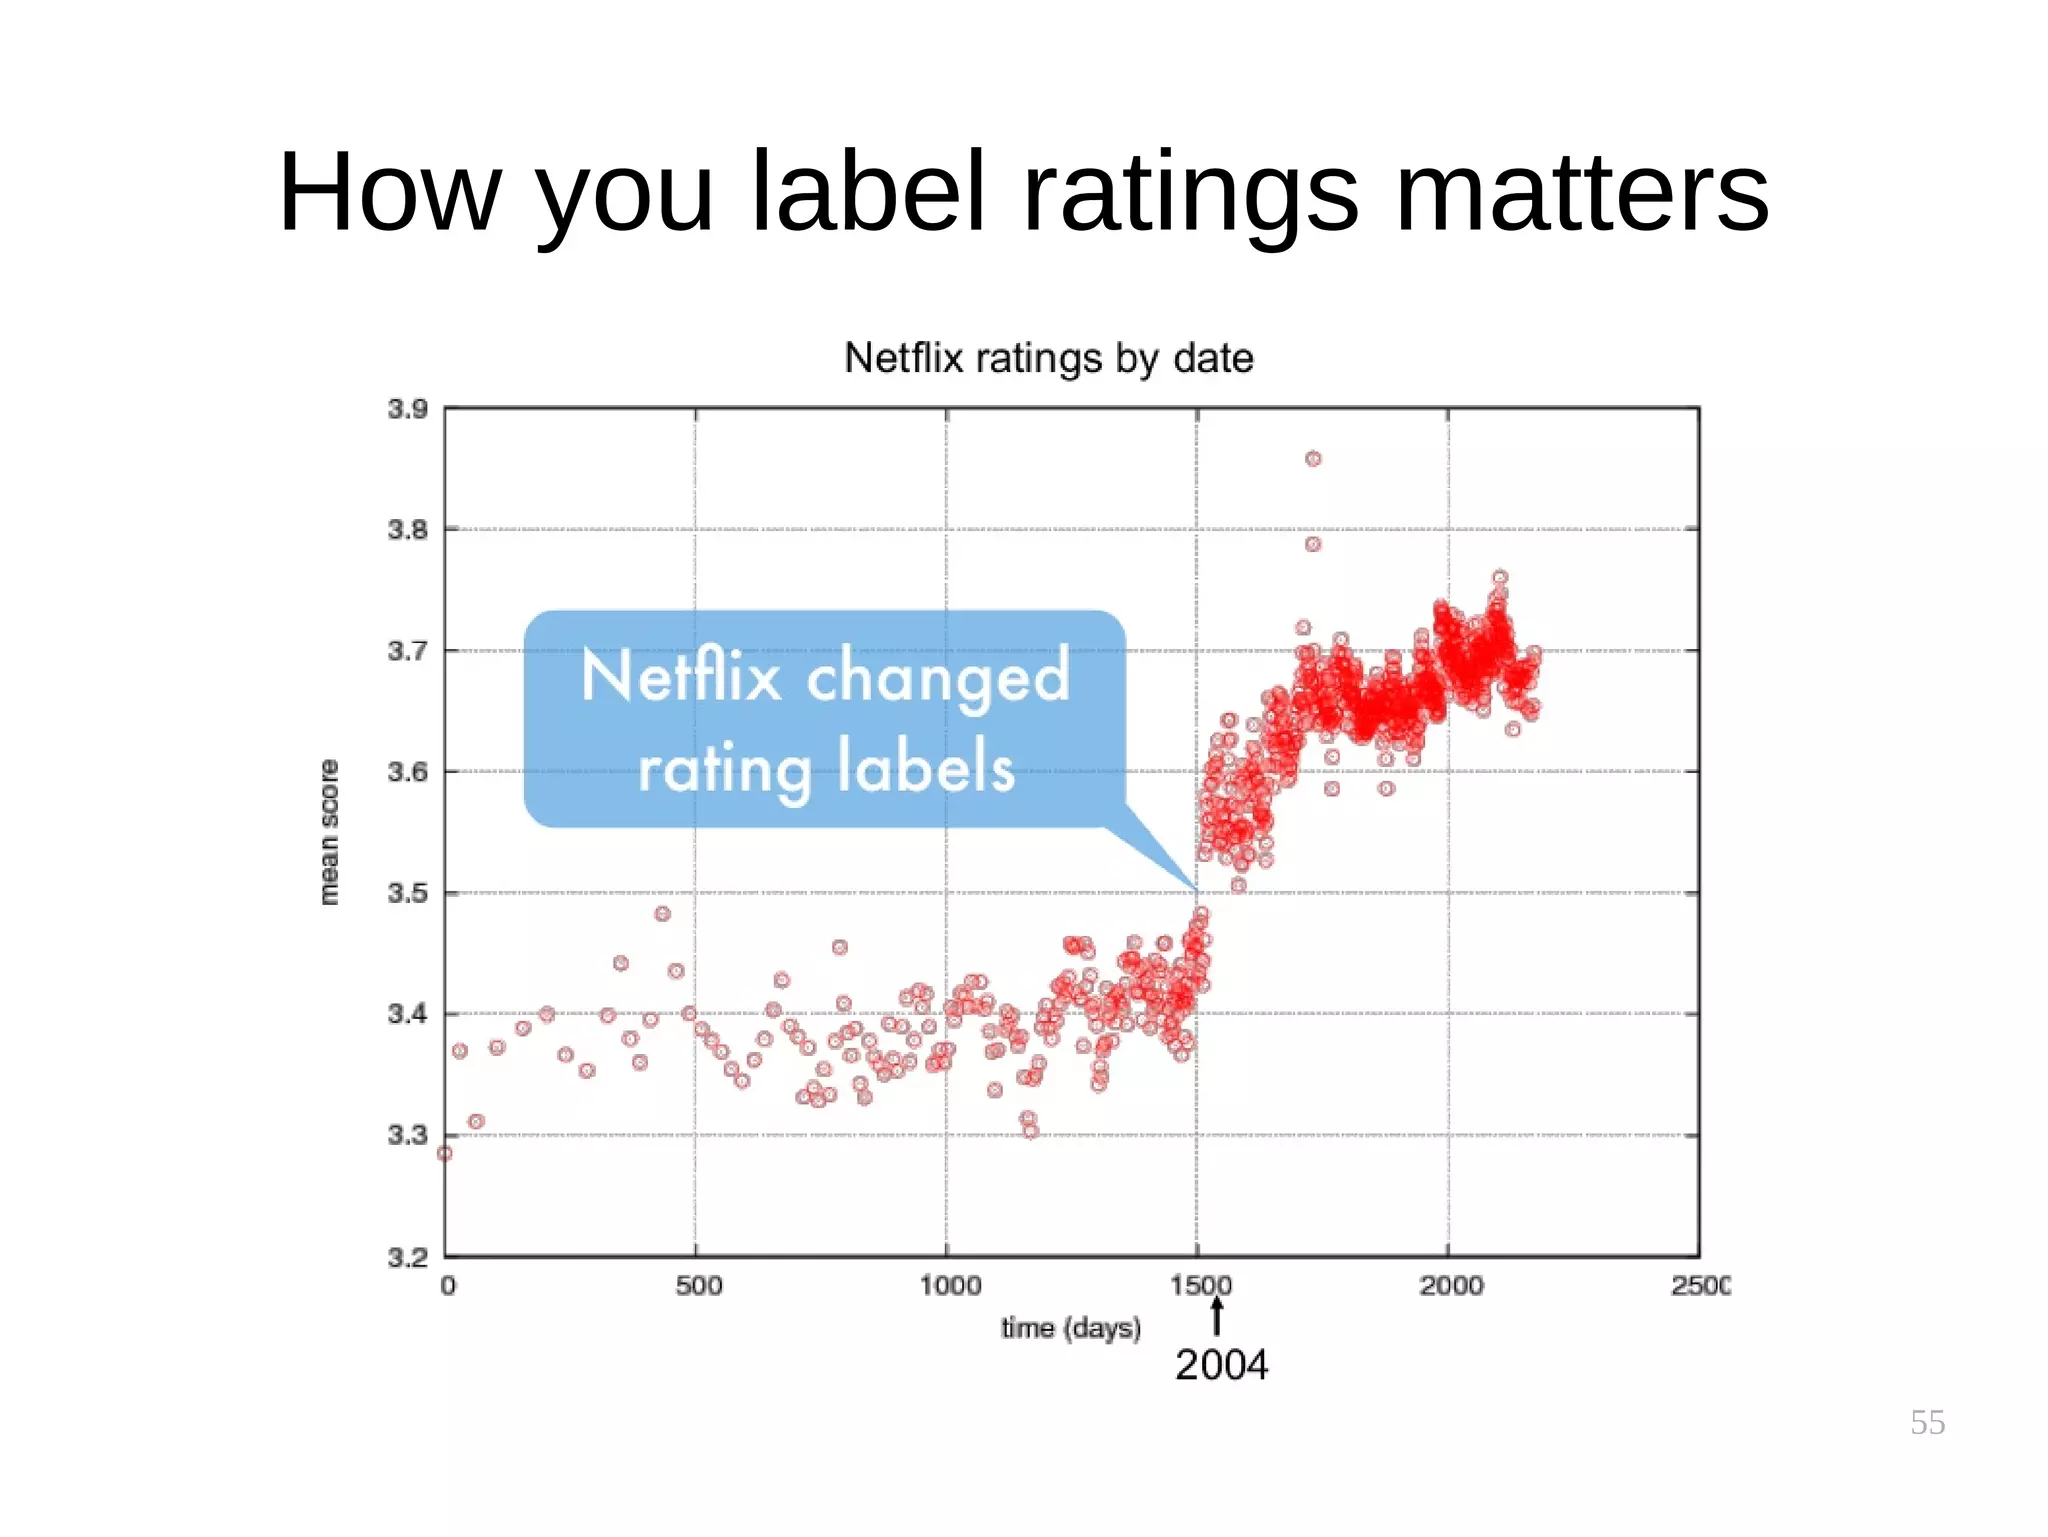
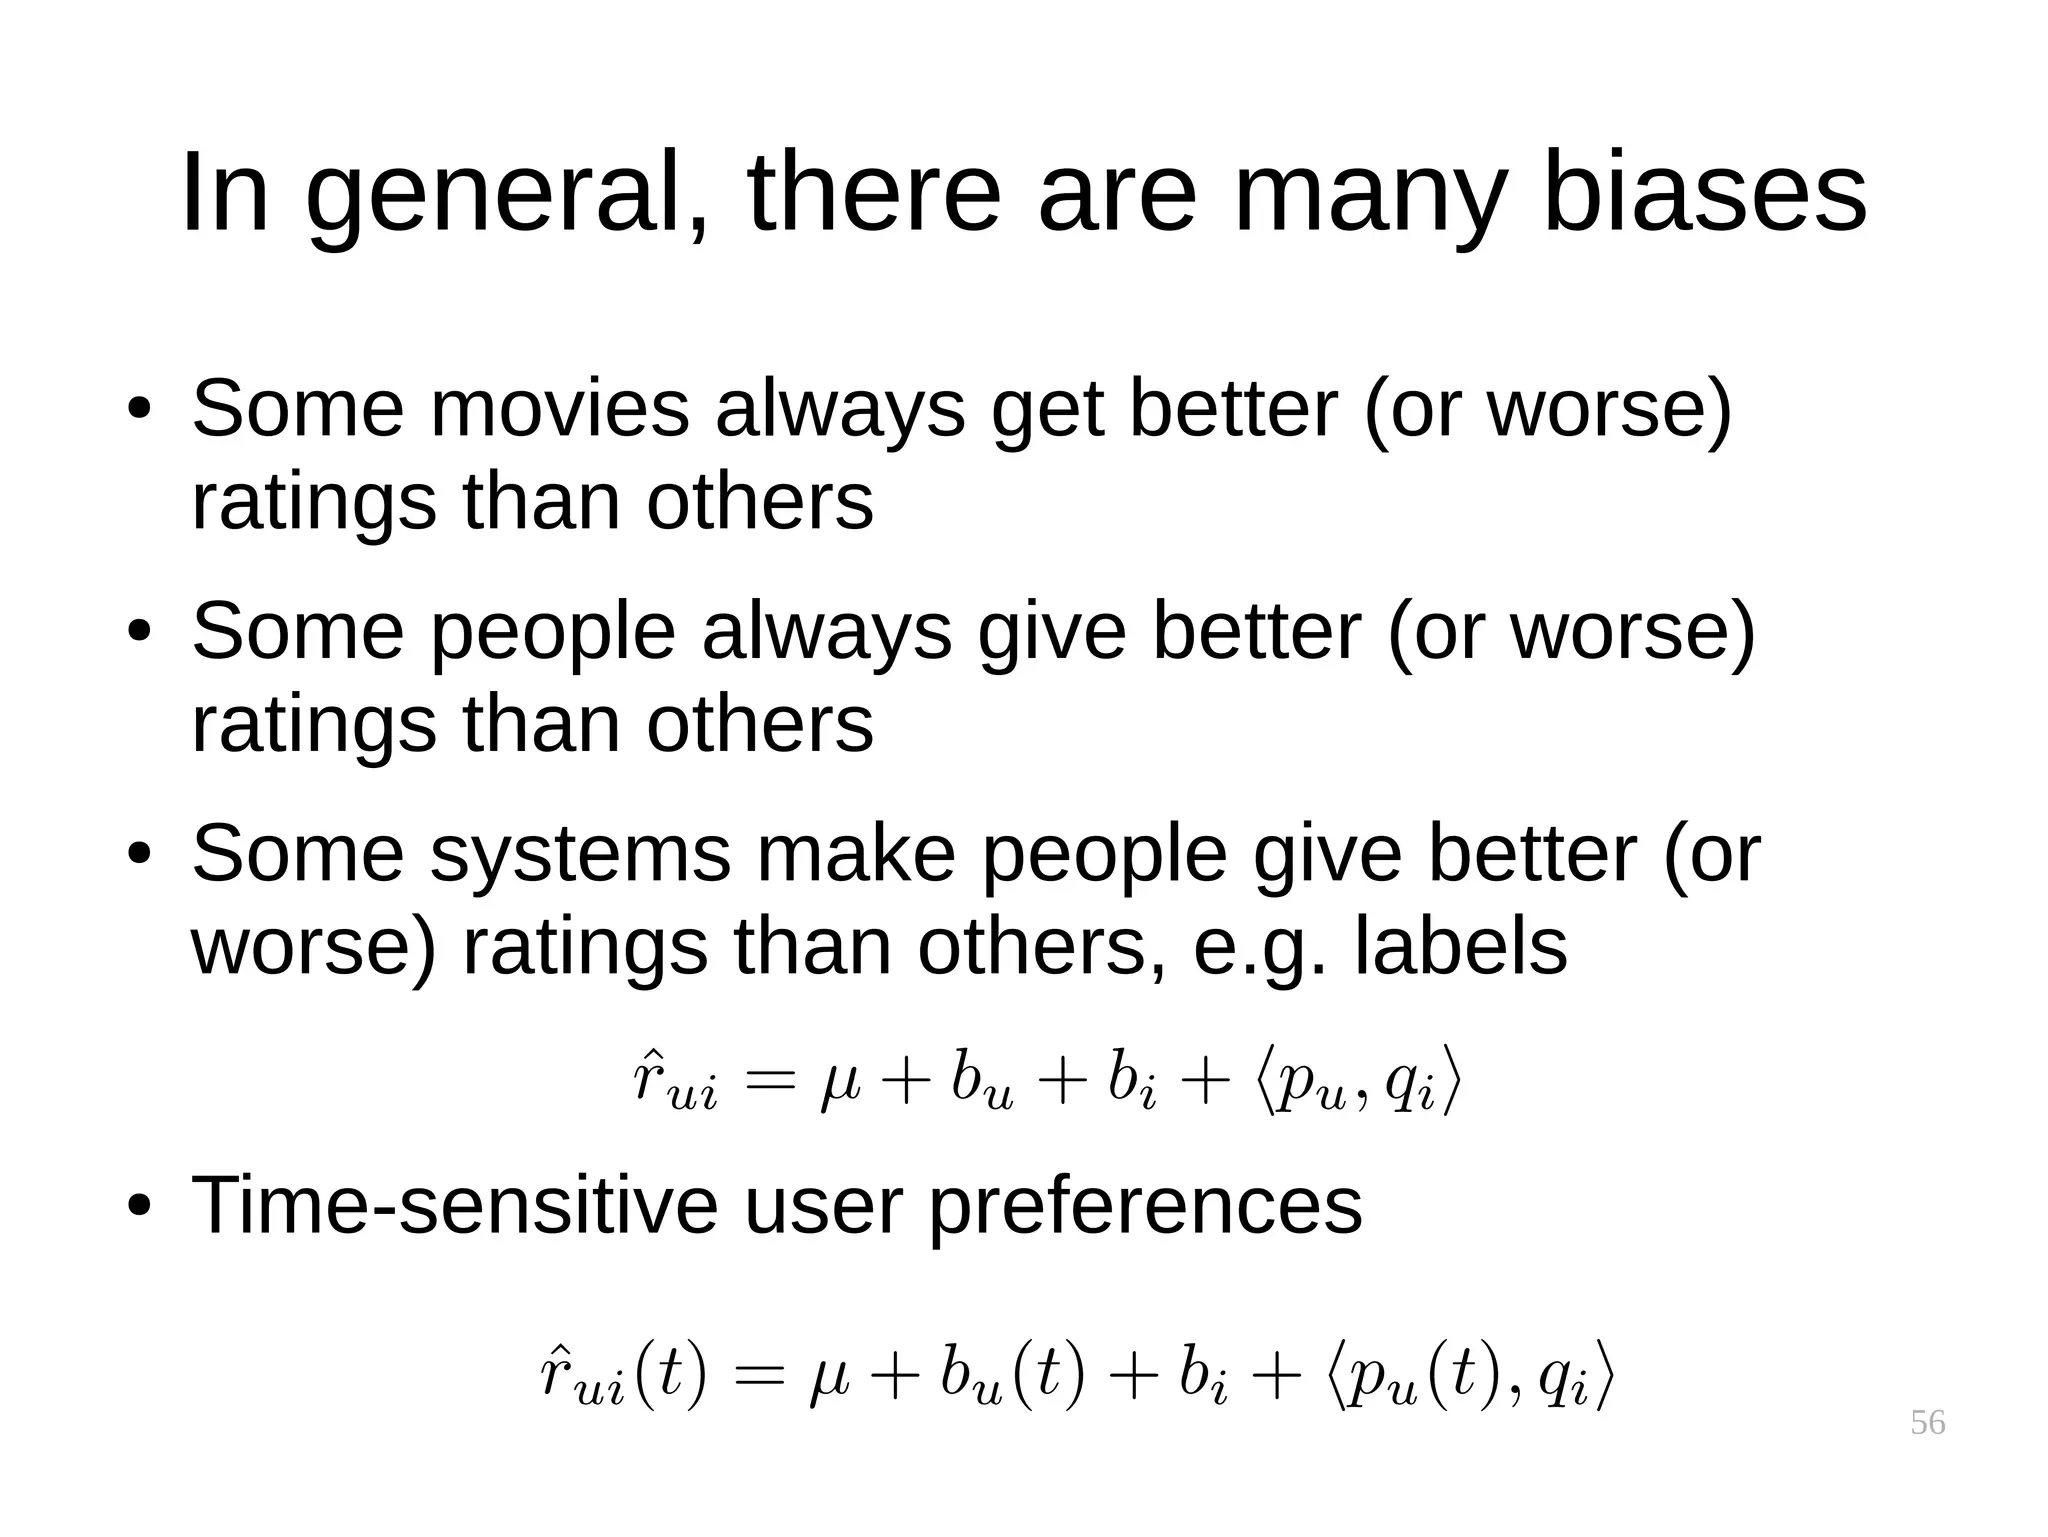
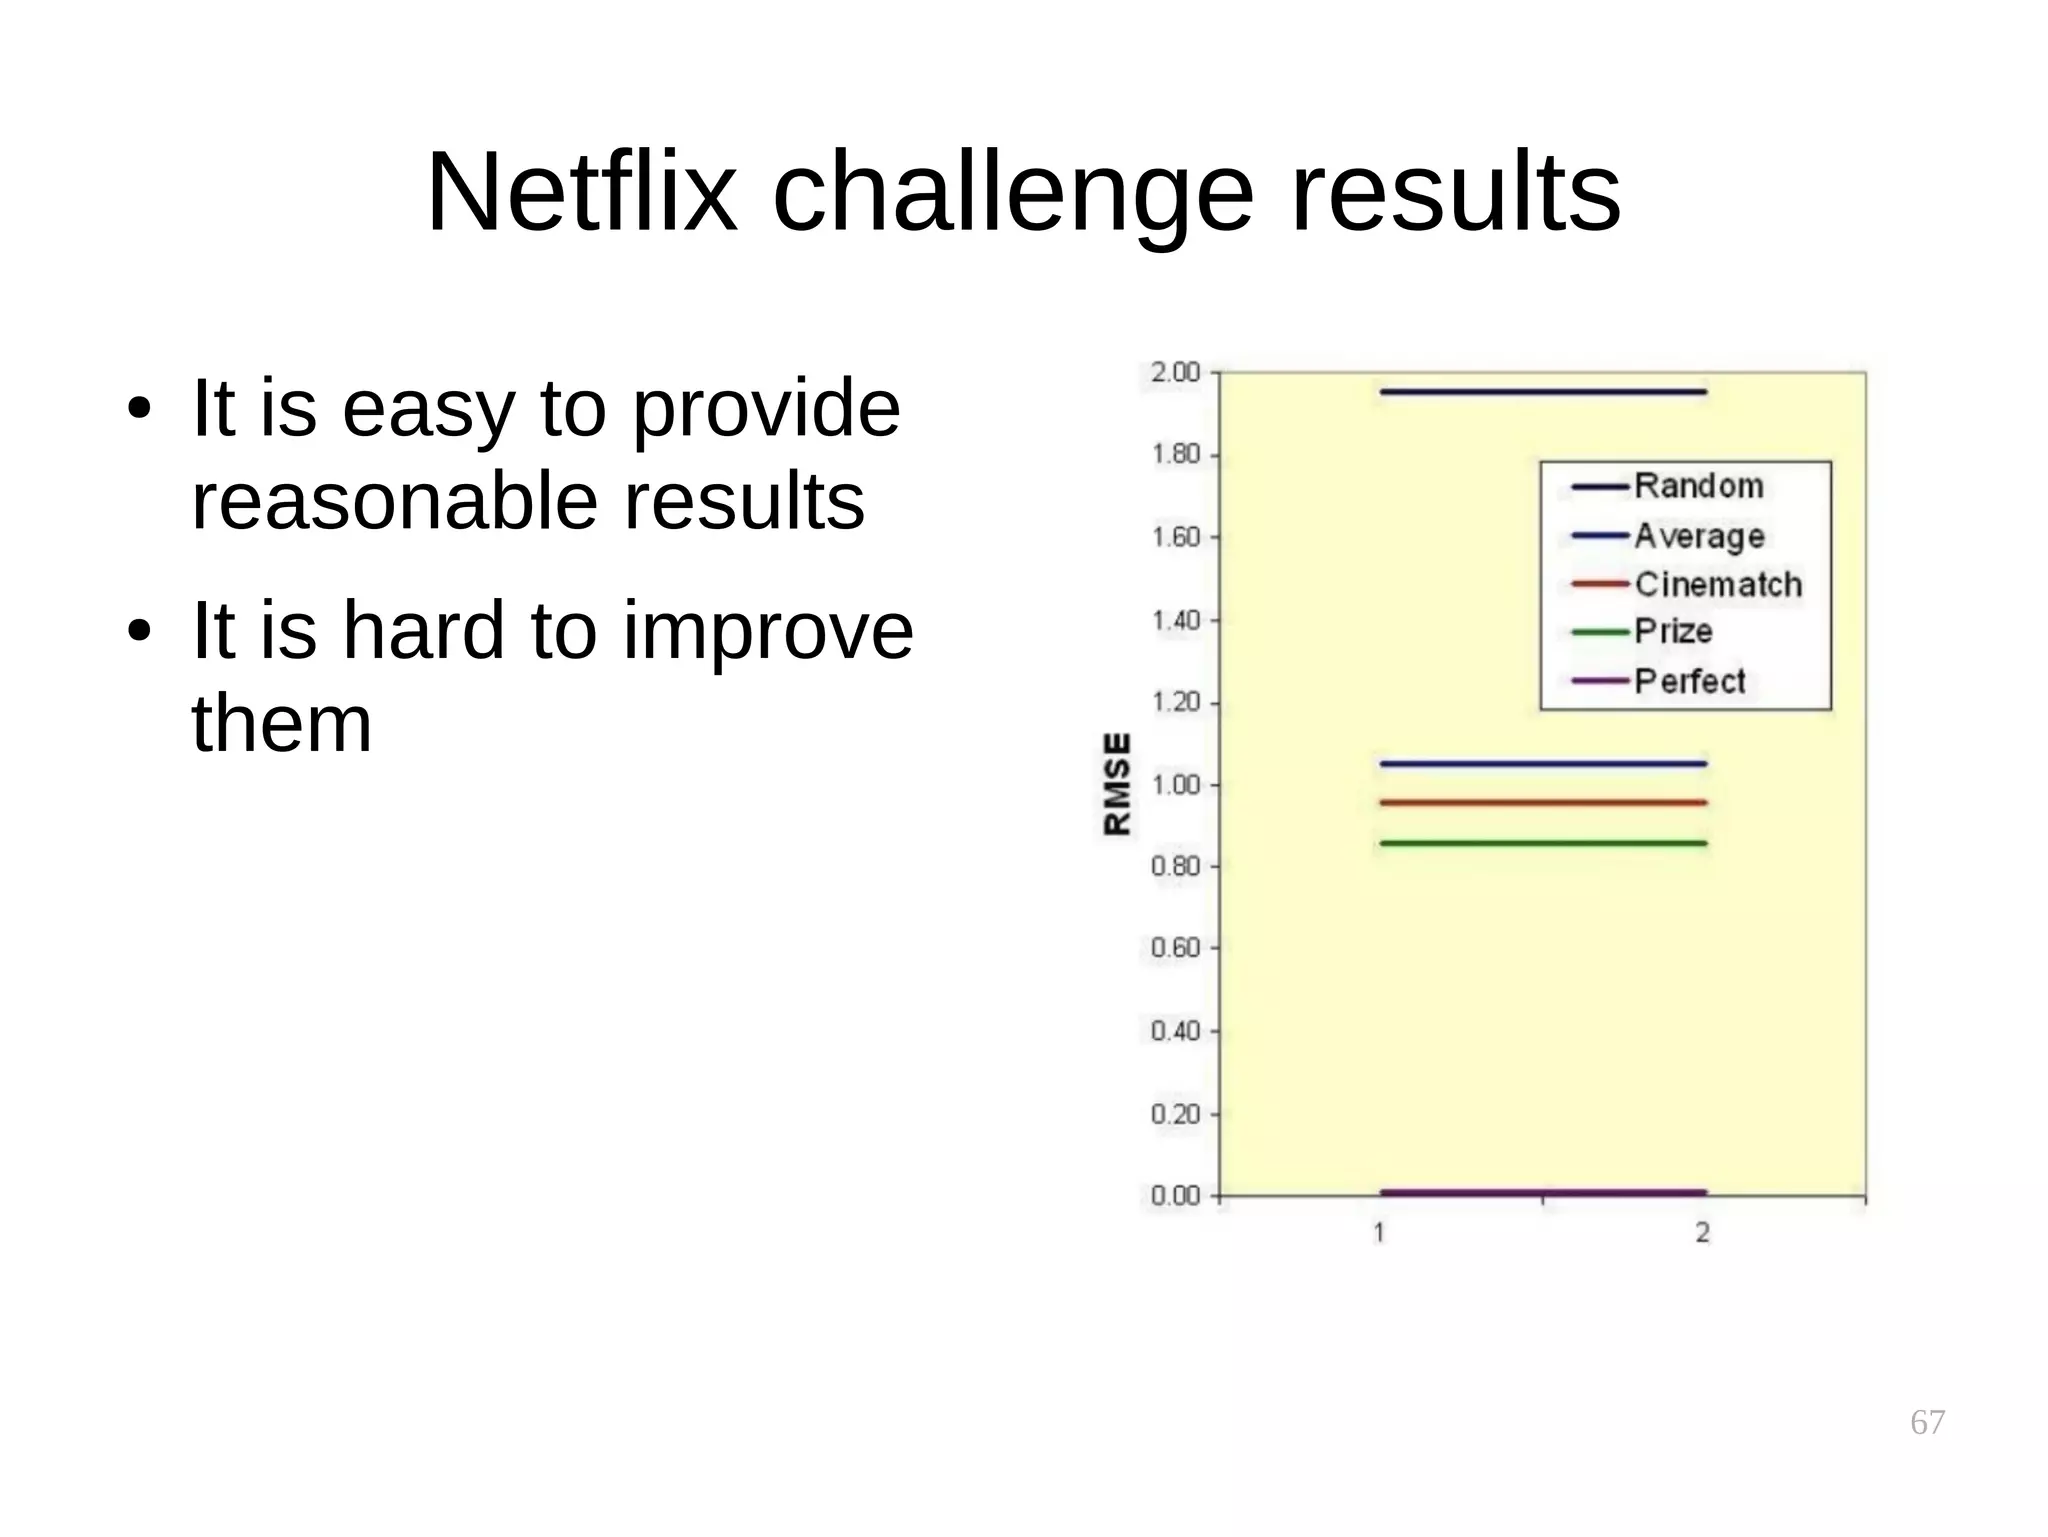
![66
Evaluation by RMSE
BIAS
TEMPORAL
FACTORS
[Slide from Smola 2012]](https://image.slidesharecdn.com/pkfetdxyqpiy2i94fvzv-signature-25ed596523f4a669f9a710899d8eaf303c4bbdce8b8e80e99e004c3f91b28bcc-poli-151222094839/75/Recommender-Systems-66-2048.jpg)

The document provides an overview of recommender systems, which are tools that suggest items to users based on various algorithmic methods. It discusses different types of recommendation approaches such as user-based, collaborative filtering, and content-based systems, along with challenges like the cold-start problem and biases in ratings. Key aspects like data processing, user trust, and evaluation methodologies are also addressed to understand how these systems function and their importance in increasing user satisfaction and sales.


![Coded Agents – with UiPath SDK + LangGraph [Virtual Hands-on Workshop]](https://cdn.slidesharecdn.com/ss_thumbnails/codedagentsdeck-251215155422-5497c599-thumbnail.jpg?width=640&height=640&fit=bounds)


