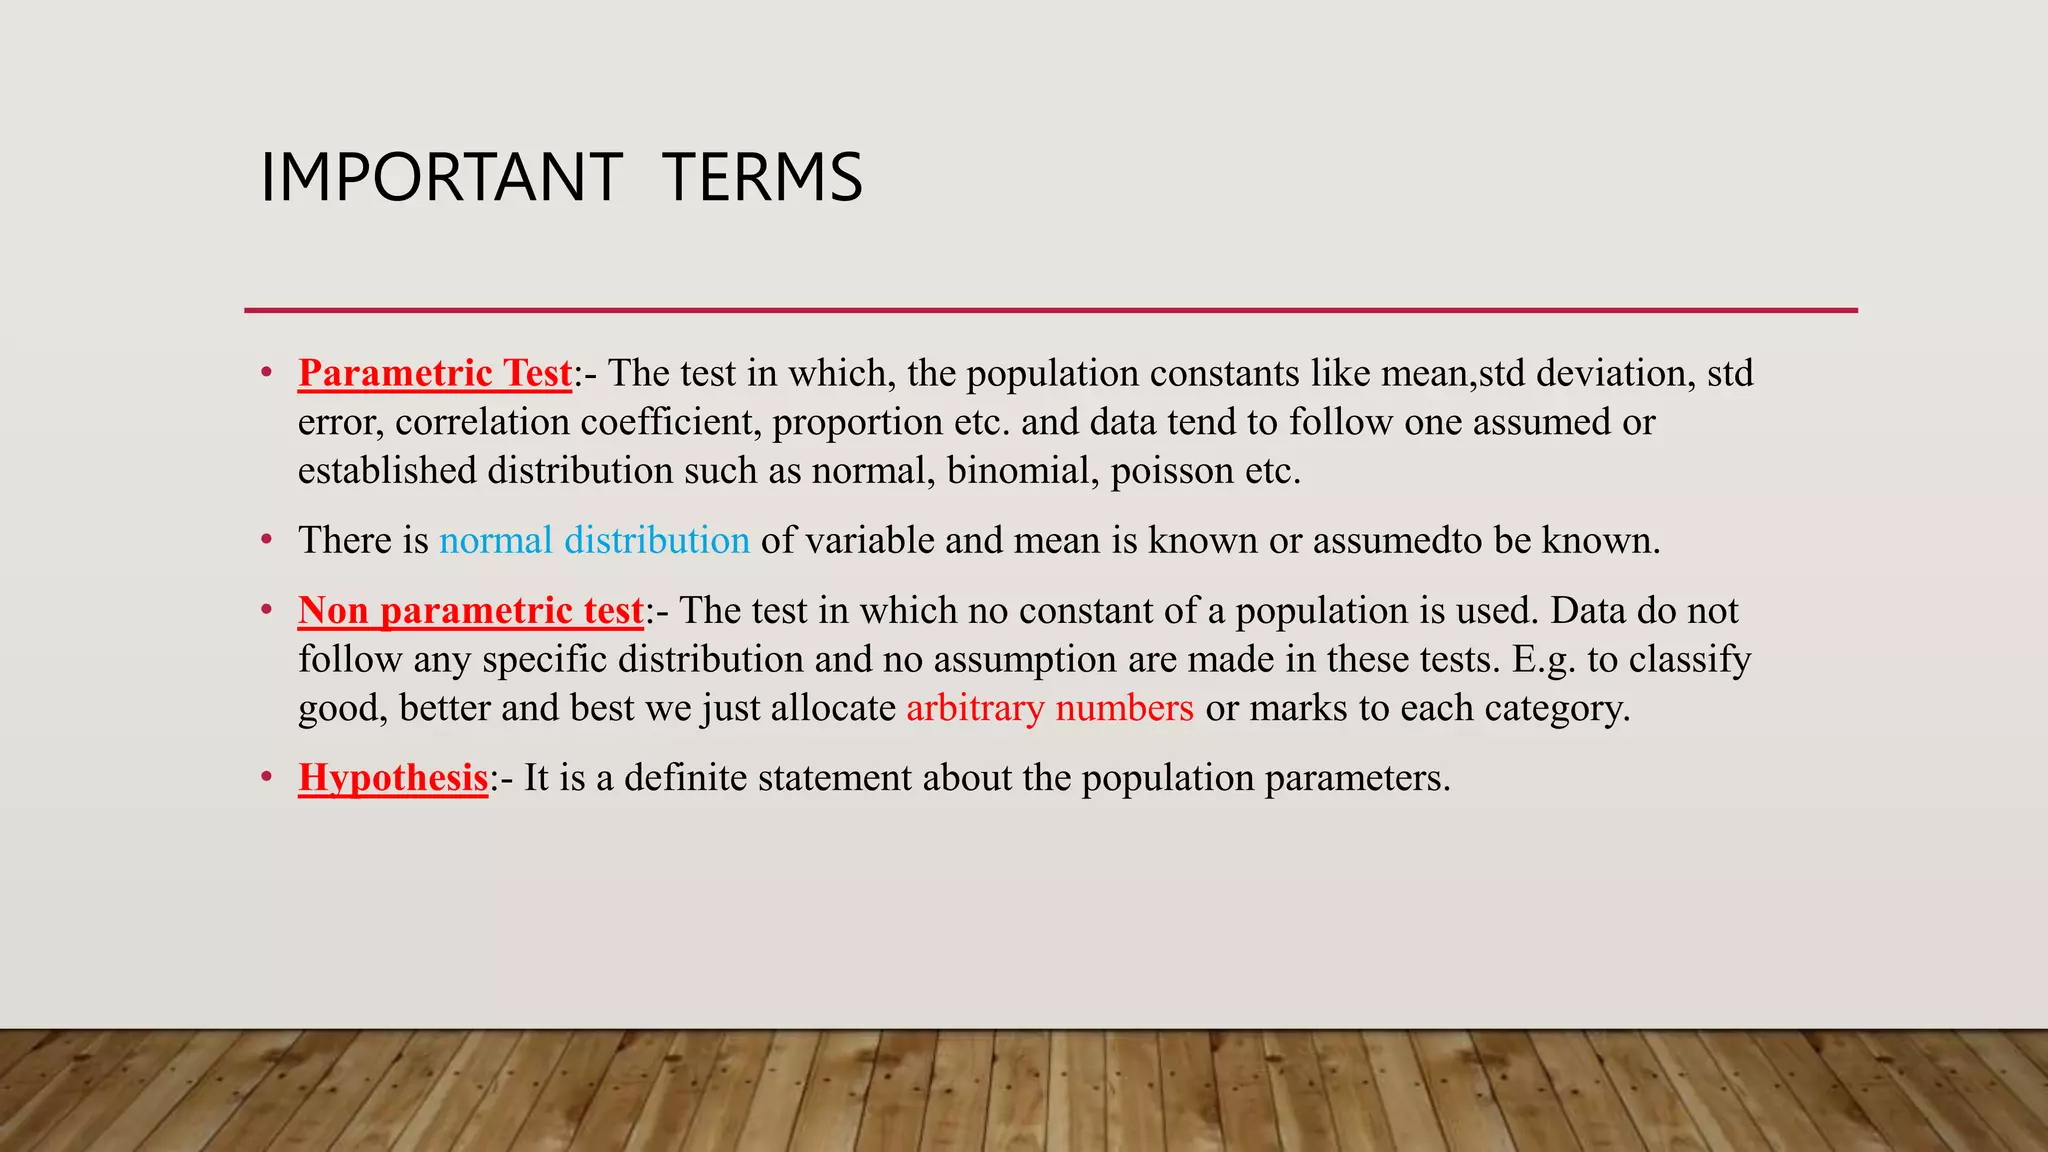
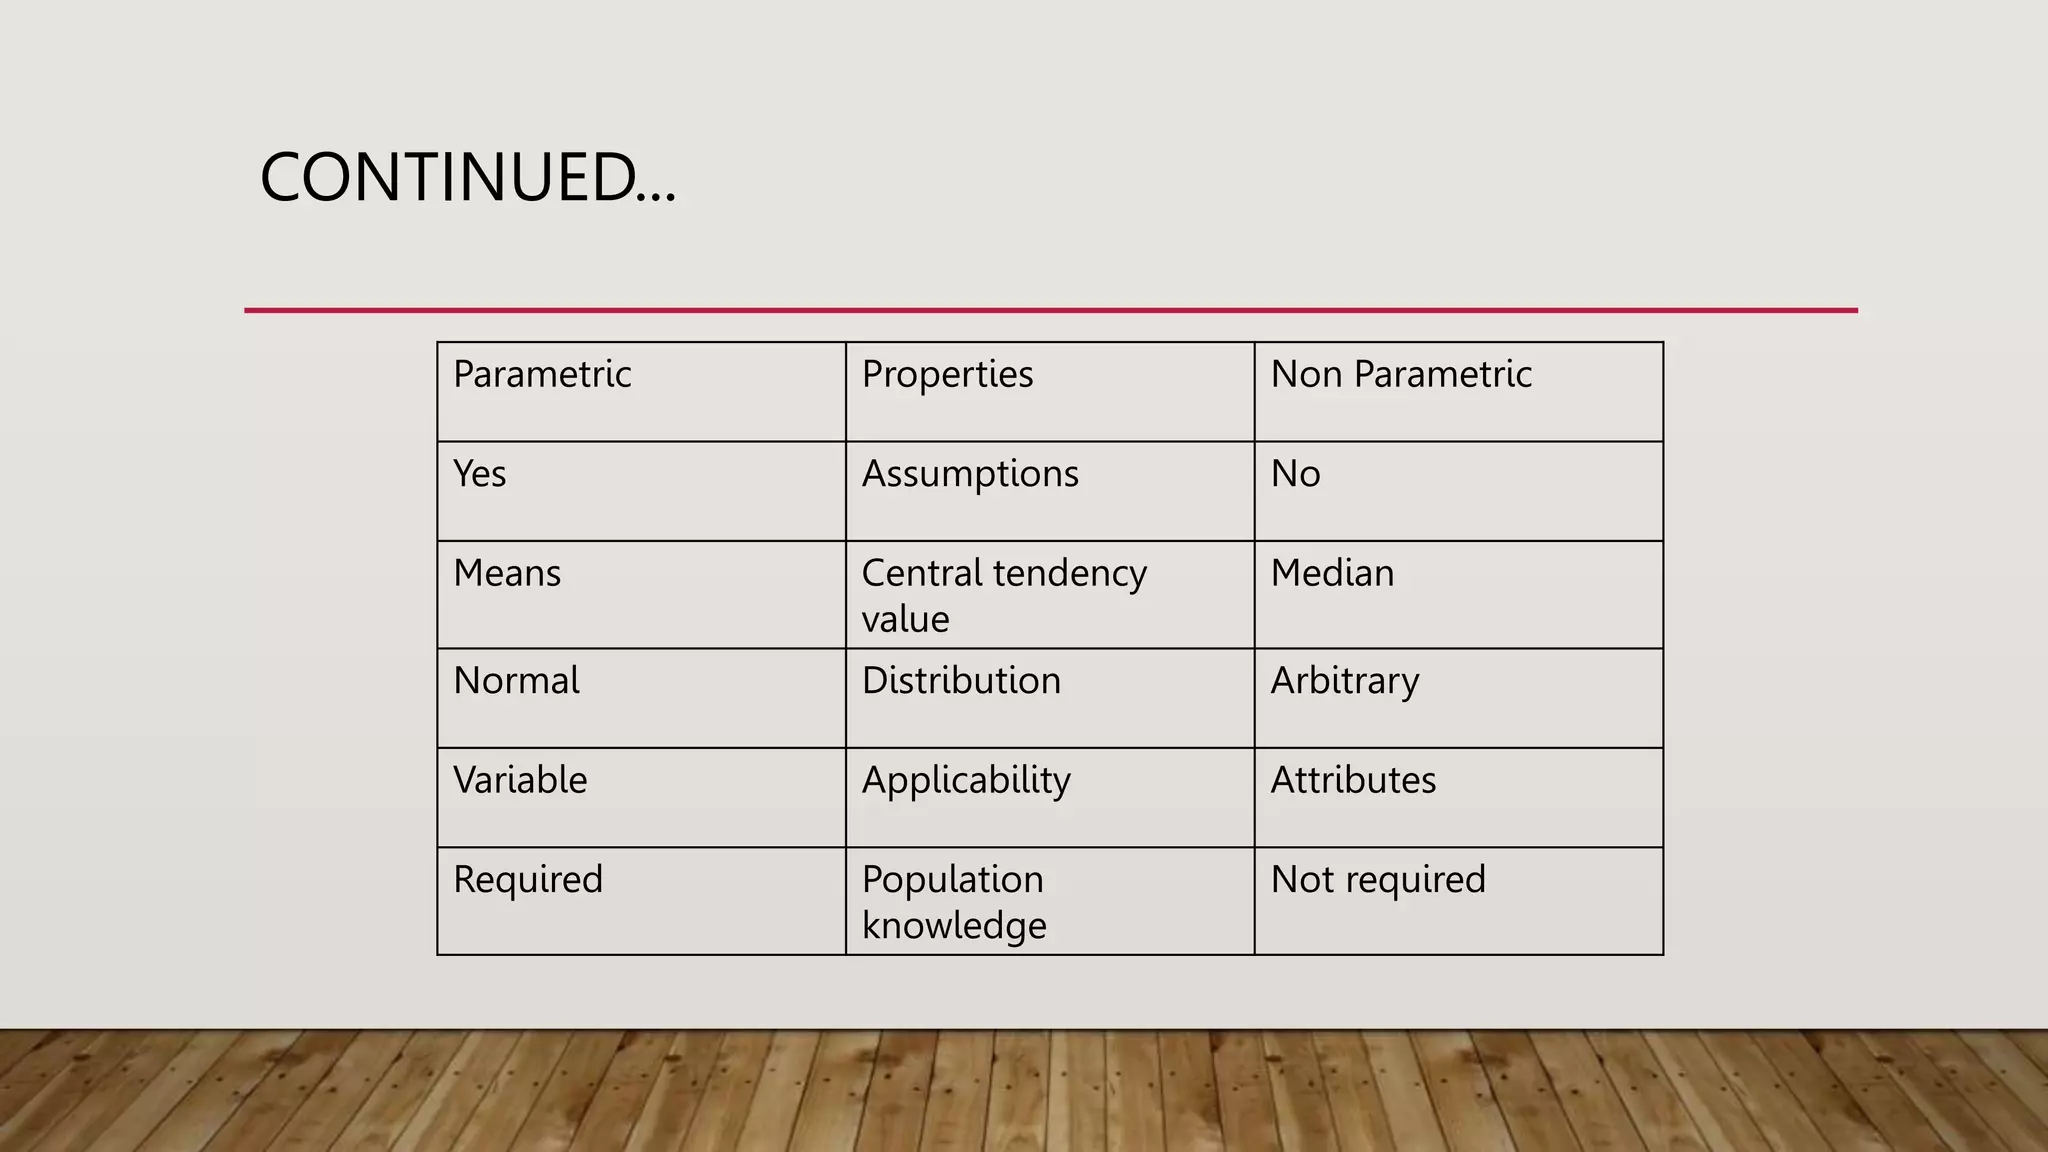
Call Girls Jp Nagar Just Call 7001305949 Top Class Call Girl Service Available
chi_square test.pptx
1. Department of Pharmaceutical Sciences
Guru Jambheshwar University of Science and Technology
Presentation on Chi-square Test & Student-T Test
Submitted to:- Dr. Rekha Rao Submitted by:- Rajat
Khurana
(Assistant Professor)
(M.Pharmacy)
2. IMPORTANT TERMS
• Parametric Test:- The test in which, the population constants like mean,std deviation, std
error, correlation coefficient, proportion etc. and data tend to follow one assumed or
established distribution such as normal, binomial, poisson etc.
• There is normal distribution of variable and mean is known or assumedto be known.
• Non parametric test:- The test in which no constant of a population is used. Data do not
follow any specific distribution and no assumption are made in these tests. E.g. to classify
good, better and best we just allocate arbitrary numbers or marks to each category.
• Hypothesis:- It is a definite statement about the population parameters.
3. CONTINUED...
Parametric Properties Non Parametric
Yes Assumptions No
Means Central tendency
value
Median
Normal Distribution Arbitrary
Variable Applicability Attributes
Required Population
knowledge
Not required
4. CONTINUED….
• Null hypothesis:-(H0) states that no association exists between the two cross-tabulated variables in
the population, and therefore the variables are statistically independent. E.g. if we want to compare
2 methods method A and method B for its superiority, and if the assumption in that both methods
are equally good, then this assumption is called as NULL HYPOTHESIS.
• Alternative hypothesis:- (H1) proposes that the two variables are related in the population. If we
assume that from 2 methods, method A is superior than method B, then this assumption is called as
ALTERNATIVE HYPOTHESIS
• Degree of freedom:- It denotes the extent of independence (freedom) enjoyed by a given set of
observed frequencies.Suppose we are given a set of n observed frequencies which are subjected to k
independent constraints(restrictions).
5. INTRODUCTION
• The chi-square test is an important test amongst the several tests of significance developed by
statisticians.
• Is was developed by Karl Pearson in1900.
• It is a non parametric test not based on any assumption or distribution of any variable.
• This statistical test follows a specific distribution known as chi square distribution.
• In general The test we use to measure the differences between what is observed and what is
expected according to an assumed hypothesis is called the chi-square test.
6. DEFINITIONS USED TO DETERMINE CHI SQUARE
• Observed value:- The value which we actually get practically known as observed value.
• Expected value:- The value which we get by our thought process i.e. by expectation
example, perhaps the sale of chloroquine will increase by 20% during the rainy season.
• Formula for finding the chi square is given by:-
7. HOW TO APPLY??
• There are various of the steps from which we can determine the chi square values:-
• Step-1:-Firstly apply the formula:-
• Step-2:-After getting chi square values, look at the degree of freedom by the help of level of
significance means how much %age of data will be match from the real data i.e. how much there
will be chances that our data will be match from the real ones.
Degree of freedom= (c-1) (r-1)
• Step-3:-Now degree of freedom will be matched in chi square table along with the level of
significance,
• Step-4:-If table value exceeds from the calculated value then it will be accepted otherwise it will
be rejected.
8. CONTINUED….
• If table value > calculated value then the null hypothesis will be accepted.
• But, if calculated value > table value then the null hypothesis is rejected and alternate
hypothesis is automatically accepted.
• For more categories:-
11. CHI- SQUARE CALCULATION
The chi square is the sum of:-
X²=23.57
Degree of freedom is given by:-(Columns-1) (Rows-1)
(5-1) (4-1) = 12
12. CONTINUED....
• Significance level:- 0.05
• X² (Calculated) = 23.57
• X² (Tablular)= 21.03
• So,X²(Calculated) > X² (Tabular)
• Therefore,' we reject null hypothesis & alternate hypothesis is automatically
accepted means there is significant relation between the marital status &
educational qualification.
13. APPLICATIONS OF CHI-SQUARE
• Chi-square is most commonly used when data are in frequencies such as the number of
responses in two or more categories.
• Chi-square is very useful in research.
• The important applications of chi-square in medical statistics are:-
1. Test of proportion.
2. Test of association.
3. Test of goodness of fit.
14. STUDENT T-TEST
• The t-test is a statistical test used to compare the means of two groups.
• It is often used in hypothesis testing to determine whether a process or treatment actually
has an effect on population of interest or whether two groups are different from each
other.
• For multiple groups, you would have to compare each pair of groups example, with three
groups there would be three test [AB,AC,BC], whilst with seven groups there would need
to be 21 tests.
15. CONTINUED….
• The t-test assumes:-
1. A normal distribution [parametric data].
2. Underlying variances are equal.
• There are two main types of t-test:-
1. Independent measures t-test:- when samples are not matched.
2. Matched pair t-test:- when samples appears in pairs.
• It is generally used to find out the p-value (probability) which can be used to accept or reject
the null hypothesis.
17. USES OF T-TEST
• When the sample size is small (n<30).
• Degree of freedom is (C-1) (R-1).
• T-test is used for the test of significance of regression coefficient in regression modelling.
• We use t-test when parameter of population are normal.
• Population variable are unknown.
• Correlation of coefficient in population is zero.