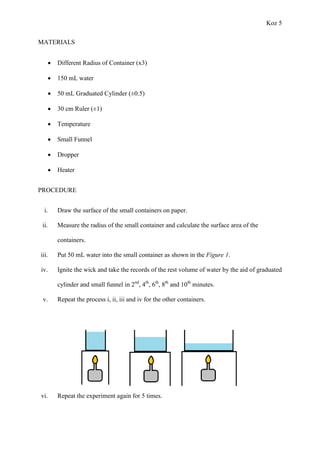
SlideShare a Scribd company logo
Koz 1
INTERNATIONAL BACCALAUREATE
CHEMISTRY LAB REPORT
EFFECTS OF THE SURFACE AREA ON THE EVAPORATION RATE
Candidate: Serra Koz
Supervisor: ---
May 2014
Koz 2
BACKGROUND INFORMATION
Matter is anything that has mass and volume. The three common forms of matter on Earth,
called the states of matter, are solid, liquid, and gas. A solid has a definite shape and volume;
a liquid has a definite volume but no definite shape; a gas has no definite volume or shape.
Substances commonly exist in one of the three states, but they can be in any one of the three
states depending on temperature. For example, water is commonly a liquid, but when cooled it
forms a solid called ice. When liquid water is heated, it forms a gas.
The state of matter doesn't change the kind of particles of which a substance is made. Instead,
the states of matter differ in how close their particles are as well as how tightly bonded the
particles are. For example, each particle of liquid, gas, or solid water is made of one atom of
oxygen combined with two atoms of hydrogen. Water particles in the gas state are far apart.
Liquid water particles are closer together, and some are bonded to one another. Solid water
particles, called ice, are close together and are the most tightly bonded.
When water changes from one state to another, there is a gain or loss of energy. States of
matter in order from least to most energy are solid, liquid, gas. To change to a higher energy
state, such as when water changes from ice (solid) to liquid or from a liquid to a gas, heat
must be added. The process of changing from a solid to a liquid is called melting. The process
of changing from a liquid to a gas is called vaporizing.
If vaporization happens at the surface of a liquid, the process is called evaporation. The
gaseous state of a substance at a temperature at which that substance is usually in a solid or
liquid state is called a vapor. When water evaporates, vapor is formed. Evaporation rate is the
amount of liquid that evaporates in a certain amount of time.1
When it evaporates, the liquid water in a lake, a stream, or the ocean changes to water vapor
and rises into the air. Depending on temperature and other weather conditions, the water
vapor will eventually condense into clouds and fall again to Earth as a liquid (rain), a solid
Koz 3
(snow, sleet, or hail), or it may condense on surfaces as dew. Several different factors can
affect the rate of evaporation, including heat, wind, relative humidity, and surface area. The
rate of evaporation increases as the heat from the Sun increases, the wind strengthens, the
relative humidity decreases, and the surface area expands.2
AIM: The intent of this investigation is to observe the effects on the surface area in the
evaporation rate.
RESEARCH QUESTION: How does surface area effects the evaporation rate?
HYPOTHESIS: If the surface area increases, then the rate of evaporation increases.
Koz 4
VARIABLES
Independent
Variables: Surface Area of Liquid/cm2
The surface area of the liquid did not change
during the experiment and the radius of the
container measured by the ruler and calculated
the formul of the πr2
.
Dependent
Variables:
Period of the Time /s (0, 2, 4,
6, 8, 10)
The period of the time was constant during the
experiment. The period of the time can be
changed the evaporation rate.
Room Temperature/°C (25°C)
The initial volume of the water was constant
during the experiment and measured by the
thermometer. It caused of the difference
between the evaporation rate.
Controlled
Variables:
Length between the Container
and Heater/ cm (3 cm)
The length between the container and heater
measured by the ruler. If it was changed, the
the reaction time changed.
Initial Volume of the
Water/mL (50 mL)
The initial volume of the water was same
during the experiment and measured by the
graduated cylinder. If the volume of the
graduated cylinder changed, evaporation rate
can be changed as well.
Koz 5
MATERIALS
 Different Radius of Container (x3)
 150 mL water
 50 mL Graduated Cylinder (±0.5)
 30 cm Ruler (±1)
 Temperature
 Small Funnel
 Dropper
 Heater
PROCEDURE
i. Draw the surface of the small containers on paper.
ii. Measure the radius of the small container and calculate the surface area of the
containers.
iii. Put 50 mL water into the small container as shown in the Figure 1.
iv. Ignite the wick and take the records of the rest volume of water by the aid of graduated
cylinder and small funnel in 2nd
, 4th
, 6th
, 8th
and 10th
minutes.
v. Repeat the process i, ii, iii and iv for the other containers.
vi. Repeat the experiment again for 5 times.
Koz 6
Figure 1
DATA COLLECTION & PROCESSING
Calculation 1:
Take the π=3.
Calculate the area of the small container:
 The diameter of the container is 10 cm.
 The radius of the container is 5 cm.
2𝜋𝑟2
= 2𝜋52
𝐴 = 150 𝑐𝑚2
Calculate the area of the middle container:
 The diameter of the container is 16 cm.
 The radius of the container is 8 cm.
2𝜋𝑟2
= 2𝜋82
𝐴 = 384𝑐𝑚2
Calculate the area of the big container:
 The diameter of the container is 24 cm.
Koz 7
 The radius of the container is 12 cm.
2𝜋𝑟2
= 2𝜋(12)2
𝐴 = 864𝑐𝑚2
Table 1: Evaporation Rate of the Small Container
Calculation 2:
Take the average of the volume of water in 0th
second.
50.0 + 50.0 + 50.0 + 50.0 + 50.0
5
= 50.0
Take the average of the volume of water in 120th
seconds.
45.6 + 42.9 + 43.4 + 46.3 + 45.3
5
= 44.7
Time/s Volume of the Water/ mL
±1s Trial 1 Trial 2 Trial 3 Trial 4 Trial 5
0 50.0 50.0 50.0 50.0 50.0
120 45.6 42.9 43.4 46.3 45.3
240 38.5 37.3 39.0 39.2 38.7
360 35.7 34.3 36.4 35.0 33.8
480 26.3 29.9 31.2 27.6 29.2
600 22.4 25.7 26.7 24.9 25.3
Koz 8
Take the average of the volume of water in 240th
seconds.
38.5 + 37.3 + 39.0 + 39.2 + 38.7
5
= 38.5
Take the average of the volume of water in 360th
seconds.
35.7 + 34.3 + 36.4 + 35.0 + 33.8
5
= 35.0
Take the average of the volume of water in 480th
seconds.
26.3 + 29.9 + 31.2 + 27.6 + 29.2
5
= 28.8
Take the average of the volume of water in 600th
seconds.
22.4 + 25.7 + 26.7 + 24.9 + 25.3
5
= 25.0
Table 2: Evaporation Rate of the Middle Container
Time/s Volume of the Water/ mL
±1s Trial 1 Trial 2 Trial 3 Trial 4 Trial 5
0 50.0 50.0 50.0 50.0 50.0
120 40.5 43.0 41.5 39.9 41.6
240 36.0 33.6 37.0 35.3 35.8
Koz 9
360 30.7 29.4 31.1 29.8 32.4
480 25.5 24.9 26.6 27.2 25.9
600 16.5 12.7 17.8 15.0 16.3
Calculation 3: Repeat the Calculation 2 process for the Table 2.
Table 3: Evaporation Rate of the Big Container
Time/s Volume of the Water/ mL
±1s Trial 1 Trial 2 Trial 3 Trial 4 Trial 5
0 50.0 50.0 50.0 50.0 50.0
120 36.7 38.9 40.2 37.5 38.5
240 21.5 25.7 29.7 22.3 24.6
360 14.6 16.1 16.7 15.2 15.9
480 7.4 8.9 9.3 8.3 9.6
600 2.9 5.4 4.7 3.8 5.2
Calculation 3: Repeat the Calculation 2 process for the Table 3.
Rearranged the data as shown in the Table 4.
Table 4: Average Evaporation Rate of Containers
Time/s Area of Container/ cm2
±1s 150 384 662
Koz 10
0 50.0 50.0 50.0
120 44.7 41.3 38.4
240 38.5 35.5 24.8
360 35.0 30.7 15.7
480 28.8 26.2 8.7
600 25.0 15.7 4.4
Graph 1: Volume and Time Graph of Small, Middle and Big Container
Error bars in horizontal axis calculated by the uncertainty of the chronometer which is ±1s.
Error bars in vertical axis calculated by the uncertainty of the graduated cylinder which is
±0.5.
Qualitative Data:
1. There is no color change during the experiment.
0
10
20
30
40
50
60
-100 0 100 200 300 400 500 600 700
VolumeofWater/mL(±0.5)
Time/s (±1)
Small Container
Middle Container
Big Container
Koz 11
2. While the water was heated, the bubbles observed on the surface and bottom of the
container.
CONCLUSION & EVALUATION
This experiment investigates the relationship between surface area and evaporation rate. As
hypothesis refers to if the surface area of the solution increases, time taken for the evaporation
increases.
50 mL water measured and put in the containers and every 2 minutes, rest of the volume
measured by the help of graduated cylinder. Consequently, the data is as follows:
According to Table 1, Table 2, Table 3 and Table 4 the evaporation rate is affected by the
surface area of the container. For the surface area of the 150 cm2
in 120th
seconds, rest of the
volume was measured 45.6, 42.9, 43.4, 46.3 and 45.3. The rest of the volume was measured
38.5, 37.3, 39.0, 39.2 and 38.7 in 240th
seconds. The rest of the volume was measured 35.7,
34.3, 36.4, 35.0 and 33.8 in 360th
seconds. The rest of the volume was measured 26.3, 29.9,
31.2, 27.6 and 29.2 in 480th
seconds. The rest of the volume was measured 22.4, 25.7, 26.7,
24.9 and 25.3 in 600th
seconds.
For the surface area of the 384 cm2
in 120th
seconds, rest of the volume was measured 40.5,
43.0, 41.5, 39.9 and 41.6. The rest of the volume was measured 36.0, 33.6, 37.0, 35.3 and
35.8 in 240th
seconds. The rest of the volume was measured 30.7, 29.4, 31.1, 29.8 and 32.42
in 360th
seconds. The rest of the volume was measured 25.5, 24.9, 26.6, 27.2 and 25.9 in 480th
seconds. The rest of the volume was measured 16.5, 12.7, 17.8, 15.0 and 16.3 in 600th
seconds.
For the surface area of the 864 cm2
in 120th
seconds, rest of the volume was measured 36.7,
38.9, 40.2, 37.5 and 38.5. The rest of the volume was measured 21.5, 25.7, 29.7, 22.3 and
24.6 in 240th
seconds. The rest of the volume was measured 14.6, 16.1, 16.7, 15.2 and 15.9 in
360th
seconds. The rest of the volume was measured 7.4, 8.9, 9.3, 8.3 and 9.6 in 480th
seconds.
The rest of the volume was measured 2.9, 5.4, 4.7, 3.8 and 5.2 in 600th
seconds.
The average rate of the evaporation is shown by the Table 4. For the 150 cm2
container, the
average rest of the volume is 50.0, 44.7, 38.5, 35.0, 28.8 and 25.0 in the 0th
, 2nd
, 4th
, 6th
, 8th
and 10th
minutes respectively. For the 384 cm2
container, the average rest of the volume is
50.0, 41.3, 35.5, 30.7, 26.2 and 15.7 in the 0th
, 2nd
, 4th
, 6th
, 8th
and 10th
minutes respectively.
Koz 12
For the 864 cm2
container, the average rest of the volume is 50.0, 38.4, 24.8, 15.7, 8.7 and 4.4
in the 0th
, 2nd
, 4th
, 6th
, 8th
and 10th
minutes respectively.
According to the observations (qualitative data), Table 1, Table 2, Table 3, Table 4 and Graph
1 the rate of evaporation is faster in the large amount of surface area. Thus, results support the
hypothesis and the experiment results are reliable.
PREFERANCES
1. http://www.education.com/science-fair/article/effect-surface-area-evaporation-rate/
2. http://www.sccoos.org/docs/Evaporation%20Investigation.pdf

More Related Content

What's hot

friction loss along a pipe
friction loss along a pipefriction loss along a pipe
friction loss along a pipe
Saif al-din ali
 
Lab cstr in series
Lab cstr in seriesLab cstr in series
Lab cstr in series
Azlan Skool
 
AGITATION Final Report
AGITATION Final ReportAGITATION Final Report
AGITATION Final Report
Nicely Jane Eleccion
 
Sedimentation Ed Ryan M. Ruales
Sedimentation   Ed Ryan M. RualesSedimentation   Ed Ryan M. Ruales
Sedimentation Ed Ryan M. Ruales
Ed Ryan Ruales
 
2. fluids 2
2. fluids 22. fluids 2
2. fluids 2
secrurie2
 
Simple distillation
Simple distillation  Simple distillation
Simple distillation
Zanyar qaradaxe
 
Armfield Gas Absorption Column Experiment
Armfield Gas Absorption Column ExperimentArmfield Gas Absorption Column Experiment
Armfield Gas Absorption Column Experiment
Hadeer Khalid
 
Sulfuric acid Industries
Sulfuric acid IndustriesSulfuric acid Industries
Sulfuric acid Industries
SAFFI Ud Din Ahmad
 
exp.9 flow meter demonstration
exp.9 flow meter demonstrationexp.9 flow meter demonstration
exp.9 flow meter demonstration
Muhammed Fuad Al-Barznji
 
Calibration of Venturi and Orifice Meters
Calibration of Venturi and Orifice MetersCalibration of Venturi and Orifice Meters
Calibration of Venturi and Orifice Meters
Nicely Jane Eleccion
 
Marcet boiler
Marcet boiler Marcet boiler
Marcet boiler
sarkawtn
 
Applications of fluid mechanics
Applications of fluid mechanicsApplications of fluid mechanics
Applications of fluid mechanics
Vishu Sharma
 
Potentio lab report
Potentio lab reportPotentio lab report
Potentio lab report
Janine Samelo
 
exp 2 adsorbtion from solution
exp 2 adsorbtion from solutionexp 2 adsorbtion from solution
exp 2 adsorbtion from solutionRashid Alsuwaidi
 
Plate Heat Exchanger Lab Report Group B4
Plate Heat Exchanger Lab Report Group B4Plate Heat Exchanger Lab Report Group B4
Plate Heat Exchanger Lab Report Group B4Janet Mok
 
Independent Research Osmosis Lab
Independent Research Osmosis LabIndependent Research Osmosis Lab
Independent Research Osmosis LabHonori
 
Fluid Mechanic Lab - Venturi Meter
Fluid Mechanic Lab - Venturi MeterFluid Mechanic Lab - Venturi Meter
Fluid Mechanic Lab - Venturi Meter
MuhammadSRaniYah
 
gas absorption
gas absorptiongas absorption
gas absorption
Abhijit Panchmatiya
 

What's hot (20)

friction loss along a pipe
friction loss along a pipefriction loss along a pipe
friction loss along a pipe
 
Lab cstr in series
Lab cstr in seriesLab cstr in series
Lab cstr in series
 
Single effect evaporation
Single effect evaporationSingle effect evaporation
Single effect evaporation
 
AGITATION Final Report
AGITATION Final ReportAGITATION Final Report
AGITATION Final Report
 
Sedimentation Ed Ryan M. Ruales
Sedimentation   Ed Ryan M. RualesSedimentation   Ed Ryan M. Ruales
Sedimentation Ed Ryan M. Ruales
 
2. fluids 2
2. fluids 22. fluids 2
2. fluids 2
 
experiment Cstr 40l
experiment Cstr 40lexperiment Cstr 40l
experiment Cstr 40l
 
Simple distillation
Simple distillation  Simple distillation
Simple distillation
 
Armfield Gas Absorption Column Experiment
Armfield Gas Absorption Column ExperimentArmfield Gas Absorption Column Experiment
Armfield Gas Absorption Column Experiment
 
Sulfuric acid Industries
Sulfuric acid IndustriesSulfuric acid Industries
Sulfuric acid Industries
 
exp.9 flow meter demonstration
exp.9 flow meter demonstrationexp.9 flow meter demonstration
exp.9 flow meter demonstration
 
Calibration of Venturi and Orifice Meters
Calibration of Venturi and Orifice MetersCalibration of Venturi and Orifice Meters
Calibration of Venturi and Orifice Meters
 
Marcet boiler
Marcet boiler Marcet boiler
Marcet boiler
 
Applications of fluid mechanics
Applications of fluid mechanicsApplications of fluid mechanics
Applications of fluid mechanics
 
Potentio lab report
Potentio lab reportPotentio lab report
Potentio lab report
 
exp 2 adsorbtion from solution
exp 2 adsorbtion from solutionexp 2 adsorbtion from solution
exp 2 adsorbtion from solution
 
Plate Heat Exchanger Lab Report Group B4
Plate Heat Exchanger Lab Report Group B4Plate Heat Exchanger Lab Report Group B4
Plate Heat Exchanger Lab Report Group B4
 
Independent Research Osmosis Lab
Independent Research Osmosis LabIndependent Research Osmosis Lab
Independent Research Osmosis Lab
 
Fluid Mechanic Lab - Venturi Meter
Fluid Mechanic Lab - Venturi MeterFluid Mechanic Lab - Venturi Meter
Fluid Mechanic Lab - Venturi Meter
 
gas absorption
gas absorptiongas absorption
gas absorption
 

Similar to Chemistry Lab Report 3

© eScience Labs, 2013 Lab 5 – Weather and Climate Change.docx
© eScience Labs, 2013 Lab 5 – Weather and Climate Change.docx© eScience Labs, 2013 Lab 5 – Weather and Climate Change.docx
© eScience Labs, 2013 Lab 5 – Weather and Climate Change.docx
LynellBull52
 
Mto lab
Mto labMto lab
Mto lab
Omkar Desai
 
Solar still
Solar stillSolar still
Solar still
ishan kossambe
 
Lab 5 – Weather and Climate ChangeLab 5 - Demonstration 1 Mod.docx
Lab 5 – Weather and Climate ChangeLab 5 - Demonstration 1 Mod.docxLab 5 – Weather and Climate ChangeLab 5 - Demonstration 1 Mod.docx
Lab 5 – Weather and Climate ChangeLab 5 - Demonstration 1 Mod.docx
smile790243
 
Lab 5 – Weather and Climate ChangeLab 5 - Demonstration 1 M.docx
Lab 5 – Weather and Climate ChangeLab 5 - Demonstration 1 M.docxLab 5 – Weather and Climate ChangeLab 5 - Demonstration 1 M.docx
Lab 5 – Weather and Climate ChangeLab 5 - Demonstration 1 M.docx
DIPESH30
 
Biology Lab Report 2
Biology Lab Report 2Biology Lab Report 2
Biology Lab Report 2
Serra's Art Studio
 
Process_Heat_Transfer_Final_Project
Process_Heat_Transfer_Final_ProjectProcess_Heat_Transfer_Final_Project
Process_Heat_Transfer_Final_ProjectRyan Jones
 
Reaction
ReactionReaction
Reaction
ThihaThway1
 
Rate Of Reaction
Rate Of ReactionRate Of Reaction
Rate Of Reaction
Andromendas Rizal
 
LAB REPORT HYDRAULIC EXP 1 : PROPERTIES OF FLUID.
LAB REPORT HYDRAULIC EXP 1 : PROPERTIES OF FLUID.LAB REPORT HYDRAULIC EXP 1 : PROPERTIES OF FLUID.
LAB REPORT HYDRAULIC EXP 1 : PROPERTIES OF FLUID.
YASMINE HASLAN
 
The Effect of Surface Temperature and Salinity of Ocean Water on Carbon Dioxi...
The Effect of Surface Temperature and Salinity of Ocean Water on Carbon Dioxi...The Effect of Surface Temperature and Salinity of Ocean Water on Carbon Dioxi...
The Effect of Surface Temperature and Salinity of Ocean Water on Carbon Dioxi...
Vignesh Rajmohan
 
Co2 gas flotation of waste activated sludge using weak vacuum pressure with t...
Co2 gas flotation of waste activated sludge using weak vacuum pressure with t...Co2 gas flotation of waste activated sludge using weak vacuum pressure with t...
Co2 gas flotation of waste activated sludge using weak vacuum pressure with t...
Medhat Elzahar
 
CHEMISTRY PROJECT CLASS 12
CHEMISTRY PROJECT CLASS 12CHEMISTRY PROJECT CLASS 12
CHEMISTRY PROJECT CLASS 12
Akhilesh bhura
 
Fluid flow rate Experiment No. 5.pdf
Fluid flow rate Experiment No. 5.pdfFluid flow rate Experiment No. 5.pdf
Fluid flow rate Experiment No. 5.pdf
Kaiwan B. Hamasalih
 
Presentation on Evaporation, its process and factors affecting evaporation.pptx
Presentation  on Evaporation, its process and factors affecting evaporation.pptxPresentation  on Evaporation, its process and factors affecting evaporation.pptx
Presentation on Evaporation, its process and factors affecting evaporation.pptx
SohailAkhtar20pwciv5
 
Soil physics presentation.pptx
Soil physics presentation.pptxSoil physics presentation.pptx
Soil physics presentation.pptx
Usman Mastoi
 

Similar to Chemistry Lab Report 3 (18)

© eScience Labs, 2013 Lab 5 – Weather and Climate Change.docx
© eScience Labs, 2013 Lab 5 – Weather and Climate Change.docx© eScience Labs, 2013 Lab 5 – Weather and Climate Change.docx
© eScience Labs, 2013 Lab 5 – Weather and Climate Change.docx
 
Mto lab
Mto labMto lab
Mto lab
 
Solar still
Solar stillSolar still
Solar still
 
Lab 5 – Weather and Climate ChangeLab 5 - Demonstration 1 Mod.docx
Lab 5 – Weather and Climate ChangeLab 5 - Demonstration 1 Mod.docxLab 5 – Weather and Climate ChangeLab 5 - Demonstration 1 Mod.docx
Lab 5 – Weather and Climate ChangeLab 5 - Demonstration 1 Mod.docx
 
Lab 5 – Weather and Climate ChangeLab 5 - Demonstration 1 M.docx
Lab 5 – Weather and Climate ChangeLab 5 - Demonstration 1 M.docxLab 5 – Weather and Climate ChangeLab 5 - Demonstration 1 M.docx
Lab 5 – Weather and Climate ChangeLab 5 - Demonstration 1 M.docx
 
Biology Lab Report 2
Biology Lab Report 2Biology Lab Report 2
Biology Lab Report 2
 
Process_Heat_Transfer_Final_Project
Process_Heat_Transfer_Final_ProjectProcess_Heat_Transfer_Final_Project
Process_Heat_Transfer_Final_Project
 
water-volumes-fractals
water-volumes-fractalswater-volumes-fractals
water-volumes-fractals
 
Reaction
ReactionReaction
Reaction
 
Rate Of Reaction
Rate Of ReactionRate Of Reaction
Rate Of Reaction
 
LAB REPORT HYDRAULIC EXP 1 : PROPERTIES OF FLUID.
LAB REPORT HYDRAULIC EXP 1 : PROPERTIES OF FLUID.LAB REPORT HYDRAULIC EXP 1 : PROPERTIES OF FLUID.
LAB REPORT HYDRAULIC EXP 1 : PROPERTIES OF FLUID.
 
The Effect of Surface Temperature and Salinity of Ocean Water on Carbon Dioxi...
The Effect of Surface Temperature and Salinity of Ocean Water on Carbon Dioxi...The Effect of Surface Temperature and Salinity of Ocean Water on Carbon Dioxi...
The Effect of Surface Temperature and Salinity of Ocean Water on Carbon Dioxi...
 
Co2 gas flotation of waste activated sludge using weak vacuum pressure with t...
Co2 gas flotation of waste activated sludge using weak vacuum pressure with t...Co2 gas flotation of waste activated sludge using weak vacuum pressure with t...
Co2 gas flotation of waste activated sludge using weak vacuum pressure with t...
 
CHEMISTRY PROJECT CLASS 12
CHEMISTRY PROJECT CLASS 12CHEMISTRY PROJECT CLASS 12
CHEMISTRY PROJECT CLASS 12
 
Fluid flow rate Experiment No. 5.pdf
Fluid flow rate Experiment No. 5.pdfFluid flow rate Experiment No. 5.pdf
Fluid flow rate Experiment No. 5.pdf
 
Presentation on Evaporation, its process and factors affecting evaporation.pptx
Presentation  on Evaporation, its process and factors affecting evaporation.pptxPresentation  on Evaporation, its process and factors affecting evaporation.pptx
Presentation on Evaporation, its process and factors affecting evaporation.pptx
 
K cl o3decomp05
K cl o3decomp05K cl o3decomp05
K cl o3decomp05
 
Soil physics presentation.pptx
Soil physics presentation.pptxSoil physics presentation.pptx
Soil physics presentation.pptx
 

More from Serra's Art Studio

Hist200
Hist200Hist200
A1 turkce-makale
A1 turkce-makaleA1 turkce-makale
A1 turkce-makale
Serra's Art Studio
 
A1 turkce-ozdegerlendirme
A1 turkce-ozdegerlendirmeA1 turkce-ozdegerlendirme
A1 turkce-ozdegerlendirme
Serra's Art Studio
 
Chema Madoz Sergi Yorumu
Chema Madoz Sergi YorumuChema Madoz Sergi Yorumu
Chema Madoz Sergi Yorumu
Serra's Art Studio
 
IAED 342-Research Homework
IAED 342-Research HomeworkIAED 342-Research Homework
IAED 342-Research Homework
Serra's Art Studio
 
IAED 342-Research Presentation
IAED 342-Research PresentationIAED 342-Research Presentation
IAED 342-Research Presentation
Serra's Art Studio
 
IAED 381-Field Trip Report
IAED 381-Field Trip ReportIAED 381-Field Trip Report
IAED 381-Field Trip Report
Serra's Art Studio
 
IAED 221 Case Study
IAED 221 Case StudyIAED 221 Case Study
IAED 221 Case Study
Serra's Art Studio
 
IAED 463 Presentation
IAED 463 PresentationIAED 463 Presentation
IAED 463 Presentation
Serra's Art Studio
 
IAED 463-Report
IAED 463-ReportIAED 463-Report
IAED 463-Report
Serra's Art Studio
 
IAED 322 Term Project-Part 1
IAED 322 Term Project-Part 1IAED 322 Term Project-Part 1
IAED 322 Term Project-Part 1
Serra's Art Studio
 
IAED 301 Research Presentation
IAED 301 Research PresentationIAED 301 Research Presentation
IAED 301 Research Presentation
Serra's Art Studio
 
COMD 210 Location Description
COMD 210 Location DescriptionCOMD 210 Location Description
COMD 210 Location Description
Serra's Art Studio
 
COMD 210 Chocolate Aisle
COMD 210 Chocolate AisleCOMD 210 Chocolate Aisle
COMD 210 Chocolate Aisle
Serra's Art Studio
 
ADA 264-Assignment 5
ADA 264-Assignment 5ADA 264-Assignment 5
ADA 264-Assignment 5
Serra's Art Studio
 
Mathematical Exploration
Mathematical ExplorationMathematical Exploration
Mathematical Exploration
Serra's Art Studio
 
Physics Lab Report 2
Physics Lab Report 2Physics Lab Report 2
Physics Lab Report 2
Serra's Art Studio
 
Physics Lab Report 1
Physics Lab Report 1Physics Lab Report 1
Physics Lab Report 1
Serra's Art Studio
 
Chemistry Lab Report 2
Chemistry Lab Report 2Chemistry Lab Report 2
Chemistry Lab Report 2
Serra's Art Studio
 
Biology Lab Report 3
Biology Lab Report 3Biology Lab Report 3
Biology Lab Report 3
Serra's Art Studio
 

More from Serra's Art Studio (20)

Hist200
Hist200Hist200
Hist200
 
A1 turkce-makale
A1 turkce-makaleA1 turkce-makale
A1 turkce-makale
 
A1 turkce-ozdegerlendirme
A1 turkce-ozdegerlendirmeA1 turkce-ozdegerlendirme
A1 turkce-ozdegerlendirme
 
Chema Madoz Sergi Yorumu
Chema Madoz Sergi YorumuChema Madoz Sergi Yorumu
Chema Madoz Sergi Yorumu
 
IAED 342-Research Homework
IAED 342-Research HomeworkIAED 342-Research Homework
IAED 342-Research Homework
 
IAED 342-Research Presentation
IAED 342-Research PresentationIAED 342-Research Presentation
IAED 342-Research Presentation
 
IAED 381-Field Trip Report
IAED 381-Field Trip ReportIAED 381-Field Trip Report
IAED 381-Field Trip Report
 
IAED 221 Case Study
IAED 221 Case StudyIAED 221 Case Study
IAED 221 Case Study
 
IAED 463 Presentation
IAED 463 PresentationIAED 463 Presentation
IAED 463 Presentation
 
IAED 463-Report
IAED 463-ReportIAED 463-Report
IAED 463-Report
 
IAED 322 Term Project-Part 1
IAED 322 Term Project-Part 1IAED 322 Term Project-Part 1
IAED 322 Term Project-Part 1
 
IAED 301 Research Presentation
IAED 301 Research PresentationIAED 301 Research Presentation
IAED 301 Research Presentation
 
COMD 210 Location Description
COMD 210 Location DescriptionCOMD 210 Location Description
COMD 210 Location Description
 
COMD 210 Chocolate Aisle
COMD 210 Chocolate AisleCOMD 210 Chocolate Aisle
COMD 210 Chocolate Aisle
 
ADA 264-Assignment 5
ADA 264-Assignment 5ADA 264-Assignment 5
ADA 264-Assignment 5
 
Mathematical Exploration
Mathematical ExplorationMathematical Exploration
Mathematical Exploration
 
Physics Lab Report 2
Physics Lab Report 2Physics Lab Report 2
Physics Lab Report 2
 
Physics Lab Report 1
Physics Lab Report 1Physics Lab Report 1
Physics Lab Report 1
 
Chemistry Lab Report 2
Chemistry Lab Report 2Chemistry Lab Report 2
Chemistry Lab Report 2
 
Biology Lab Report 3
Biology Lab Report 3Biology Lab Report 3
Biology Lab Report 3
 

Recently uploaded

Model Attribute Check Company Auto Property
Model Attribute  Check Company Auto PropertyModel Attribute  Check Company Auto Property
Model Attribute Check Company Auto Property
Celine George
 
Additional Benefits for Employee Website.pdf
Additional Benefits for Employee Website.pdfAdditional Benefits for Employee Website.pdf
Additional Benefits for Employee Website.pdf
joachimlavalley1
 
Mule 4.6 & Java 17 Upgrade | MuleSoft Mysore Meetup #46
Mule 4.6 & Java 17 Upgrade | MuleSoft Mysore Meetup #46Mule 4.6 & Java 17 Upgrade | MuleSoft Mysore Meetup #46
Mule 4.6 & Java 17 Upgrade | MuleSoft Mysore Meetup #46
MysoreMuleSoftMeetup
 
The approach at University of Liverpool.pptx
The approach at University of Liverpool.pptxThe approach at University of Liverpool.pptx
The approach at University of Liverpool.pptx
Jisc
 
Unit 2- Research Aptitude (UGC NET Paper I).pdf
Unit 2- Research Aptitude (UGC NET Paper I).pdfUnit 2- Research Aptitude (UGC NET Paper I).pdf
Unit 2- Research Aptitude (UGC NET Paper I).pdf
Thiyagu K
 
The Accursed House by Émile Gaboriau.pptx
The Accursed House by Émile Gaboriau.pptxThe Accursed House by Émile Gaboriau.pptx
The Accursed House by Émile Gaboriau.pptx
DhatriParmar
 
Thesis Statement for students diagnonsed withADHD.ppt
Thesis Statement for students diagnonsed withADHD.pptThesis Statement for students diagnonsed withADHD.ppt
Thesis Statement for students diagnonsed withADHD.ppt
EverAndrsGuerraGuerr
 
June 3, 2024 Anti-Semitism Letter Sent to MIT President Kornbluth and MIT Cor...
June 3, 2024 Anti-Semitism Letter Sent to MIT President Kornbluth and MIT Cor...June 3, 2024 Anti-Semitism Letter Sent to MIT President Kornbluth and MIT Cor...
June 3, 2024 Anti-Semitism Letter Sent to MIT President Kornbluth and MIT Cor...
Levi Shapiro
 
1.4 modern child centered education - mahatma gandhi-2.pptx
1.4 modern child centered education - mahatma gandhi-2.pptx1.4 modern child centered education - mahatma gandhi-2.pptx
1.4 modern child centered education - mahatma gandhi-2.pptx
JosvitaDsouza2
 
Adversarial Attention Modeling for Multi-dimensional Emotion Regression.pdf
Adversarial Attention Modeling for Multi-dimensional Emotion Regression.pdfAdversarial Attention Modeling for Multi-dimensional Emotion Regression.pdf
Adversarial Attention Modeling for Multi-dimensional Emotion Regression.pdf
Po-Chuan Chen
 
Polish students' mobility in the Czech Republic
Polish students' mobility in the Czech RepublicPolish students' mobility in the Czech Republic
Polish students' mobility in the Czech Republic
Anna Sz.
 
special B.ed 2nd year old paper_20240531.pdf
special B.ed 2nd year old paper_20240531.pdfspecial B.ed 2nd year old paper_20240531.pdf
special B.ed 2nd year old paper_20240531.pdf
Special education needs
 
Unit 8 - Information and Communication Technology (Paper I).pdf
Unit 8 - Information and Communication Technology (Paper I).pdfUnit 8 - Information and Communication Technology (Paper I).pdf
Unit 8 - Information and Communication Technology (Paper I).pdf
Thiyagu K
 
aaaaaaaaaaaaaaaaaaaaaaaaaaaaaaaaaaaaaaaaa
aaaaaaaaaaaaaaaaaaaaaaaaaaaaaaaaaaaaaaaaaaaaaaaaaaaaaaaaaaaaaaaaaaaaaaaaaaaaaaaaaa
aaaaaaaaaaaaaaaaaaaaaaaaaaaaaaaaaaaaaaaaa
siemaillard
 
The Challenger.pdf DNHS Official Publication
The Challenger.pdf DNHS Official PublicationThe Challenger.pdf DNHS Official Publication
The Challenger.pdf DNHS Official Publication
Delapenabediema
 
"Protectable subject matters, Protection in biotechnology, Protection of othe...
"Protectable subject matters, Protection in biotechnology, Protection of othe..."Protectable subject matters, Protection in biotechnology, Protection of othe...
"Protectable subject matters, Protection in biotechnology, Protection of othe...
SACHIN R KONDAGURI
 
Synthetic Fiber Construction in lab .pptx
Synthetic Fiber Construction in lab .pptxSynthetic Fiber Construction in lab .pptx
Synthetic Fiber Construction in lab .pptx
Pavel ( NSTU)
 
The geography of Taylor Swift - some ideas
The geography of Taylor Swift - some ideasThe geography of Taylor Swift - some ideas
The geography of Taylor Swift - some ideas
GeoBlogs
 
Biological Screening of Herbal Drugs in detailed.
Biological Screening of Herbal Drugs in detailed.Biological Screening of Herbal Drugs in detailed.
Biological Screening of Herbal Drugs in detailed.
Ashokrao Mane college of Pharmacy Peth-Vadgaon
 
678020731-Sumas-y-Restas-Para-Colorear.pdf
678020731-Sumas-y-Restas-Para-Colorear.pdf678020731-Sumas-y-Restas-Para-Colorear.pdf
678020731-Sumas-y-Restas-Para-Colorear.pdf
CarlosHernanMontoyab2
 

Recently uploaded (20)

Model Attribute Check Company Auto Property
Model Attribute  Check Company Auto PropertyModel Attribute  Check Company Auto Property
Model Attribute Check Company Auto Property
 
Additional Benefits for Employee Website.pdf
Additional Benefits for Employee Website.pdfAdditional Benefits for Employee Website.pdf
Additional Benefits for Employee Website.pdf
 
Mule 4.6 & Java 17 Upgrade | MuleSoft Mysore Meetup #46
Mule 4.6 & Java 17 Upgrade | MuleSoft Mysore Meetup #46Mule 4.6 & Java 17 Upgrade | MuleSoft Mysore Meetup #46
Mule 4.6 & Java 17 Upgrade | MuleSoft Mysore Meetup #46
 
The approach at University of Liverpool.pptx
The approach at University of Liverpool.pptxThe approach at University of Liverpool.pptx
The approach at University of Liverpool.pptx
 
Unit 2- Research Aptitude (UGC NET Paper I).pdf
Unit 2- Research Aptitude (UGC NET Paper I).pdfUnit 2- Research Aptitude (UGC NET Paper I).pdf
Unit 2- Research Aptitude (UGC NET Paper I).pdf
 
The Accursed House by Émile Gaboriau.pptx
The Accursed House by Émile Gaboriau.pptxThe Accursed House by Émile Gaboriau.pptx
The Accursed House by Émile Gaboriau.pptx
 
Thesis Statement for students diagnonsed withADHD.ppt
Thesis Statement for students diagnonsed withADHD.pptThesis Statement for students diagnonsed withADHD.ppt
Thesis Statement for students diagnonsed withADHD.ppt
 
June 3, 2024 Anti-Semitism Letter Sent to MIT President Kornbluth and MIT Cor...
June 3, 2024 Anti-Semitism Letter Sent to MIT President Kornbluth and MIT Cor...June 3, 2024 Anti-Semitism Letter Sent to MIT President Kornbluth and MIT Cor...
June 3, 2024 Anti-Semitism Letter Sent to MIT President Kornbluth and MIT Cor...
 
1.4 modern child centered education - mahatma gandhi-2.pptx
1.4 modern child centered education - mahatma gandhi-2.pptx1.4 modern child centered education - mahatma gandhi-2.pptx
1.4 modern child centered education - mahatma gandhi-2.pptx
 
Adversarial Attention Modeling for Multi-dimensional Emotion Regression.pdf
Adversarial Attention Modeling for Multi-dimensional Emotion Regression.pdfAdversarial Attention Modeling for Multi-dimensional Emotion Regression.pdf
Adversarial Attention Modeling for Multi-dimensional Emotion Regression.pdf
 
Polish students' mobility in the Czech Republic
Polish students' mobility in the Czech RepublicPolish students' mobility in the Czech Republic
Polish students' mobility in the Czech Republic
 
special B.ed 2nd year old paper_20240531.pdf
special B.ed 2nd year old paper_20240531.pdfspecial B.ed 2nd year old paper_20240531.pdf
special B.ed 2nd year old paper_20240531.pdf
 
Unit 8 - Information and Communication Technology (Paper I).pdf
Unit 8 - Information and Communication Technology (Paper I).pdfUnit 8 - Information and Communication Technology (Paper I).pdf
Unit 8 - Information and Communication Technology (Paper I).pdf
 
aaaaaaaaaaaaaaaaaaaaaaaaaaaaaaaaaaaaaaaaa
aaaaaaaaaaaaaaaaaaaaaaaaaaaaaaaaaaaaaaaaaaaaaaaaaaaaaaaaaaaaaaaaaaaaaaaaaaaaaaaaaa
aaaaaaaaaaaaaaaaaaaaaaaaaaaaaaaaaaaaaaaaa
 
The Challenger.pdf DNHS Official Publication
The Challenger.pdf DNHS Official PublicationThe Challenger.pdf DNHS Official Publication
The Challenger.pdf DNHS Official Publication
 
"Protectable subject matters, Protection in biotechnology, Protection of othe...
"Protectable subject matters, Protection in biotechnology, Protection of othe..."Protectable subject matters, Protection in biotechnology, Protection of othe...
"Protectable subject matters, Protection in biotechnology, Protection of othe...
 
Synthetic Fiber Construction in lab .pptx
Synthetic Fiber Construction in lab .pptxSynthetic Fiber Construction in lab .pptx
Synthetic Fiber Construction in lab .pptx
 
The geography of Taylor Swift - some ideas
The geography of Taylor Swift - some ideasThe geography of Taylor Swift - some ideas
The geography of Taylor Swift - some ideas
 
Biological Screening of Herbal Drugs in detailed.
Biological Screening of Herbal Drugs in detailed.Biological Screening of Herbal Drugs in detailed.
Biological Screening of Herbal Drugs in detailed.
 
678020731-Sumas-y-Restas-Para-Colorear.pdf
678020731-Sumas-y-Restas-Para-Colorear.pdf678020731-Sumas-y-Restas-Para-Colorear.pdf
678020731-Sumas-y-Restas-Para-Colorear.pdf
 

Chemistry Lab Report 3

  • 1. Koz 1 INTERNATIONAL BACCALAUREATE CHEMISTRY LAB REPORT EFFECTS OF THE SURFACE AREA ON THE EVAPORATION RATE Candidate: Serra Koz Supervisor: --- May 2014
  • 2. Koz 2 BACKGROUND INFORMATION Matter is anything that has mass and volume. The three common forms of matter on Earth, called the states of matter, are solid, liquid, and gas. A solid has a definite shape and volume; a liquid has a definite volume but no definite shape; a gas has no definite volume or shape. Substances commonly exist in one of the three states, but they can be in any one of the three states depending on temperature. For example, water is commonly a liquid, but when cooled it forms a solid called ice. When liquid water is heated, it forms a gas. The state of matter doesn't change the kind of particles of which a substance is made. Instead, the states of matter differ in how close their particles are as well as how tightly bonded the particles are. For example, each particle of liquid, gas, or solid water is made of one atom of oxygen combined with two atoms of hydrogen. Water particles in the gas state are far apart. Liquid water particles are closer together, and some are bonded to one another. Solid water particles, called ice, are close together and are the most tightly bonded. When water changes from one state to another, there is a gain or loss of energy. States of matter in order from least to most energy are solid, liquid, gas. To change to a higher energy state, such as when water changes from ice (solid) to liquid or from a liquid to a gas, heat must be added. The process of changing from a solid to a liquid is called melting. The process of changing from a liquid to a gas is called vaporizing. If vaporization happens at the surface of a liquid, the process is called evaporation. The gaseous state of a substance at a temperature at which that substance is usually in a solid or liquid state is called a vapor. When water evaporates, vapor is formed. Evaporation rate is the amount of liquid that evaporates in a certain amount of time.1 When it evaporates, the liquid water in a lake, a stream, or the ocean changes to water vapor and rises into the air. Depending on temperature and other weather conditions, the water vapor will eventually condense into clouds and fall again to Earth as a liquid (rain), a solid
  • 3. Koz 3 (snow, sleet, or hail), or it may condense on surfaces as dew. Several different factors can affect the rate of evaporation, including heat, wind, relative humidity, and surface area. The rate of evaporation increases as the heat from the Sun increases, the wind strengthens, the relative humidity decreases, and the surface area expands.2 AIM: The intent of this investigation is to observe the effects on the surface area in the evaporation rate. RESEARCH QUESTION: How does surface area effects the evaporation rate? HYPOTHESIS: If the surface area increases, then the rate of evaporation increases.
  • 4. Koz 4 VARIABLES Independent Variables: Surface Area of Liquid/cm2 The surface area of the liquid did not change during the experiment and the radius of the container measured by the ruler and calculated the formul of the πr2 . Dependent Variables: Period of the Time /s (0, 2, 4, 6, 8, 10) The period of the time was constant during the experiment. The period of the time can be changed the evaporation rate. Room Temperature/°C (25°C) The initial volume of the water was constant during the experiment and measured by the thermometer. It caused of the difference between the evaporation rate. Controlled Variables: Length between the Container and Heater/ cm (3 cm) The length between the container and heater measured by the ruler. If it was changed, the the reaction time changed. Initial Volume of the Water/mL (50 mL) The initial volume of the water was same during the experiment and measured by the graduated cylinder. If the volume of the graduated cylinder changed, evaporation rate can be changed as well.
  • 5. Koz 5 MATERIALS  Different Radius of Container (x3)  150 mL water  50 mL Graduated Cylinder (±0.5)  30 cm Ruler (±1)  Temperature  Small Funnel  Dropper  Heater PROCEDURE i. Draw the surface of the small containers on paper. ii. Measure the radius of the small container and calculate the surface area of the containers. iii. Put 50 mL water into the small container as shown in the Figure 1. iv. Ignite the wick and take the records of the rest volume of water by the aid of graduated cylinder and small funnel in 2nd , 4th , 6th , 8th and 10th minutes. v. Repeat the process i, ii, iii and iv for the other containers. vi. Repeat the experiment again for 5 times.
  • 6. Koz 6 Figure 1 DATA COLLECTION & PROCESSING Calculation 1: Take the π=3. Calculate the area of the small container:  The diameter of the container is 10 cm.  The radius of the container is 5 cm. 2𝜋𝑟2 = 2𝜋52 𝐴 = 150 𝑐𝑚2 Calculate the area of the middle container:  The diameter of the container is 16 cm.  The radius of the container is 8 cm. 2𝜋𝑟2 = 2𝜋82 𝐴 = 384𝑐𝑚2 Calculate the area of the big container:  The diameter of the container is 24 cm.
  • 7. Koz 7  The radius of the container is 12 cm. 2𝜋𝑟2 = 2𝜋(12)2 𝐴 = 864𝑐𝑚2 Table 1: Evaporation Rate of the Small Container Calculation 2: Take the average of the volume of water in 0th second. 50.0 + 50.0 + 50.0 + 50.0 + 50.0 5 = 50.0 Take the average of the volume of water in 120th seconds. 45.6 + 42.9 + 43.4 + 46.3 + 45.3 5 = 44.7 Time/s Volume of the Water/ mL ±1s Trial 1 Trial 2 Trial 3 Trial 4 Trial 5 0 50.0 50.0 50.0 50.0 50.0 120 45.6 42.9 43.4 46.3 45.3 240 38.5 37.3 39.0 39.2 38.7 360 35.7 34.3 36.4 35.0 33.8 480 26.3 29.9 31.2 27.6 29.2 600 22.4 25.7 26.7 24.9 25.3
  • 8. Koz 8 Take the average of the volume of water in 240th seconds. 38.5 + 37.3 + 39.0 + 39.2 + 38.7 5 = 38.5 Take the average of the volume of water in 360th seconds. 35.7 + 34.3 + 36.4 + 35.0 + 33.8 5 = 35.0 Take the average of the volume of water in 480th seconds. 26.3 + 29.9 + 31.2 + 27.6 + 29.2 5 = 28.8 Take the average of the volume of water in 600th seconds. 22.4 + 25.7 + 26.7 + 24.9 + 25.3 5 = 25.0 Table 2: Evaporation Rate of the Middle Container Time/s Volume of the Water/ mL ±1s Trial 1 Trial 2 Trial 3 Trial 4 Trial 5 0 50.0 50.0 50.0 50.0 50.0 120 40.5 43.0 41.5 39.9 41.6 240 36.0 33.6 37.0 35.3 35.8
  • 9. Koz 9 360 30.7 29.4 31.1 29.8 32.4 480 25.5 24.9 26.6 27.2 25.9 600 16.5 12.7 17.8 15.0 16.3 Calculation 3: Repeat the Calculation 2 process for the Table 2. Table 3: Evaporation Rate of the Big Container Time/s Volume of the Water/ mL ±1s Trial 1 Trial 2 Trial 3 Trial 4 Trial 5 0 50.0 50.0 50.0 50.0 50.0 120 36.7 38.9 40.2 37.5 38.5 240 21.5 25.7 29.7 22.3 24.6 360 14.6 16.1 16.7 15.2 15.9 480 7.4 8.9 9.3 8.3 9.6 600 2.9 5.4 4.7 3.8 5.2 Calculation 3: Repeat the Calculation 2 process for the Table 3. Rearranged the data as shown in the Table 4. Table 4: Average Evaporation Rate of Containers Time/s Area of Container/ cm2 ±1s 150 384 662
  • 10. Koz 10 0 50.0 50.0 50.0 120 44.7 41.3 38.4 240 38.5 35.5 24.8 360 35.0 30.7 15.7 480 28.8 26.2 8.7 600 25.0 15.7 4.4 Graph 1: Volume and Time Graph of Small, Middle and Big Container Error bars in horizontal axis calculated by the uncertainty of the chronometer which is ±1s. Error bars in vertical axis calculated by the uncertainty of the graduated cylinder which is ±0.5. Qualitative Data: 1. There is no color change during the experiment. 0 10 20 30 40 50 60 -100 0 100 200 300 400 500 600 700 VolumeofWater/mL(±0.5) Time/s (±1) Small Container Middle Container Big Container
  • 11. Koz 11 2. While the water was heated, the bubbles observed on the surface and bottom of the container. CONCLUSION & EVALUATION This experiment investigates the relationship between surface area and evaporation rate. As hypothesis refers to if the surface area of the solution increases, time taken for the evaporation increases. 50 mL water measured and put in the containers and every 2 minutes, rest of the volume measured by the help of graduated cylinder. Consequently, the data is as follows: According to Table 1, Table 2, Table 3 and Table 4 the evaporation rate is affected by the surface area of the container. For the surface area of the 150 cm2 in 120th seconds, rest of the volume was measured 45.6, 42.9, 43.4, 46.3 and 45.3. The rest of the volume was measured 38.5, 37.3, 39.0, 39.2 and 38.7 in 240th seconds. The rest of the volume was measured 35.7, 34.3, 36.4, 35.0 and 33.8 in 360th seconds. The rest of the volume was measured 26.3, 29.9, 31.2, 27.6 and 29.2 in 480th seconds. The rest of the volume was measured 22.4, 25.7, 26.7, 24.9 and 25.3 in 600th seconds. For the surface area of the 384 cm2 in 120th seconds, rest of the volume was measured 40.5, 43.0, 41.5, 39.9 and 41.6. The rest of the volume was measured 36.0, 33.6, 37.0, 35.3 and 35.8 in 240th seconds. The rest of the volume was measured 30.7, 29.4, 31.1, 29.8 and 32.42 in 360th seconds. The rest of the volume was measured 25.5, 24.9, 26.6, 27.2 and 25.9 in 480th seconds. The rest of the volume was measured 16.5, 12.7, 17.8, 15.0 and 16.3 in 600th seconds. For the surface area of the 864 cm2 in 120th seconds, rest of the volume was measured 36.7, 38.9, 40.2, 37.5 and 38.5. The rest of the volume was measured 21.5, 25.7, 29.7, 22.3 and 24.6 in 240th seconds. The rest of the volume was measured 14.6, 16.1, 16.7, 15.2 and 15.9 in 360th seconds. The rest of the volume was measured 7.4, 8.9, 9.3, 8.3 and 9.6 in 480th seconds. The rest of the volume was measured 2.9, 5.4, 4.7, 3.8 and 5.2 in 600th seconds. The average rate of the evaporation is shown by the Table 4. For the 150 cm2 container, the average rest of the volume is 50.0, 44.7, 38.5, 35.0, 28.8 and 25.0 in the 0th , 2nd , 4th , 6th , 8th and 10th minutes respectively. For the 384 cm2 container, the average rest of the volume is 50.0, 41.3, 35.5, 30.7, 26.2 and 15.7 in the 0th , 2nd , 4th , 6th , 8th and 10th minutes respectively.
  • 12. Koz 12 For the 864 cm2 container, the average rest of the volume is 50.0, 38.4, 24.8, 15.7, 8.7 and 4.4 in the 0th , 2nd , 4th , 6th , 8th and 10th minutes respectively. According to the observations (qualitative data), Table 1, Table 2, Table 3, Table 4 and Graph 1 the rate of evaporation is faster in the large amount of surface area. Thus, results support the hypothesis and the experiment results are reliable. PREFERANCES 1. http://www.education.com/science-fair/article/effect-surface-area-evaporation-rate/ 2. http://www.sccoos.org/docs/Evaporation%20Investigation.pdf