Download to read offline

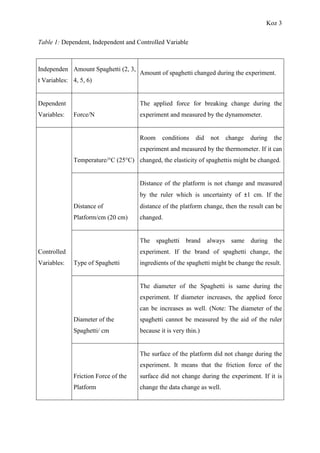

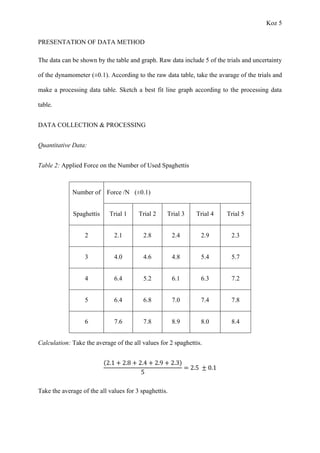


This lab report investigates the relationship between the number of spaghetti strands and the applied force needed to break them. The experiment involved placing different numbers of spaghetti strands (2, 3, 4, 5, 6) on a platform and measuring the force required to break them using a dynamometer. The results showed that as the number of spaghetti strands increased, the average applied breaking force also increased. A direct proportional relationship between the number of spaghetti strands and applied force was determined. The hypothesis that increasing the number of spaghetti strands would increase the breaking force was supported.


