1. The document summarizes three laboratory experiments conducted by students to observe water molecules in different temperatures, altering air pressure by changing temperature, and observing the phase change of water by heat.
2. The experiments used food coloring, candles, and an ice-water solution with a thermometer to collect data on how temperature affects states of matter and molecular movement.
3. The results showed that food coloring diffused differently in hot and cold water, water level rose when heated in a closed container as heat displaced air, and ice melted at consistent temperatures before water boiled at 100 degrees Celsius.
This series is made up seven lessons and was prepared for group of mixed ability science students. Please forward comments and suggestions to whysciencetutors@yahoo.com or visit www.whysciencetutors.com
This series is made up seven lessons and was prepared for group of mixed ability science students. Please forward comments and suggestions to whysciencetutors@yahoo.com or visit www.whysciencetutors.com
What is HEAT?
Form of energy and measured in JOULES
Particles move about more and take up more room if heated – this is why things expand if heated
It is also why substances change from: solids liquids gases when heated
What is HEAT?
Form of energy and measured in JOULES
Particles move about more and take up more room if heated – this is why things expand if heated
It is also why substances change from: solids liquids gases when heated
A brief information about the SCOP protein database used in bioinformatics.
The Structural Classification of Proteins (SCOP) database is a comprehensive and authoritative resource for the structural and evolutionary relationships of proteins. It provides a detailed and curated classification of protein structures, grouping them into families, superfamilies, and folds based on their structural and sequence similarities.
Seminar of U.V. Spectroscopy by SAMIR PANDASAMIR PANDA
Spectroscopy is a branch of science dealing the study of interaction of electromagnetic radiation with matter.
Ultraviolet-visible spectroscopy refers to absorption spectroscopy or reflect spectroscopy in the UV-VIS spectral region.
Ultraviolet-visible spectroscopy is an analytical method that can measure the amount of light received by the analyte.
Earliest Galaxies in the JADES Origins Field: Luminosity Function and Cosmic ...Sérgio Sacani
We characterize the earliest galaxy population in the JADES Origins Field (JOF), the deepest
imaging field observed with JWST. We make use of the ancillary Hubble optical images (5 filters
spanning 0.4−0.9µm) and novel JWST images with 14 filters spanning 0.8−5µm, including 7 mediumband filters, and reaching total exposure times of up to 46 hours per filter. We combine all our data
at > 2.3µm to construct an ultradeep image, reaching as deep as ≈ 31.4 AB mag in the stack and
30.3-31.0 AB mag (5σ, r = 0.1” circular aperture) in individual filters. We measure photometric
redshifts and use robust selection criteria to identify a sample of eight galaxy candidates at redshifts
z = 11.5 − 15. These objects show compact half-light radii of R1/2 ∼ 50 − 200pc, stellar masses of
M⋆ ∼ 107−108M⊙, and star-formation rates of SFR ∼ 0.1−1 M⊙ yr−1
. Our search finds no candidates
at 15 < z < 20, placing upper limits at these redshifts. We develop a forward modeling approach to
infer the properties of the evolving luminosity function without binning in redshift or luminosity that
marginalizes over the photometric redshift uncertainty of our candidate galaxies and incorporates the
impact of non-detections. We find a z = 12 luminosity function in good agreement with prior results,
and that the luminosity function normalization and UV luminosity density decline by a factor of ∼ 2.5
from z = 12 to z = 14. We discuss the possible implications of our results in the context of theoretical
models for evolution of the dark matter halo mass function.
Cancer cell metabolism: special Reference to Lactate PathwayAADYARAJPANDEY1
Normal Cell Metabolism:
Cellular respiration describes the series of steps that cells use to break down sugar and other chemicals to get the energy we need to function.
Energy is stored in the bonds of glucose and when glucose is broken down, much of that energy is released.
Cell utilize energy in the form of ATP.
The first step of respiration is called glycolysis. In a series of steps, glycolysis breaks glucose into two smaller molecules - a chemical called pyruvate. A small amount of ATP is formed during this process.
Most healthy cells continue the breakdown in a second process, called the Kreb's cycle. The Kreb's cycle allows cells to “burn” the pyruvates made in glycolysis to get more ATP.
The last step in the breakdown of glucose is called oxidative phosphorylation (Ox-Phos).
It takes place in specialized cell structures called mitochondria. This process produces a large amount of ATP. Importantly, cells need oxygen to complete oxidative phosphorylation.
If a cell completes only glycolysis, only 2 molecules of ATP are made per glucose. However, if the cell completes the entire respiration process (glycolysis - Kreb's - oxidative phosphorylation), about 36 molecules of ATP are created, giving it much more energy to use.
IN CANCER CELL:
Unlike healthy cells that "burn" the entire molecule of sugar to capture a large amount of energy as ATP, cancer cells are wasteful.
Cancer cells only partially break down sugar molecules. They overuse the first step of respiration, glycolysis. They frequently do not complete the second step, oxidative phosphorylation.
This results in only 2 molecules of ATP per each glucose molecule instead of the 36 or so ATPs healthy cells gain. As a result, cancer cells need to use a lot more sugar molecules to get enough energy to survive.
introduction to WARBERG PHENOMENA:
WARBURG EFFECT Usually, cancer cells are highly glycolytic (glucose addiction) and take up more glucose than do normal cells from outside.
Otto Heinrich Warburg (; 8 October 1883 – 1 August 1970) In 1931 was awarded the Nobel Prize in Physiology for his "discovery of the nature and mode of action of the respiratory enzyme.
WARNBURG EFFECT : cancer cells under aerobic (well-oxygenated) conditions to metabolize glucose to lactate (aerobic glycolysis) is known as the Warburg effect. Warburg made the observation that tumor slices consume glucose and secrete lactate at a higher rate than normal tissues.
Nutraceutical market, scope and growth: Herbal drug technologyLokesh Patil
As consumer awareness of health and wellness rises, the nutraceutical market—which includes goods like functional meals, drinks, and dietary supplements that provide health advantages beyond basic nutrition—is growing significantly. As healthcare expenses rise, the population ages, and people want natural and preventative health solutions more and more, this industry is increasing quickly. Further driving market expansion are product formulation innovations and the use of cutting-edge technology for customized nutrition. With its worldwide reach, the nutraceutical industry is expected to keep growing and provide significant chances for research and investment in a number of categories, including vitamins, minerals, probiotics, and herbal supplements.
Observation of Io’s Resurfacing via Plume Deposition Using Ground-based Adapt...Sérgio Sacani
Since volcanic activity was first discovered on Io from Voyager images in 1979, changes
on Io’s surface have been monitored from both spacecraft and ground-based telescopes.
Here, we present the highest spatial resolution images of Io ever obtained from a groundbased telescope. These images, acquired by the SHARK-VIS instrument on the Large
Binocular Telescope, show evidence of a major resurfacing event on Io’s trailing hemisphere. When compared to the most recent spacecraft images, the SHARK-VIS images
show that a plume deposit from a powerful eruption at Pillan Patera has covered part
of the long-lived Pele plume deposit. Although this type of resurfacing event may be common on Io, few have been detected due to the rarity of spacecraft visits and the previously low spatial resolution available from Earth-based telescopes. The SHARK-VIS instrument ushers in a new era of high resolution imaging of Io’s surface using adaptive
optics at visible wavelengths.
Richard's aventures in two entangled wonderlandsRichard Gill
Since the loophole-free Bell experiments of 2020 and the Nobel prizes in physics of 2022, critics of Bell's work have retreated to the fortress of super-determinism. Now, super-determinism is a derogatory word - it just means "determinism". Palmer, Hance and Hossenfelder argue that quantum mechanics and determinism are not incompatible, using a sophisticated mathematical construction based on a subtle thinning of allowed states and measurements in quantum mechanics, such that what is left appears to make Bell's argument fail, without altering the empirical predictions of quantum mechanics. I think however that it is a smoke screen, and the slogan "lost in math" comes to my mind. I will discuss some other recent disproofs of Bell's theorem using the language of causality based on causal graphs. Causal thinking is also central to law and justice. I will mention surprising connections to my work on serial killer nurse cases, in particular the Dutch case of Lucia de Berk and the current UK case of Lucy Letby.
This presentation explores a brief idea about the structural and functional attributes of nucleotides, the structure and function of genetic materials along with the impact of UV rays and pH upon them.
Richard's entangled aventures in wonderlandRichard Gill
Since the loophole-free Bell experiments of 2020 and the Nobel prizes in physics of 2022, critics of Bell's work have retreated to the fortress of super-determinism. Now, super-determinism is a derogatory word - it just means "determinism". Palmer, Hance and Hossenfelder argue that quantum mechanics and determinism are not incompatible, using a sophisticated mathematical construction based on a subtle thinning of allowed states and measurements in quantum mechanics, such that what is left appears to make Bell's argument fail, without altering the empirical predictions of quantum mechanics. I think however that it is a smoke screen, and the slogan "lost in math" comes to my mind. I will discuss some other recent disproofs of Bell's theorem using the language of causality based on causal graphs. Causal thinking is also central to law and justice. I will mention surprising connections to my work on serial killer nurse cases, in particular the Dutch case of Lucia de Berk and the current UK case of Lucy Letby.
(May 29th, 2024) Advancements in Intravital Microscopy- Insights for Preclini...Scintica Instrumentation
Intravital microscopy (IVM) is a powerful tool utilized to study cellular behavior over time and space in vivo. Much of our understanding of cell biology has been accomplished using various in vitro and ex vivo methods; however, these studies do not necessarily reflect the natural dynamics of biological processes. Unlike traditional cell culture or fixed tissue imaging, IVM allows for the ultra-fast high-resolution imaging of cellular processes over time and space and were studied in its natural environment. Real-time visualization of biological processes in the context of an intact organism helps maintain physiological relevance and provide insights into the progression of disease, response to treatments or developmental processes.
In this webinar we give an overview of advanced applications of the IVM system in preclinical research. IVIM technology is a provider of all-in-one intravital microscopy systems and solutions optimized for in vivo imaging of live animal models at sub-micron resolution. The system’s unique features and user-friendly software enables researchers to probe fast dynamic biological processes such as immune cell tracking, cell-cell interaction as well as vascularization and tumor metastasis with exceptional detail. This webinar will also give an overview of IVM being utilized in drug development, offering a view into the intricate interaction between drugs/nanoparticles and tissues in vivo and allows for the evaluation of therapeutic intervention in a variety of tissues and organs. This interdisciplinary collaboration continues to drive the advancements of novel therapeutic strategies.
Comparative structure of adrenal gland in vertebrates
Physics ii lab 1
1. Republic of the Philippines
BATANGAS STATE UNIVERSITY
ARASOF-Nasugbu
R. Martinez Street Brgy. Bucana
Nasugbu, Batangas
COLLEGE OF TEACHER EDUCATION
Group No. 01_____ Date: January 30, 2018
Section: BSED – 3202 Rating: _______________
Laboratory Activity No. 01
Experiment No. 01
I. Title
Water Molecules in Different Temperature
II. Introduction
In this experiment, the students should be able to identify the water molecule in
different temperature through the use of food coloring. How can one identify distinct
characteristics and exact temperature of hot and cold water without the aid of
thermometer?
This activity used food coloring as an indicator of heat in a sample of water with
known reading of hotness or coldness. All the variables in this experiment were
controlled except for the temperature in order to observe an accurate set-up. As hat
was pictured below, the glasses are in the same size and shape in order to lessen the
error in the experiment.
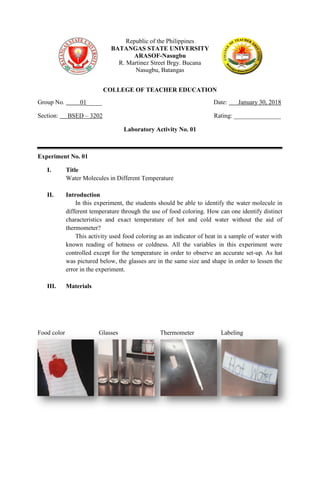
III. Materials
Food color Glasses Thermometer Labeling
2. IV. Procedure
1. Fill your glasses. Two should have hot water in it; the other two is for cold water.
The last glass is for the tap water.
2. Label the glasses you are going to use in the experiment.
3. Pick a color of food coloring. Put three (3) drops of food coloring in each glass.
4. Wait watch and record what happens.
V. Data and Results
1. Hot water
49.7 ° C
In hot water, the food coloring diffused quickly and evenly.
2. Cold water
10 ° C
The food coloring, when dropped in the cold water, compressed only at
the bottom of the glass.
3. Tap water
25 ° C
Food coloring, in tap water, diffused also like in a hot water but in a slow
process.
VI. Conclusions
The food coloring was used as an indicator for water in different temperature. The
molecules move very fast in a hot medium and there is the presence of motion unlike
in the cold water that the molecules are just condensed in a place. The group
concluded that if the temperature gets higher in a substance, the kinetic energy will
also increase.
VII. Answers to Questions/ Problems
1. What happens to the drop of food coloring?
The drop of food coloring differs in three glasses of water that has
different temperature. It just stays at the bottom of the cold water while in the hot
water it easily diffused. It also diffused at tap water but not as fast compared to
hotter one.
2. Does the food coloring behave the same in each of the jars? Why or why not?
The food coloring does not behave the same in each jar of the experiment
because they have different temperature.
3. What is different about glasses?
The only different factor in each glass of water is the temperature. The
appearance of each one also differs when the food coloring was applied into it.
There was also different motion of particles in each jar.
4. What can you say about the relationship between the heat and the movement of
molecules?
When the temperature is cold, the movements of molecules are very
minimal and slow. The motion of molecules becomes higher when the level of the
temperature also increases.
3. VIII. Documentation
Pictures show measuring temperature using thermometer, measuring the volume of
solution, and observing the lower meniscus of the beaker for accurate measurement.
Pictures show measurement of hot water, labeling it, and measuring its temperature.
Picture shows the label for tap water, cold water temperature reading, and actual color
of food coloring used.
Pictures show diffusion of food coloring in three different temperature of water; tap
water, hot water, and cold water.
4. Experiment No. 02
I. Title
Altering Air Pressure by Changing Temperature
II. Introduction
This activity enables students to observe what change will happen if the
temperature is applied in a specific area between open space and water. The group
used food coloring to easily identify the displacement of the water from its original
level and after trials or sets.
This activity was usually done on ordinary laboratory activity to illustrate the
relation of heat to the changing pressure on the environment.
III. Materials
Food color Glass
Candles Bowl
IV. Procedure
1. Set your candle on the plate and pour approximately ½ to 1 cup of water on the
plate.
2. Light your candle then place a jar or vase upside-down over the candle.
V. Data and Results
Set A
One candle
200 ml water
The water goes up a centimeter away from the level of surface of the origin.
5. Set B
Two candles
200 ml water
The water has observably higher elevation compared to the first set.
Set C
Three candles
200 ml water
The water reached the highest elevation among the three sets.
VI. Conclusions
The water in different sets under this experiment rise or elevated its level because
it replaces the space once occupied by the heat. Air pressure was greatly affected in
this activity. By changing the number of candles inside every set, there is an
observable variation which occurs when the light of the candle escape every time the
area was enclosed. As the number of candles become higher the elevation of water
surface also increases and it only means that greater heat is required to produce
greater pressure and vice versa.
VII. Answers to Questions/ Problems
1. As the candle goes out, all of the water sucked up into the jar. The water rises, but
why does the water rises?
The water rises because it used to get the same space as heat once
occupied.
2. What is the maximum amount of water your set-up can suck up?
In each three set-up, Set C has highest sucked-up water through the use of
three candles and it is almost half of the capacity volume of glass.
3. If you will change your glass container to something bigger or smaller, how will it
affect your results?
If the bigger container would be used, the water surface elevation would
be the only factor that is affected. The sucked-up volume would not change
because the amount of heat was not changed too.
4. Does changing your candle for a bigger or smaller one affect the results?
It depends on the amount of heat released by the candle because there are
big candles that have small or oversized flame. As a process in the different set-up,
the heat increase by adding a candle with the same size and shape.
5. How does changing the temperature of your water affect the results?
The temperature was changed through adding identical candle on each set.
As the temperature goes higher the amount of sucked-up amount of water also
increases because it occupies larger space once occupied by the heat that escaped
after the light of the candle used gets off.
6. VIII. Documentation
Pictures show the water poured into the bowl, the two candles was lighted, and a candle
lighted before it was covered using a glass.
Pictures show three lighted candles, closed set-up with uncolored water, and the actual
position of placing over a glass.
Pictures show the light getting off from a candle, enclosed set-up with colored water, and
two candles after rising of water.
Picture shows the three candles being washed by colored water after getting off of lights.
7. Experiment No. 03
I. Title
Phase Change of Water by Heat
II. Introduction
Water has different properties and it can also change its form into three different
forms namely: solid, liquid, and gas. A substance would undergo a phase change if it
reached its latent heat.
There are issued latent heat point for different substances after water. According
to the field of science in general, water’s boiling point is 100 °C and its freezing point
is 0 °C. In this activity, the students should be able to determine the change happen
from melting of ice to the boiling of the water and ice solution using recorded
temperature.
III. Materials
Beaker Lamp
Ice Tripod and wire gauze
Thermometer Stopwatch
8. IV. Procedure
1. Fill the beaker with ice and water.
2. Turn on your heat source. Do not put the beaker on the heat source yet. The
source of energy must remain constant throughout the experiment.
3. Insert a thermometer into the beaker and use it as a stirring rod – be sure to hold
the thermometer so that it does not touch the sides or bottom of the beaker.
4. Stir the solution gently throughout the experiment.
5. When the thermometer reaches its lowest reading, record this under time zero on
the Report sheet.
6. Quickly place the beaker on the heat source.
7. Read and record the temperature every 30 seconds, continuing for at least 10
minutes after the water reaches a full, rolling boil. Remember to continue stirring
throughout the experiment.
8. Record the time in your data:
a. When the ice begins to melt
b. When the ice is entirely melted
c. When the water begins to boil
9. Graph your data on the graph provided placing time on the horizontal axis.
V. Data and Results
Water
50 ml
Ice
30 grams
Water + Ice Solution
Starting point is 10 °C
The temperature reading was recorded after every thirty seconds.
Table 1. Water + Ice Solution over
Time Temperature Observation
00:00 10 °C The ice has no changes
00:30 10 °C The ice has no changes
01:00 10 °C The ice melts slowly
01:30 10 °C The ice melts slowly
02:00 10 °C The ice melts slowly
02:30 11 °C The ice melts slowly
03:00 11 °C The ice melts slowly
03:30 11 °C The ice melts slowly
04:00 11 °C The ice melts slowly
04:30 12 °C The ice melts slowly
05:00 12 °C The ice melts slowly
05:30 12 °C The ice melts slowly
06:00 12 °C The ice melts slowly
06:30 13 °C The ice melts moderately
07:00 13 °C The ice melts moderately
07:30 14 °C The ice melts moderately
08:00 14 °C The ice melts moderately
9. 08:30 15 °C The ice melts moderately
09:00 15 °C The ice melts moderately
09:30 15 °C The ice melts moderately
10:00 16 °C The ice melts quickly
10:30 16 °C The ice melts quickly
11:00 17 °C The ice melts quickly
11:30 17 °C The ice melts quickly
12:00 18 °C The ice melts quickly
12:30 18 °C The ice melts quickly
13:00 19 °C The ice melts quickly
13:30 20 °C The ice melts quickly
14:00 21 °C The ice is like a seed
14:30 21 °C The ice is like a seed
15:00 22 °C The ice is like a seed
15:30 22 °C The ice is like a seed
16:00 23 °C The ice is totally gone
16:30 24 °C There is no reaction
17:00 24 °C There is no reaction
17:30 25 °C There is no reaction
18:00 26 °C There is no reaction
18:30 27 °C There is no reaction
19:00 28 °C There is no reaction
19:30 29 °C There is no reaction
20:00 30 °C There is no reaction
20:30 30 °C There is no reaction
21:00 30 °C There is no reaction
21:30 31 °C There is no reaction
22:00 31 °C There is no reaction
22:30 32 °C There is no reaction
23:00 33 °C There is no reaction
23:30 34 °C There is no reaction
24:00 35 °C There is no reaction
24:30 36 °C There is no reaction
25:00 37 °C There is no reaction
25:30 39 °C There is no reaction
26:00 40 °C There is no reaction
26:30 42 °C There is no reaction
27:00 43 °C There is no reaction
27:30 45 °C There is no reaction
28:00 46 °C There are tiny bubbles
28:30 47 °C There are tiny bubbles
29:00 49 °C There are tiny bubbles
29:30 50 °C There are tiny bubbles
30:00 51 °C There are tiny bubbles
30:30 53 °C There are tiny bubbles
31:00 55 °C There are tiny bubbles
31:30 58 °C There are tiny bubbles
32:00 60 °C There are tiny bubbles
32:30 62 °C There are tiny bubbles
33:00 63 °C There are tiny bubbles
33:30 64 °C There are tiny bubbles
34:00 66 °C There are tiny bubbles
34:30 68 °C There are tiny bubbles
35:00 70 °C Tiny bubbles float slowly
35:30 75 °C Tiny bubbles float slowly
10. 0
10
20
30
40
50
60
70
80
90
100
0 5 10 15 20 25 30 35 40 45
Time and Temperature
36:00 78 °C Tiny bubbles float rapidly
36:30 84 °C Tiny bubbles float rapidly
37:00 89 °C Tiny bubbles float rapidly
37:30 92 °C The solution boils
38:00 93 °C The solution boils
38:30 94 °C The solution boils
39:00 93 °C The solution boils
39:30 94 °C The solution boils
40:00 93 °C The solution boils
This table and graph shows phase change of water and where specific temperature
and time as it happens. The temperature reading is almost constant and there were
times that it turns back a unit of temperature, maybe because of external factors like
air-conditioning of the laboratory.
VI. Conclusions
The ice melts as it is exposed to the heat; the phase change happened upon
encountering the latent heat. The rate of temperature displacement is affected by the
external factors which increases error in the experiment. It starts to become vapor
when it reaches the boiling point.
VII. Answers to Questions/ Problems
1. According to your graph, did the temperature of water/ ice increase while the ice
was melting?
The temperature of water and ice solution remains low as the ice was melting.
The temperature readings only increase a few units.
2. According to your graph, what happened to the temperature of the water between
the time the ice melted and the water boiled?
The temperature starts to rise constantly after the ice melted with the
consideration of external factors that may affect its rate.
Figure 1. Graphical representation of time (minute) and temperature (degree Celcius)
11. 3. According to your graph, what change occurred in the temperature after the water
began to boil?
The temperature becomes does not go beyond the highest reading and starts to
create a vapor.
4. What can you tell about the rate of temperature change between the time the ice
melted and the water boiled?
The rate of temperature change is not that constant as what is illustrated on the
graph. The rate in between is also unpredictable because of the affecting factors.
5. From the range of temperature change, what can you infer about the rate of
energy input during each minute?
The rate of energy is constant because, the first place, the lamp continuously
releases heat from the starting point. Technically, it is also constant for the reason that
its graph did not took 45° line straightly but it is affected by the coldness of ice and
the near peak of boiling point. Therefore, the energy release was constant.
6. Before the temperature began its steady rise, for what was the added heat being
used?
The added heat before the steady rise is for the process of melting ice.
7. During the time of steadily increasing temperature, what change in energy
occurred because of the added heat?
There is a constant change in energy because the water already accepts heat
constantly from the time that ice melted.
8. During the last ten minutes, what changes occurred because of the added heat?
The rate of the temperature doubles because there is already added heat and upon
reaching the boiling point, the degree of temperature plays only between three highest
units.
VIII. Documentation
Pictures show the lamp is being lighted, the starting point is measured, constant reading of
temperature through the use of thermometer, and the boiling point of water and ice solution.
12. Republic of the Philippines
BATANGAS STATE UNIVERSITY
ARASOF-Nasugbu
R. Martinez Street Brgy. Bucana
Nasugbu, Batangas
COLLEGE OF TEACHER EDUCATION
L A B O R A T O R Y R E P O R T
IN
PHYSICS FOR HEALTH SCIENCES II
Activity No. 01
Submitted by:
Balaquiot, Jasmin V.
Escorido, Jenny May F.
Panaligan, Erwin C.
Tampis, Perlyn B.
Tindugan, Aristotle E.
BSED - 3202
Submitted to:
Mr. Michael John V. Francisco
Course Instructor