Downloaded 142 times


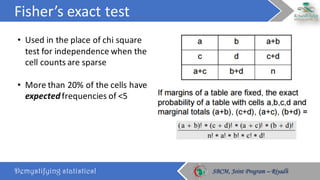
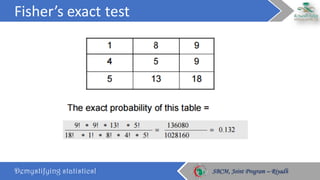


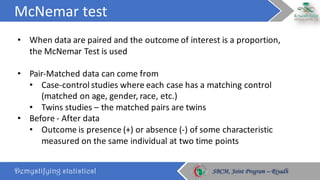


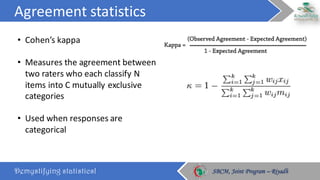

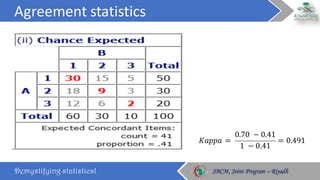


This document discusses statistical tests for analyzing categorical data. It begins by defining categorical variables and the prerequisites for selecting a statistical test. It then outlines various bivariate and multivariate tests that can be used for unpaired and paired categorical data, including chi-square tests, Fisher's exact test, McNemar's test, and logistic regression. It also discusses measures of association like odds ratios. Examples are provided to illustrate McNemar's test and calculating interrater reliability using Cohen's kappa. The document concludes by emphasizing the importance of selecting the appropriate statistical method based on one's data and checking assumptions.