Elements of Cost: Classification of Cost:element wise classification :function wise classification :behavior wise classification: Managerial decision making classification
UNIT - IV: COST CONCEPTS: Classification of costs - Direct and Indirect expenses- Cost
Sheet - Unit Costing - Job Costing - Mechanics & Application of Marginal Costing in terms of
cost control - Profit Planning - concept of CVP relationship; BEP and their applications.
Alexandre gurgel policy development with local content and infrastructure inv...Reporte Energía
IGEF 2013: Presentación de Alexandre Gurgel, Director de Desarrollo Industrial y Políticas Públicas, Compañía del Desarrollo del Estado de Río de Janeiro
This course is basically designed for metal engineering production management level-4 students. But any mechanical engineering profession who wants to know about how to calculate the manufacturing cost of a product can refer this note.
Estimation of Manufacturing Costs in the Early Stages of Product Development ...IJMER
ABSTRACT : One of the crucial factors in increase of productivity of supply chains is the management of production
costs. Since the number of methods and tools used to estimate the production costs in product development phase is limited,
the designers often estimate the costs based on their experience. The designers can mainly affect the direct costs of a
product, including material, labor and purchased parts. Direct costs vary greatly depending on the number of produced
units. Indirect costs include for example the work in process, storage and internal transportations. The developed software
prototype is based on the Lucas method. It will take a simple and ideal part, whose costs are known and then use factors to
produce the final costs. The application calculates sophisticated estimates about how much it would cost to produce a single
part. The developed software seems to work surprisingly well. It may not tell the final truth about the component costs but
can be used to open the eyes of the designer when the costs of the component under design are growing too high. It can also
be used to find the most suitable manufacturing method and when considering the make or buy decisions.
Keywords: Cost estimation, Manufacturing costs, Product Development
Quoting, Estimating and Scheduling For Manufacturers White Paper from MIE Sol...MIE Solutions
E Book about Quoting, Estimating and Scheduling For Manufacturers. Covering the following topics:
Indirect Material Costs
Material Cost
Manufacturing Costs
Direct and Indirect Costs
Fixed and Variable Costs
Job Costing Software
Cost Estimate Techniques
Purpose of Cost Estimating
Estimating The Costs
Cost Estimate Types
Profit Improvement and Cost Reduction
Cost Estimating Versus Cost Accounting
Estimating is more than Setup and Run Time Part
Estimating is more than Setup and Run Time Part
Estimating Software Guide
Job Shop Quoting Labor Hours Accumulation
How To : Manufacturing Hourly Rate Calculation
What is Forward and Backward Scheduling
Introduction To Job Shop Scheduling
Exploded Bill Of Materials
What Are Bill Of Materials?
Cost Estimating Purchased Parts Or Materials
Manufacturing Efficiency in Estimating
Job Shop Hours Defined
Fabrication Workcenter Overhead Rates
Machine Shop Rates Part 2
Machine Shop Rates Part 1
Standard Shop Rate
Calculating Shop Rates Using The Income Statement
Introduction To Shop Rates
Calculating Cycle Time with Estimating Software
Price Quote Software Handles Inspection
How To Estimate Handling Time
Manufacturing Estimating Cycle Time
Quoting Dependencies Between Operations
What is Setup Time
Estimating
BUSINESS FOCUSLowering Healthcare Costs and Improving Patient .docxhumphrieskalyn
BUSINESS FOCUS
Lowering Healthcare Costs and Improving Patient Care
Source: Catherine Arnst, “Radical Surgery,” Bloomberg Businessweek, January 18, 2010, pp. 40–45.
Providence Regional Medical Center’s (PRMC) “single stay” ward is lowering healthcare costs and increasing patient satisfaction. Rather than transporting post-surgical patients to stationary equipment throughout the hospital, a “single stay” ward brings all required equipment to stationary patients. For example, “after heart surgery, cardiac patients remain in one room throughout their recovery, only the gear and staff are in motion. As the patient’s condition stabilizes, the beeping machines of intensive care are removed and physical therapy equipment is added.” The results of this shift in orientation have been impressive. Patient satisfaction scores have skyrocketed and the average length of a patient’s stay in the hospital has declined by more than a day.
LEARNING OBJECTIVES
After studying Chapter 2, you should be able to:
LO2–1
Understand cost classifications used for assigning costs to cost objects: direct costs and indirect costs.
LO2–2
Identify and give examples of each of the three basic manufacturing cost categories.
LO2–3
Understand cost classifications used to prepare financial statements: product costs and period costs.
LO2–4
Understand cost classifications used to predict cost behavior: variable costs, fixed costs, and mixed costs.
LO2–5
Analyze a mixed cost using a scatter-graph plot and the high-low method.
LO2–6
Prepare income statements for a merchandising company using the traditional and contribution formats.
LO2–7
Understand cost classifications used in making decisions: differential costs, opportunity costs, and sunk costs.
LO2–8
(Appendix 2A) Analyze a mixed cost using a scattergraph plot and the least-squares regression method.
LO2–9
(Appendix 2B) Identify the four types of quality costs and explain how they interact.
LO2–10
(Appendix 2B) Prepare and interpret a quality cost report.
Page 28
This chapter explains that in managerial accounting the termcost is used in many different ways. The reason is that there are many types of costs, and these costs are classified differently according to the immediate needs of management. For example, managers may want cost data to prepare external financial reports, to prepare planning budgets, or to make decisions. Each different use of cost data demands a different classification and definition of costs. For example, the preparation of external financial reports requires the use of historical cost data, whereas decision making may require predictions about future costs. This notion ofdifferent costs for different purposes is a critically important aspect of managerial accounting.
Exhibit 2–1 summarizes the cost classifications that will be defined in this chapter, namely cost classifications (1) for assigning costs to cost objects, (2) for manufacturing companies, (3) for preparing financial statements, (4) for pred ...
Q.2 steps required to implement ABC within the companyABC Costing .pdfanjalipub
Q.2 steps required to implement ABC within the company
ABC Costing is a supplemental method of cost accounting that provides the decision-making
information absent from traditional costing methods. While ABC costing is not limited by
business unit boundaries, it can not fully supplant traditional costing methods as it often fails to
meet financial reporting requirements for businesses.
ABC Costing focuses on costs contributing to production of a product. It does not attribute other
general costs that do not have at least an indirect relationship to the product. While traditional
costing systems focus on direct costs and burden a product with other fixed costs, activity based
costing increases accuracy of indirect cost assignment.
In their 1999 book, Managerial Accounting, Garrison and Noreen identify six core steps to ABC
costing implementation.*
Implementation Steps
Step #1: Activity Identification
First, activities must be identified and grouped together in activity pools. Activity pools are the
supporting activities that tie in to a product line or service These pools or buckets may include
fractionally assigned costs of supporting activities to individual products as appropriate during
the second step.
Step #2: Activity Analysis
ABC continues with activity analysis, clearly identifying the processes which support a product
and avoiding some of the systemic inaccuracies of traditional costing. ABC costing requires
activity analysis, similar to the process mapping found in lean manufacturing.
This activity analysis identifies indirect cost relationships and allows assignment of some
percentage of that activity to an end product directly.
Step #3: Assignment of Costs
Based on the findings of step #1 and #2, costs are assigned to an activity pool. For example,
human resources costs would be assigned to indirect administrative or indirect management
costs. These pools will each have some contribution to object cost.
Step #4: Calculate Activity Rates
Initial analysis may include direct labor hours, or indirect support labor. These activities must be
assigned a value in real currency. All weightings must be added at this step. For instance,
production labor hours should be in terms of a weighted labor rate including benefit costs.
Step #5: Assign Costs to Cost Objects
Once activity costs, pools and rates are identified and clearly defined, the next step is to assign
them to cost objects. Objects are generally defined as the results offered to a customer. In both
manufacturing and non-manufacturing environments, this product should have some saleable
value to compare to the assigned costs.
Step #6: Prepare and Distribute Management Reports
Once ABC costing analysis is complete, that cost data should be placed in a concise and coherent
manner for cost object and process owners. This communication of the costing analysis is critical
to justify the cost of the analysis, as often this is not an inconsequential cost.
Q.3our classifications of the ABC .
Embracing GenAI - A Strategic ImperativePeter Windle
Artificial Intelligence (AI) technologies such as Generative AI, Image Generators and Large Language Models have had a dramatic impact on teaching, learning and assessment over the past 18 months. The most immediate threat AI posed was to Academic Integrity with Higher Education Institutes (HEIs) focusing their efforts on combating the use of GenAI in assessment. Guidelines were developed for staff and students, policies put in place too. Innovative educators have forged paths in the use of Generative AI for teaching, learning and assessments leading to pockets of transformation springing up across HEIs, often with little or no top-down guidance, support or direction.
This Gasta posits a strategic approach to integrating AI into HEIs to prepare staff, students and the curriculum for an evolving world and workplace. We will highlight the advantages of working with these technologies beyond the realm of teaching, learning and assessment by considering prompt engineering skills, industry impact, curriculum changes, and the need for staff upskilling. In contrast, not engaging strategically with Generative AI poses risks, including falling behind peers, missed opportunities and failing to ensure our graduates remain employable. The rapid evolution of AI technologies necessitates a proactive and strategic approach if we are to remain relevant.
Instructions for Submissions thorugh G- Classroom.pptxJheel Barad
This presentation provides a briefing on how to upload submissions and documents in Google Classroom. It was prepared as part of an orientation for new Sainik School in-service teacher trainees. As a training officer, my goal is to ensure that you are comfortable and proficient with this essential tool for managing assignments and fostering student engagement.
Unit 8 - Information and Communication Technology (Paper I).pdfThiyagu K
This slides describes the basic concepts of ICT, basics of Email, Emerging Technology and Digital Initiatives in Education. This presentations aligns with the UGC Paper I syllabus.
The Roman Empire A Historical Colossus.pdfkaushalkr1407
The Roman Empire, a vast and enduring power, stands as one of history's most remarkable civilizations, leaving an indelible imprint on the world. It emerged from the Roman Republic, transitioning into an imperial powerhouse under the leadership of Augustus Caesar in 27 BCE. This transformation marked the beginning of an era defined by unprecedented territorial expansion, architectural marvels, and profound cultural influence.
The empire's roots lie in the city of Rome, founded, according to legend, by Romulus in 753 BCE. Over centuries, Rome evolved from a small settlement to a formidable republic, characterized by a complex political system with elected officials and checks on power. However, internal strife, class conflicts, and military ambitions paved the way for the end of the Republic. Julius Caesar’s dictatorship and subsequent assassination in 44 BCE created a power vacuum, leading to a civil war. Octavian, later Augustus, emerged victorious, heralding the Roman Empire’s birth.
Under Augustus, the empire experienced the Pax Romana, a 200-year period of relative peace and stability. Augustus reformed the military, established efficient administrative systems, and initiated grand construction projects. The empire's borders expanded, encompassing territories from Britain to Egypt and from Spain to the Euphrates. Roman legions, renowned for their discipline and engineering prowess, secured and maintained these vast territories, building roads, fortifications, and cities that facilitated control and integration.
The Roman Empire’s society was hierarchical, with a rigid class system. At the top were the patricians, wealthy elites who held significant political power. Below them were the plebeians, free citizens with limited political influence, and the vast numbers of slaves who formed the backbone of the economy. The family unit was central, governed by the paterfamilias, the male head who held absolute authority.
Culturally, the Romans were eclectic, absorbing and adapting elements from the civilizations they encountered, particularly the Greeks. Roman art, literature, and philosophy reflected this synthesis, creating a rich cultural tapestry. Latin, the Roman language, became the lingua franca of the Western world, influencing numerous modern languages.
Roman architecture and engineering achievements were monumental. They perfected the arch, vault, and dome, constructing enduring structures like the Colosseum, Pantheon, and aqueducts. These engineering marvels not only showcased Roman ingenuity but also served practical purposes, from public entertainment to water supply.
Acetabularia Information For Class 9 .docxvaibhavrinwa19
Acetabularia acetabulum is a single-celled green alga that in its vegetative state is morphologically differentiated into a basal rhizoid and an axially elongated stalk, which bears whorls of branching hairs. The single diploid nucleus resides in the rhizoid.
A Strategic Approach: GenAI in EducationPeter Windle
Artificial Intelligence (AI) technologies such as Generative AI, Image Generators and Large Language Models have had a dramatic impact on teaching, learning and assessment over the past 18 months. The most immediate threat AI posed was to Academic Integrity with Higher Education Institutes (HEIs) focusing their efforts on combating the use of GenAI in assessment. Guidelines were developed for staff and students, policies put in place too. Innovative educators have forged paths in the use of Generative AI for teaching, learning and assessments leading to pockets of transformation springing up across HEIs, often with little or no top-down guidance, support or direction.
This Gasta posits a strategic approach to integrating AI into HEIs to prepare staff, students and the curriculum for an evolving world and workplace. We will highlight the advantages of working with these technologies beyond the realm of teaching, learning and assessment by considering prompt engineering skills, industry impact, curriculum changes, and the need for staff upskilling. In contrast, not engaging strategically with Generative AI poses risks, including falling behind peers, missed opportunities and failing to ensure our graduates remain employable. The rapid evolution of AI technologies necessitates a proactive and strategic approach if we are to remain relevant.
BÀI TẬP BỔ TRỢ TIẾNG ANH GLOBAL SUCCESS LỚP 3 - CẢ NĂM (CÓ FILE NGHE VÀ ĐÁP Á...
Chapter11 economics
1. Elec3017:
Electrical Engineering Design
Chapter 11: Economics and Costing
A/Prof David Taubman
September 5, 2006
1 Purpose of this Chapter
In Chapter 3 we discussed product pricing and its interaction with costing. In
this chapter we begin by considering methods to develop reasonable cost esti-
mates for a new product. Together with a selling price and marketing estimates
of the expected sales volume, we will then be in a position to build a business
plan for our product development activity. This is the subject of Section 3,
in which we develop an economic framework for making product development
decisions. We conclude the chapter in Section 4, with a brief discussion of non-
economic factors, which should also be taken into consideration when making
decisions.
2 Elements of a Costing System
If a manufacturing company were to produce only one product, and all costs
were directly proportional to the number of units of that product produced,
costing would be a relatively simple process. There are several things which
make costing difficult. One of these is the fact that many manufacturing costs
are shared across multiple products. Examples include rent, lease or deprecia-
tion on machinery, and development costs which might not even contribute to
saleable products (e.g., aborted development projects). Another source of diffi-
culty is that certain costs may be difficult to reliably anticipate: manual labour
requirements may be hard to predict; foreign exchange rates may fluctuate; and
so forth.
To address these difficulties, it is helpful to identify two separate elements
of a costing system. The first is a cost accumulation system (i.e., an accounting
system), which keeps track of all actual costs, classifying them according to
the nature of the activity. The second element is a set of cost cost objectives.
In our case, the cost objectives are the manufactured products from which we
expect to derive our revenue. At the end of the day, our goal is to attribute
1
2. c
°Taubman, 2006 ELEC3017: Economics and Costing Page 2
electronic components
Cost objectives
unpopulated PCB
(outsourced)
Product A
Accumulated dedicated product
direct costs testing staff
package & shipping
product promotion
materials handling
component insertion
machinery Product B
Accumulated soldering machinery
indirect costs
rent & utilities
managerial staff
new product development
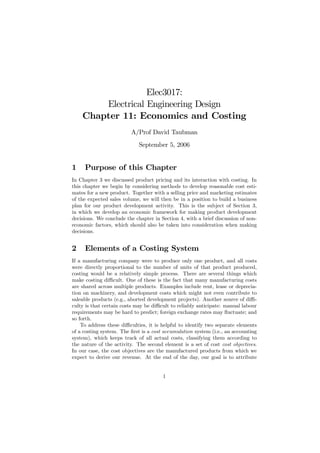
Figure 1: Attributing accumulated costs to cost objectives (products). Listed
costs are for illustrative purposes only. Dashed lines are used to highlight the
fact that indirect costs can only be approximately assigned to cost objectives.
This is done through “cost drivers.”
all accumulated costs to cost objectives. This includes not only those costs
which are directly related to the products we manufacture, but also indirect
costs (overhead). This allocation of costs to objectives is illustrated in Figure
1.
As suggested by the figure, direct costs and indirect costs need to be treated
differently. Direct costs are those which are incurred as a direct result of man-
ufacturing a specific product. Examples include the cost of purchasing compo-
nents, the cost of packaging and shipping products, and the direct labour costs
associated with personnel who work solely on the production a single product.
All other costs are indirect, and a meaningful basis must be found for attributing
these indirect costs to products; this is the subject of Section 2.2 below.
The reason for attributing all costs to products (cost objectives) is that these
are the only means we have of recovering our costs. In order to determine the
profitability of a new product development effort, it is important to ascertain
the degree to which profits will eventually outstrip costs. If we do not account
correctly for all costs, applying our resources to seemingly profitable products
may leave us bankrupt.
3. c
°Taubman, 2006 ELEC3017: Economics and Costing Page 3
2.1 Direct Costs
The most obvious example of a direct cost is the cost of the various components
found on our product’s BOM (Bill of Materials). At a simplistic level, we can
say that this cost is directly proportional to the number of product units which
we manufacture and sell. In practice, of course, the cost of components will
vary with the quantity in which we buy them, but this can readily be factored
into the costing model for the new product we are developing.
More generally, any cost which can be directly related to the number of
produced units of a particular product is best considered a direct cost. Figure 1
shows some other examples. In some cases, costs associated with personnel can
be considered direct. This is true if a product requires dedicated staff (direct
labour), whose resources cannot be shared with other products. One approach is
to identify permandent internal staff as indirect costs, and external contractors
or casual workers as direct costs.
2.2 Indirect Costs and Cost Drivers
Many of the accumulated costs associated with running an organization cannot
be directly allocated to individual products. Examples include:
• Senior managers, supervisors, office staff, maintenance and cleaning staff;
• Depreciation or lease of manufacturing equipment;
• Rent, utilities (e.g., electricity) and insurance;
• Computers, photocopiers and office consumables;
• Staff development training;
• The costs of aborted development efforts.
One way to handle indirect costs is to factor them into an overhead margin.
This can only be done based on experience. Over time, for example, we may
find that our indirect costs average out at around $5,000,000 per year and that
our direct manufacturing costs for revenue generating products typically come
to around $20,000,000 per year. Based on this information, we determine that
a 25% margin should be added to the direct costs of every product, in order to
cover indirect costs. This overhead margin is added prior to any profit margin.
This method is very simple, but does not properly reflect the impact of design
decisions on costs. In particular, this method provides no incentive to develop
new products which place less demand on expensive manufacturing machinery,
require less labour supervision, and so forth. The margin approach also fails to
recognize the impact of sales volume on the per-unit costs of a product.
For these reasons, it is desirable to more carefully attribute at least some of
the indirect costs to specific products and the number of units of these products
which we expect to manufacture. In this context, we introduce the notion
of a cost driver. A cost driver is any factor which affects the cost of other
4. c
°Taubman, 2006 ELEC3017: Economics and Costing Page 4
activities. For example, component handling costs are affected by the number
of components which must be handled. The cost driver in this case is the number
of components. Depreciation or leasing costs for manufacturing machinery are
affected by the amount of operating time consumed in manufacturing each unit
of a product1 . This, in turn, can usually be decomposed into more detailed
cost drivers, such as the number of components which an insertion machine
must insert into our product’s PCB. Again, the cost driver here might simply
be number of components, although more complex examples will be considered
in lectures.
If an activity has only one cost driver, the accumulated costs associated with
that activity can be simply converted into a costs per unit of the relevant cost
driver. For example, if component handling labour costs amount to $300,000
per annum (based on experience), and our component handling staff typically
order, receive, sort and load 5,000,000 components per annum (also based on
experience), the cost of these activity is identified as $0.06/component. This
can then be attributed to the cost of each unit of a product under development,
simply by multiplying the number of components in that product by $0.06. Of
course, the method is far from perfect. If we are a small firm, with too many
materials handling personnel, they have time on their hands so it will not cost
us anything extra if we manufacture more units of a product — it will simply
give them more work to do. The cost driver method essentially assumes that
are able to efficiently use our resources.
There can, of course, be multiple cost drivers for an activity. For example, a
machine might be capable of performing component insertion and wave soldering
in a tight pipeline. We can convert the annual leasing costs of this machine to
an hourly rate, based on an assumed operating schedule. However, the amount
of time taken to manufacture a unit of our product depends on which of the two
pipelined operations takes longer. If our product has a lot of components, so
that component insertion takes longer than wave soldering, the amount of time
taken to process a unit of the product depends on the number of components,
which becomes the cost driver. On the other hand, if the number of components
is small, wave soldering might dominate so that the cost driver is the number
of PCB’s2 . In this case, each cost driver has an associated per-unit cost (per-
component or per-PCB in our example), but only one cost driver is applicable,
depending on the design.
In the end, a mixture of direct costing, cost drivers and naive overhead
margins are used to attribute all costs to cost objectives (products). Direct
costing is used where possible. For the remaining indirect costs, cost drivers
should be identified where possible. Finally, all remaining indirect costs are
covered by a single overhead margin.
1 The reasoning here, is that if we need to operate a particular type of manufacturing
equipment for twice as much time, we probably need to lease or purchase (and depreciate)
twice as many machines. At least this is true if our manufacturing operation is big enough to
fully consume the resources that we have available.
2 For wave soldering, each PCB takes the same amount of time to solder, no matter how
many components it holds.
5. c
°Taubman, 2006 ELEC3017: Economics and Costing Page 5
2.3 Costing your ELEC3017 Design Project
For your ELEC3017 design project, you are required to estimate manufactur-
ing costs. In a real production environment, costing is a careful activity which
strives to achieve accurate outcomes. Quotes from third party manufacturer’s
are obtained and converted to firm contracts. Labour and machine time require-
ments are calculated from detailed knowledge of the design and close interaction
with manufacturing managers. The level of accuracy required depends on your
expected profit margin. For high volume commodity products, profit margins
may be little than 10%, so costing must be very accurate to avoid the possibil-
ity that the product loses money. For lower volume, specialty products, profit
margins may exceed 100%, which reduces the burden on accurate costing.
Even in real product development, accurate costing is not achieved all at
once. During the early design phases, rough estimates are all that is possible.
This is reflected in your own design proposal, for which estimates will be based
mainly around critical components. For your final report, costing should be
much more thorough. The costing procedures you should use are itemized below.
Note carefully, however, that these are all manufacturing costs. They do not
include any profit margin for the manufacturer; nor do they include margins
added by retailers. For more on such matters, refer to the general discussion of
pricing strategies in Chapter 3.
2.3.1 Electronic Components
If possible, obtain the wholesale price for quantities of 1000 or 10,000 at a time
from manufacturers’ web-sites. If you cannot do this, divide the price you pay
for components from an electronics store such as Jaycar, Altronics or RS Farnell
by about 4. As an example, you should find that individual resistors cost about
$0.01 each, while small ceramic capacitors cost around $0.02 each.
2.3.2 Printed Circuit Board
Most projects will require one PCB. For the sake of uniformity, you should price
the PCB at $2.00, plus $0.01 for each IC pin and passive component lead. This
last cost could be understood as a drilling cost, but many components employed
in final designs may use surface mount technology. It is better understood as a
way of reflecting the impact of design complexity on the size of the PCB. These
costs include the soldering of components onto the PCB.
2.3.3 Mechanical Enclosures
The easiest way to price mechanical enclosures is to find a suitable plastic or
metal case from an electronics hobby store and divide their price by 4. You
may, however, have a more reliable means to estimate such costs — be sure to
justify whatever method you choose.
6. c
°Taubman, 2006 ELEC3017: Economics and Costing Page 6
2.3.4 Component Handling and Insertion Costs
Assume that the combined handling and insertion costs associated with each
component amount to $0.25. The only exception to this is resistors and ca-
pacitors, whose handling and insertion costs should be estimated as $0.10 each.
Note that this may provide you with an incentive to use resistor or capacitor
networks in your final design. The cost of handling and inserting networks is to
be quoted as $0.25 each (as for IC’s), but each network typically includes 4 or
more individual components.
2.3.5 Packaging and Shipping of the Product
For simplicity, assume that packaging, handling and shipping of the final product
costs (k + 1) dollars, where k is the expected weight of your final product, in
kilograms.
2.3.6 Overhead Margin
To accommodate all other indirect costs, add a 20% margin to the costs identi-
fied above — i.e., everything from components through to packaging and shipping
costs.
2.3.7 Personnel
For your final report, you need to include the cost of development activities
leading up to manufacture and sale of your product. To that end, you should
estimate the total cost of each design engineer to be $120/hour. This is intended
to include salary, payroll tax, superannuation, office space occupied by the engi-
neer, ongoing staff development training, and the cost of related administrative
support. This cost is not subject to any additional overhead margin.
3 Cash Flow and the Time Value of Money
Product design and development can (and should) be understood as a finan-
cial investment. During the development phases, financial resources (materials,
salaries and overheads) must be invested. During the initial phases of commer-
cialization, cash outflows also exceed inflows. Components must be purchased,
manufactured product stock must be accumulated and product must be distrib-
uted to retail chains before any financial return can be expected. In the long
run, you hope that cash inflows from sale of the product will exceed your cash
outflows. Figure 2 illustrates the cumulative outward (-ve) and inward (+ve)
cash flows associated with a typical product, starting from design and running
through to the point when the market becomes saturated so that sales drop to
zero. Cash flows such as these are the main features of a business plan.
Since cash outflow precedes cash inflow, we have to be careful to account for
the time value of money. If I spend $1000.00 today and recoup $1000 one year
7. c
°Taubman, 2006 ELEC3017: Economics and Costing Page 7
Cumulative inflow/outflow
Development costs
Ramp-up costs
Marketing and
support costs
Production costs
Figure 2: Cash flow for a typical product life cycle.
later, this is not a break even proposition. The $1000 I recoup in the future is
worth less than the $1000 I spend today. One way to understand this is that
inflation has degraded the value of my money. Another way to understand it
is that I could have invested the original $1000 safely in a bank and earned
interest, doing nothing in return. Thus, to consider that an investment breaks
even, I need at least to recover the interest that I might otherwise have earned.
There are, of course, a variety of more complex factors that should be con-
sidered in a sound business plan. Spending money today for a reward tomorrow
involves risk. New product development is certainly a more risky enterprise than
investing money in a bank. The market dynamics may change over time, foreign
exchange rates may adversely impact both selling price and costs, competitors
may emerge, and unexpected technical difficulties might be encountered. There
could also be unexpected legal liabilities. In view of these risks, we should ex-
pect a higher rate of return on our product development investment than the
interest offered by banks.
In the following sub-sections, we discuss ways of evaluating and expressing
the profitability of a product development activity, so that it can be compared
with other forms of investment. You may also refer to Ulrich and Eppinger [1,
Chapter 11] for a discussion of these issues.
3.1 Net Present Value (NPV)
As mentioned above, a dollar today is generally worth more than a dollar tomor-
row — just how much more depends on the assumed discount rate, r. You can
think of r as the annual compound interest rate paid by a reference investment
scheme. For your product development activity to break even, it must achieve
the same performance as this reference investment scheme. This means that
Y dollars, earned t years in the future, will exactly offset an expenditure of X
8. c
°Taubman, 2006 ELEC3017: Economics and Costing Page 8
dollars today so long as
³ r ´t
Y =X · 1+
100
This is just the compound interest formula, with r expressed as an annual
percentage rate.
Following this argument, we may convert any future revenue Y (t) into an
equivalent value Y (0), measured in today’s dollars, according to
Y (t)
Y (0) = ¡ ¢
r t
1+ 100
The same may be done for future expenses, in which case Y (t) and Y (0) are
negative quantities. We say that Y (0) is the Present Value (PV) of the future
cash inflow or outflow Y (t), at time t.
We have said that our product development investment will break even if
it performs as well as a safe reference investment, paying interest rate r. An
equivalent way to express this break even condition is that the PV of all future
revenue minus the PV of all future expenses equals 0; that is, the Net Present
Value (NPV) of all future cash flows equals 0.
3.2 Ways of Expressing Profitability
One way to express the profitability of a development investment is to simply
measure the NPV of all future cash flows, based on an assumed discount rate
r. This is somewhat useful, but it does not tell us how sensitive the NPV is to
our selected value for r.
In practice, it is hard to know exactly what value for r is most appropriate.
A more interesting question than the magnitude of the NPV, therefore, is the
value of r at which the NPV becomes 0. This value is known as the Return
on Investment (ROI). The ROI allows us to compare our product development
activity with other forms of investment. An ROI of 7% is probably not all that
attractive if lower risk investments such as bank deposits are paying interest at
a rate of 6%.
Another method which is sometimes used to express profitability is the pay-
back period. This is the period P , such that the NPV of all cash flows prior to
time P is zero. The payback period is primarily of interest in identifying risk.
A development activity with a payback period of 20 years exposes us to a lot of
risk, since it is hard to predict cash flows with any reliability that far into the
future. Quite often, the payback period is evaluated at a discount rate of r = 0.
While this reduces its validity somewhat, the actual value of r has only a small
impact on short payback periods.
3.3 Economic Decision Making and Sunk Costs
The purpose of cash flow analysis is ultimately to help us make informed deci-
sions. As part of the ongoing process of planning, project managers must weigh
9. c
°Taubman, 2006 ELEC3017: Economics and Costing Page 9
Internal Factors
• Research and Product External Factors
development costs • Product price
• Development time
Development • Sales volume
• Production costs Project • Competition
• Product performance
Product profit
(net present value)
Figure 3: Factors affecting product profitability.
the consequences of investing more (or less) development time, adding (or re-
moving) product features, using more (or less) expensive components, and so
forth. Each of these decisions has an impact on expected future cash flows and
hence profitability.
For example, if more features are added, the product will become more costly
to manufacture, but marketing intelligence may suggest that this will be more
than offset by increased product attractiveness, leading to a higher selling price
and/or a larger market volume. On the other hand, adding more features to
the product requires a larger up front investment in development, with a longer
development period. NPV analysis shows that the ROI is nevertheless improved
by the addition of more features, although the payback period is increased,
exposing us to more risk. This type of analysis (with hard numbers) is exactly
what management needs, to determine whether or not the decision to add more
features should be taken.
Figure 3 illustrates some of the different types of factors which can influence
profitability of a product development activity. Some of these factors (the in-
ternal ones) are at least partly under our control; others are outside our control,
but still need to be taken into account. Considering the many factors which
influence product profitability, economic analysis provides us with a framework
for making good decisions. By computing NPV, ROI and payback period under
a range of different scenarios, it is possible to understand the potential benefits
and risks of a various design decisions.
In other words, the purpose of economic analysis is to answer “what if” ques-
tions. The answers to these questions are not often obvious, due to conflicting
factors. Figure 4 illustrates the conflicting implications of the internal factors
identified in Figure 3. For example, product performance can generally be en-
hanced by increasing development time, increasing development costs (e.g., by
involving more personnel), and/or including higher quality components. Devel-
opment costs and higher performing components both add to the product cost.
On the other hand, it may be possible to decrease the product cost, without
sacrificing performance, by investing more time in development to come up with
efficient designs.
Perhaps the most important decision of all to be made with the help of
10. c
°Taubman, 2006 ELEC3017: Economics and Costing Page 10
reduce
Development Time Product Cost
increase increase
increase
Product Performance Development Cost
Figure 4: Complex interaction between internal factors over which we have con-
trol.
economic analysis is whether the product development activity should proceed or
not. These so-called “go/no-go” decisions are typically taken at several points,
such as:
1. during an initial design review, shortly after concept generation;
2. once an initial functional prototype has been constructed; and
3. prior to manufacturing ramp-up.
Like all planning decisions, go/no-go decisions should be forward looking.
The fact that we have already spent $10,000,000 developing a revolutionary new
product should not in itself either positively or negatively influence our decision
to proceed (or not to proceed) with the development. All such previous expendi-
ture (and revenue, if any) is known as sunk costs. All we are interested in, from
a rational economic perspective, are future expenses and returns. This is why
NPV is computed based only on future cash flows, converted to present values;
previous cash flows are not relevant. More likely than not, previous expendi-
ture has brought us closer to finalizing the development activity so that future
costs are lower than they were at the start. As a result, each time we review
our economic forecasts, we would normally expect NPV and ROI to increase,
while the payback period decreases, making it progressively less likely that we
will take the decision not to proceed. Nevertheless, it is always possible that
changed circumstances render the activity unprofitable from a forward looking
perspective. When that happens, you should resist the gambler’s compulsion to
recoup sunk costs by plunging blindly on.
4 Non-Economic Considerations
Based on the foregoing discussion, one might conclude that economic merit is
the only sound basis for product development decisions. The reality, however,
is much more complex. First, we should remember that economic indicators
such as NPV are based on estimates of future cash flows, which are far from
perfect. The fact that we can compute answers to 2 decimal places should not
11. c
°Taubman, 2006 ELEC3017: Economics and Costing Page 11
Qualitative factors specific to your company
know best
what you
– ability to leverage design experience for future products
– degree to which product fits long term strategic objectives
– impact on employee morale
– impact on stock price and credit rating
– risk in relation to the company’s financial resources
Qualitative factors in your target market
– expected reaction of competitors to your products
– impact on the brand-name perception amongst consumers
Qualitative factors in the socio-economic environment
know least
what you
– impact of potential changes in consumer buying power
– impact of government regulations
– impact of social trends and expectations of consumers
Figure 5: Various qualitative factors to supplement economic factors as a basis
for product development decisions.
fool us into thinking that they are any more accurate than the underlying data
on which they are based. Indeed, an analysis should normally be conducted to
determine how sensitive our NPV, ROI or payback period conclusions are to the
most critical underlying assumptions. A simple way to do this is just to re-run
the calculations under a variety of different scenarios.
Sometimes, the time and effort required to carefully estimate future cash
flows can get out of hand, detracting from the core business of design. This can
lead to lost productivity and perhaps missing a window of opportunity. Like
all aspects of design, therefore, we must be prepared to accept a compromise
between the quality of the information we have and the need to bring a successful
product to market quickly. Simply put, there needs to be an appropriate balance
between the effort spent planning and forecasting and the effort spent actually
doing the work of design.
Beyond money itself, there are a number of more qualitative factors which
should be factored into product development decisions. From a strategic per-
spective, it may make sense to pursue an economically unprofitable development
activity, because we expect that it will help us to capture a segment of the mar-
ket which we can exploit with future, more profitable products. From a human
resources perspective, it may make sense to continue a development activity in
which engineers have already invested a large amount of design effort, so as to
avoid low morale. Low morale may lead to the loss of experienced personnel
to our competitors, along with their accumulated technical knowledge. Figure
5 provides a more extensive list of qualitative factors which may need to be
12. c
°Taubman, 2006 ELEC3017: Economics and Costing Page 12
factored into decision making processes.
References
[1] Ulrich, K. T. and Eppinger, S. D., Product Design and Development 2 ed ,
McGraw Hill, 2000.